 Research Article
Abstract
The effectiveness of urban trees in mitigating air pollution depends on the selection of air pollution tolerant species. Thus, this study was objectively carried out to estimate the air pollution tolerance index (APTI) of selected tree species, compare their biochemical parameters between control site and polluted sites and assess the anticipated performance index (API) of each species. Altogether 270 mature fresh leaves of Cinnamomum camphora, Ficus benjamina, Ficus elastica, Syzygium cumini and Prunus cerasoides were collected from two polluted sites i.e. road segments from Baneshwor to Tinkune (BT) and Pulchowk -Maitighar (PM) and one suburb site with relatively minimal air pollutants i.e. National Botanical Garden (BG). APTI was calculated by analyzing relative water content, total chlorophyll, pH, ascorbic acid of leaf samples while API was evaluated by integrating the biological and socio-economic characteristics of each species along with their APTI values. The highest APTI was found in Cinnamomum camphora (18.40±2.51) and Ficus elastica (17.421±4.27) respectively, exhibiting higher tolerance to air pollution. Ficus benjamina (13.66±1.09) and Syzygium cumini (11.93±0.411) were moderately tolerant while Prunus cerasoides with the least APTI(10.175±0.51) was sensitive to air pollution. One-way ANOVA followed by Tukey’s b showed significant differences (p<0.05) in APTI values among the species and between them. Ascorbic acid (R2=0.9666) was found to be the most influential factor in determining the air pollution tolerance capacity in plants as shown by Linear regression and principal component analysis. API indicated Cinnamomum camphora and Ficus elastica (API=5) as very good species, Ficus benjamina and Syzygium cumini (API=3) as moderate ones and Prunus cerasoides (API=1) as a poor species for urban greening. This study is useful in identification of suitable species for urban plantation.
Keywords: APTI; API; Air Pollution; Principal Component Analysis
Abbreviations: MCI: Mild Cognitive Impairment, aMCI: amnesic Mild Cognitive Impairment, UPSIT: Pennsylvania Smell Identification Test, VAS: Visual Analogue Scale
Introduction
Relentlessly increasing air pollution has become a serious
global concern. 92% of the world’s population is exposed to a toxic
level of pollution, causing 7 million deaths every year [1]. Pollution
beyond the buffering capacity of an ecosystem is a big threat to the
quality of urban life and the sustainability of urban ecosystem [2].
Today, curbing air pollution is urgent, yet a huge challenge. In this
context, developing urban forest can be an effective, eco-friendly,
economical and sustainable solution for improving the air quality
and enhancing sustainable urban development. Trees act as a
natural sink, removing a significant amount of toxic air pollutants
[3]. It is reported that 1261.4 tons of air pollutants were removed
annually by urban trees in Beijing [4]; 88 tons in Strasbourg city,
France [5]. Similarly, urban green belts in Bangladesh wiped off
65% of the total suspended particulates [6].
nt, its adoption
as a mitigation measure has been affected by poor identification of appropriate plant species in Nepal [7]. Most of the researchers
have used Air Pollution Tolerance Index (APTI) and Anticipated
Performance Index (API) in the selection process of urban vegetation
[8,9]. APTI identifies plant tolerance level to air pollution based on
four biochemical properties of leaf i.e. Total chlorophyll, Ascorbic
Acid, pH and Relative water content [10]. API incorporates some
socioeconomic and biological characteristics of plant species along
with APTI values [11]. Such studies are very limited in Nepal. In
addition, the species recommended for green belt development, are
solely based on single criterion i.e. APTI [12] which is not enough
for determining the suitability of tree species for urban greening [8].
Thus, the present study was conducted to evaluate the performance
of five tree species specifically Cinnamomum camphora, Ficus
benjamina, Ficus elastica, Prunus cerasoides and Syzygium cumini,
commonly planted in Kathmandu valley based on APTI and API.
The performance of these species can be a recommendation for the
selection of plantation species in urban areas.
Materials and Methods
Description of Study Area
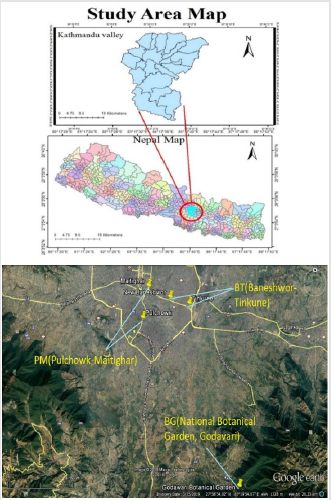
Figure 1: Map of the study area.
Kathmandu valley is located between latitudes 27°32’13” and 27°49’10” N and longitudes 85°11’31” and 85°31’38” E at an altitude of 1,300-1400 m above sea level. The valley is composed of three districts: Kathmandu, Lalitpur, and Bhaktapur together occupying an area of 899 km2. It has a subtropical, temperate climate with an average annual rainfall of 1400 mm. Kathmandu, being the fastest urbanizing city in South Asia [13] with a 4.3 % annual population growth rate [14], it is no wonder that the capital is facing severe pollution. The particulate matter in the valley is above WHO guidelines. It was ranked as the seventh most polluted city in the world marking it an unhealthy place to live in [15]. Three study sites within the valley were selected. Specifically, two sites bearing heavy traffic loads were selected as Polluted sites (PS) i.e. Road segments from Baneshwor to Tinkune (BT) and Pulchowk to Maitighar (PM) and One suburb site, i.e. National Botanical Garden, Godavari (BG) located quite far from city, near to forest, with relatively minimal air pollutants was chosen as Control site (Figure 1).
Sampling Procedure
Total five tree species namely Cinnamomum camphora, Ficus benjamina, Ficus elastica, Prunus cerasoides and Syzygium cumini commonly planted in all study sites were selected. Leaf samples were collected from three trees of each species at each site from 18th-28th March 2019. Tree species with a similar diameter at breast height and environmental status were taken as triplicates. Altogether 270 mature fresh leaves were collected from trees 1-2 m [16] above ground. Leaves facing traffic were considered when sampling at polluted sites. Collections were made during the peak crushing time (8-11 A.M.) [15]. The samples were placed into a sealed plastic bag, taken to the laboratory and preserved in refrigerator for analysis.
Lab Analysis of Leaf Samples
Biochemical parameters of the plant such as Relative Water Content, Total Chlorophyll, leaf extract pH, Ascorbic Acid were analyzed in the lab.
Relative Water Content (%)
Relative Water Content (RWC) was determined following formula [9]
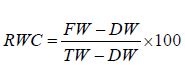
FW = Fresh weight of leaf samples, TW= Turgid weight obtained
after immersion in water for 24 h,
DW = Dry weight of turgid leaves after oven-dried at 105°C for
2 hours
Ascorbic Acid (mg/g)
It was measured using a spectrophotometric method [17]. For this, 1 g of the fresh foliage was put in a test-tube, 4 ml oxalic acid - EDTA extracting solution was added. After that, 1 ml of orthophosphoric acid, 1ml of 5% sulphur acid, 2 ml of ammonium molybdate, 3 ml of water were added respectively. The solution was kept still for 15 minutes after which the absorbance at 760 nm was measured with a spectrophotometer. The concentration of ascorbic acid in the samples was calculated from a standard ascorbic acid curve.
pH
3 g of the fresh leaves were homogenized in 30 ml de-ionized water. This mixture was filtered, and the pH of the leaf extract was determined after calibrating pH-meter with a buffer solution of pH 4 and pH 9 [17].
Total Chlorophyll (mg/g)
Total Chlorophyll was estimated following the method of [18]. 1 g of fresh leaves was blended and extracted with 10 ml of 80% acetone and left for 15 min. The liquid portion was decanted into another test tube and centrifuged at 2,500 rpm for 3 min after which absorbance was measured at 645 nm and 663 nm using a spectrophotometer [19]. The calculation was done using the equation given below.
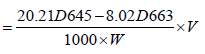
Where, D = absorbance of leaf extract at a specific wavelength, V =total volume of chlorophyll solution (ml), W = weight of tissue extract (g)
APTI Calculation
APTI was calculated as proposed by [10] after all four parameters were analyzed.
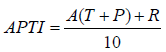
Where, A = Ascorbic acid (mg/g), T = Total chlorophyll (mg/g), P= pH of leaf extract, R = Relative water content of leaf (%). Based on APTI values each species was categorized as follows; ≤11 as sensitive, 12–16 as intermediate and ≥17 as tolerant [20].
Evaluation of Anticipated Performance Index (API)
API was evaluated by integrating APTI values with the biological and socioeconomic characteristics of tree species. The method of determining the API for species is shown in (Tables 1 & 2) [21]. Based on this pattern, tree species were graded.
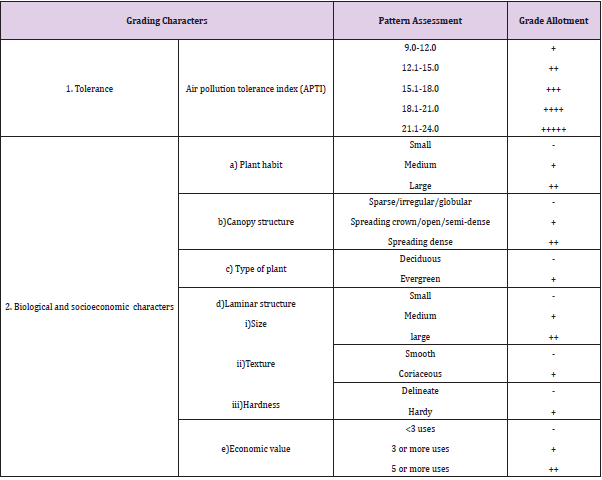
Table 1: Grading characteristics pattern assessment and grade allotment.
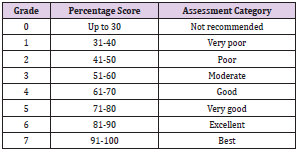
Table 2: Category assessment table based on percentage score.
Statistical Analysis
The normality of data was tested using Kolmogorov and Shapiro-Wilk test. One-way ANOVA and Tukey’s b were applied for comparison of the biochemical parameters of tree species. Linear regression analysis between APTI and biochemical parameters was also performed [22].
Results
Biochemical Parameters of Species
Biochemical analysis showed that Ascorbic Acid (AA), Relative Water Content (RWC), Total chlorophyll (TCH), APTI were higher in species from polluted sites than their counterparts from the control site. pH of Cinnamomum camphora, Ficus benjamina, Prunus cerasoides from polluted sites was lower (acidic) as compared to the control site. Cinnamomum camphora showed the significant change (p<0.05) in pH between control and polluted site but no significant difference was observed across the polluted sites. Total chlorophyll content (TCH) in species varied across the study sites. TCH in Ficus elastica differed significantly (p<0.05) from the control. The highest chlorophyll for Ficus benjamina, Syzygium cumini, Cinnamomum camphora, and Prunus cerasoides were recorded at Polluted site (BT), while Ficus elastica gave the highest chlorophyll at polluted site (PM). Among five species, maximum TCH was found in Cinnamomum camphora (1.084±0.02) whereas Prunus cerasoides (0.05±0.01) had the least chlorophyll. Ascorbic acid in Ficus elastica (16.11± 3.03) was maximum while, minimum AA was found in Prunus cerasoides (0.66±0.30). A significant difference (p<0.05) in AA was observed for Ficus benjamina among the study sites. The highest Relative Water Content was found in Cinnamomum camphora (98.07±0.52) while the least was observed in Prunus cerasoides (76.59±1.45). RWC in Ficus elastica varied significantly (p<0.05) across the sites.
APTI of Cinnamomum Camphora, Ficus Elastica, Ficus Benjamina, Prunus Cerasoides and Syzygium Cumini
APTI (Table 3) indicated that Cinnamomum camphora (18.40±2.15) has the highest tolerance to air pollution followed by Ficus elastica (17.42±4.21). Ficus benjamina (13.66±1.09) and Syzygium cumini (11.93±0.41) are intermediate. Prunus cerasoides (10.17±0.51) with the least APTI is sensitive to pollution. Ficus benjamina showed a significant difference (p<0.05) in APTI across the study sites.
API Assessment of Species
API (Table 4) revealed that Cinnamomum camphora and Ficus elastica are very good performers (75%). Ficus benjamina and Syzygium cumini are moderate performers (56.25%). Prunus cerasoides scored the least (31.25%) making it a poor performer in urban greening.
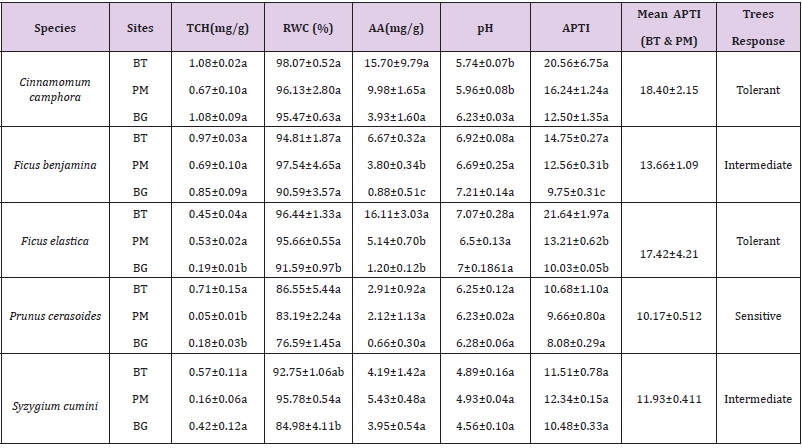
Table 3: Biochemical parameters and APTI of selected species from three study sites and their categorization.
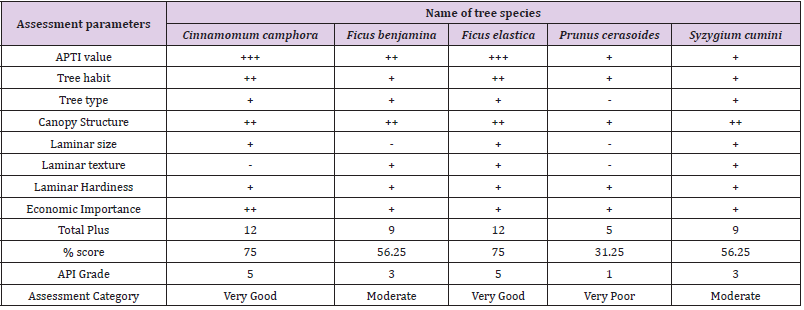
Table 4: Anticipated Performance Index (API) of tree species.
Correlation of Biochemical Parameters with Apti
The linear regression plots of four biochemical parameters with APTI (Figure 2) showed a high positive correlation (p<0.05) between APTI and ascorbic acid (R2= 0.966). Low positive correlation (p<0.05) existed between APTI and chlorophyll content (R2= 0.119), RWC (R2 = 0.297) and APTI. An insignificant correlation was found between APTI and pH (R2 =0.0049). Principal Component Analysis (Figure 3) also showed that among the four biochemical parameters, ascorbic acid is highly correlated with APTI.
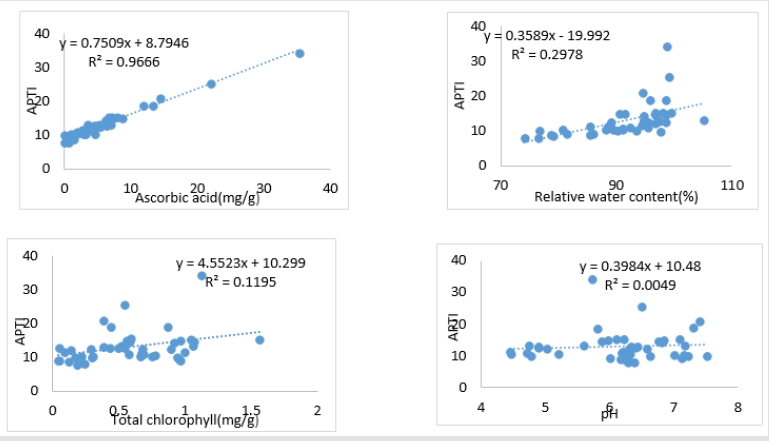
Figure 2: Linear regression between APTI and biochemical parameters.
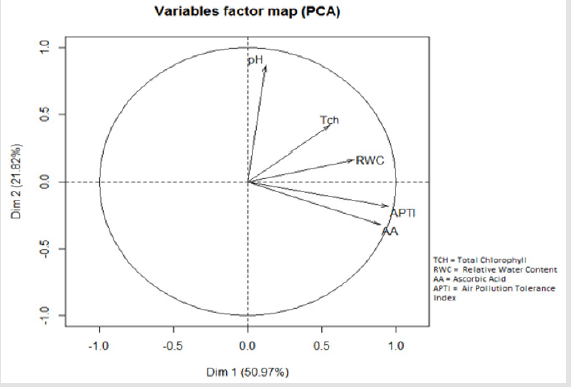
Figure 3: Principal component analysis of biochemical parameters with APTI.
Discussion
Ascorbic acid (AA) is an antioxidant, which safeguards plants from oxidative stress. It imparts resistance to plants by functioning as a redox buffer, which reduces and neutralize reactive oxygen species (ROS) [23]. It also detoxifies SO2 content in polluted plants [24]. The higher value of AA in experimental plants may be due to heavy production ROS in a polluted environment, which led species to increase AA as defense mechanisms to counteract pollution stress [17]. Maximum AA content in Ficus elastica determines its strength to withstand pollution effects. High relative water content in species from polluted sites signifies plants adaptive features for maintaining their life processes during stressed conditions. [25,26] also recorded high RWC under a polluted environment. As RWC favors drought and pollution resistance in plants, Cinnamomum camphora with maximum water content indicates its tolerance to pollution pressure. Acidic nature in species from the polluted site could be attributed to the presence of acidic pollutants (especially SO2) in the air, which triggers the manufacture of H+ ions. These ions react with SO2, forming sulphur acid and eventually reducing leaf pH [27]. It has been reported that a high level of pH increases tolerance capacity [28] thus, Ficus elastica maintaining neutral pH under pollution may be tolerant.
Maximum chlorophyll content was recorded at polluted sites, which contrasts with the study of several researchers who reported a reduction in chlorophyll under pollution. However [8,29] recorded an increase in chlorophyll with the rise in pollution. This could be due to an increased level of CO2 and high temperatures in urban and industrial areas, which favored plant growth as demonstrated by [30,31] also showed an increase in photosynthesis and biomass of Glycine max due to elevated CO2 levels. Apart from the pollution level, chlorophyll content also varies with the tolerance and sensitivity of the plant species [16]. Thus, Cinnamomum camphora exhibiting the highest total chlorophyll reflects its tolerance nature. Findings revealed that the tolerance capacity of plants differs according to species and pollution level. High APTI values in all the species at polluted sites may be due to physiological changes that plants undergo during pollution stress [32]. Possibly plants adjust to the polluted environment by virtue of these changes in biochemical parameters which eventually increase the APTI. Species with high API grade are recommended for plantation in urban and industrial areas [25]. In this regard, Cinnamomum camphora and Ficus elastica are considered to be very good performers. Their tolerant nature along with favorable morphological characters and economic values make them suitable species for urban greening.
Conclusion
Pollution induces changes in biochemical parameters of plants, which in turn cause variation in their tolerance capabilities. Among the four biochemical parameters, ascorbic acid is the most influential factor for providing tolerance against air pollution. The present study highlights the importance of evaluating the performance index in the selection process of urban vegetation. This study suggests that Cinnamomum camphora and Ficus elastica would be good candidates for urban forest development.
Acknowledgement
We are thankful to Central Department of Environmental Science, Tribhuvan University, WWF Nepal, Kathmandu Forestry College, National Botanical Garden, Godavari for their technical support in completing this research.
References
- HEI/IHME (2019) State of Global Air a special report on Global Exposure to Air Pollution and its Disease Burden Health Effect Institute and the Institute for Health Matrices and Evaluation 75 Federal Street Suite 1400 Boston USA.
- (2002) UNEP, Global Environment Outlook 3: Past Present and Future perspectives. London UK Earthscan. United Nations Environment Programme.
- Shannigrahi A, Sharma R, Fukushima T (2003) Air pollution control by optimal green belt development around the Victoria Memorial monument Kolkata India. International Journal of Environmental Studies 60: 241-249.
- Yang J, Mc Bride J, Zhou JX, Sun ZY (2005) The urban forest in Beijing and its role in air pollution reduction. Urban Forestry & Urban Greening 3: 65-78.
- Selmi W, Weber C, Rivière E, Blond N, Mehdi L, et al. (2016) Air pollution removal by trees in public green spaces in Strasbourg city, France. Urban Forestry & Urban Greening 17: 192-201.
- Islam MN, Rahman KS, Bahar MM, Habib MA, Ando K, et al. (2012) Pollution attenuation by roadside greenbelt in and around urban areas. Urban Forestry & Urban Greening 11(4): 460-464.
- Lamichhane D, Thap HB (2012) Participatory urban forestry in Nepal Gaps and ways forward. Urban Forestry, & Urban Greening 11(2): 105-111.
- Ogunkunle CO, Suleiman LB, Oyedeji S, Awotoye OO, Fatoba PO, et al. (2015) Assessing the Air pollution tolerance index and Anticipated performance index of some tree species for biomonitoring environmental health. Agroforestry system 89: 447-454.
- Liu YJ, Ding H (2008) Variation in Air pollution tolerance index of plants near a steel factory: Implications for landscape plant species selection for industrial areas. WSEAS Transaction on Environment and Development 4: 24-32.
- Singh SK, Rao DN (1983) Evaluation of plants for their tolerance to air pollution. Proceedings Symposium on Air pollution control New Delhi India.
- Govindaraju M, Ganeshkumar RS, Muthukumaran VR, Visvanathan P (2012) Identification and evaluation of air-pollution tolerant plants around lignite-based thermal power station for greenbelt development. Environment Science Pollution Restoration 19(4): 1210-1223.
- Kanwar K, Dhamala MK, Byanju RM (2016) Air pollution tolerance index: An approach towards the effective green belt around Kathmandu metropolitan city Nepal. Nepal Journal of Environment Science 4: 23-29.
- (2014) UNDESA, World Urbanization Prospects. The 2014 Revision; United Nations Department of Economic and Social Affairs New York USA.
- (2011) CBS, National Population and Housing Census 2011; Government of Nepal: Kathmandu Nepal Central Bureau of Statistics.
- Gurung A, Bell ML (2012) Exposure to airborne particulate matter in Kathmandu valley Nepal. Journal of Exposure Science and Environmental Epidemiology 22: 235-242.
- Chouhan A, Iqbal S, Maheswari RS, Bafna A (2012) Study of air pollution tolerance index of plants growing in Pithampur Industrial area sector 1 2 and 3. Research Journal of Recent Sciences 1: 172-177.
- Bajaj KL, Kaur G (1981) Spectrophotometric Determination of ascorbic acid in vegetables and fruits. Analyst 106: 117-120.
- Arnon DL (1949) Copper enzymes in isolated chloroplasts polyphenol oxidase in Beta vulgaris. Plant Physiology 24: 1-15.
- Agbaire PO, Esiefarienrhe E (2009) Air pollution tolerance indices (APTI) of some plants around Otorogun gas plant in Delta State Nigeria. Journal of Applied Science Environment and Management 13: 11-14.
- Padmavathi P, Cherukuri J, Reddy MA (2013) Impact of Air pollution on crops in the vicinity of a power plant, a case study. International Journal of Engineering Research and Technology 2 (12): 3641-3651.
- Prajapati SK, Tripathi BD (2008) Anticipated Performance Index of some tree species considered for green belt development in and around an urban area: A case study of Varanasi city India. Journal of Environmental Management 88: 1343-1349.
- Kothari CR (2004) Research Methodology New Age International Pvt Ltd. Publisher Ansari Road Daryaganj New Delhi.
- Sharma P, Jha AB, Dubey RS, Pessarakli M (2012) Reactive Oxygen Species Oxidative Damage and Antioxidative Defense Mechanism in Plants under Stressful Conditions. Journal of Botany.
- Keller T, Schwager H (1977) Air pollution and ascorbic acid. European Journal of Forest Pathology 7: 338-350.
- Tsega YC, Prasad AG (2014) Variation in Air pollution tolerance index and anticipated performance index of roadside plants in Mysore India. Journal of Environmental Biology 35: 185-190.
- Rai PK, Panda LLS, Chutia BM, Singh MM (2013) Comparative assessment of air pollution tolerance index (APTI) in the industrial (Rourkela) and non-industrial area (Aizawl) of India: An eco-management approach. African Journal of Environmental Science and Technology 7(10): 944-948.
- Swami A, Bhatt D, Joshi PC (2013) Effects of automobile pollution on sal (Shorea robusta) and rohini (Mallotus phillipinensis) at Asarori Dehradun. Himalayan Journal of Environment Zoology 18(1): 57- 61.
- Escobedo FH, Wagner JE, Nowak DJ, De Le Maza CL, Rodriguez M, et al. (2008) Analyzing the cost-effectiveness of Santiago: Chile's policy of using urban forests to improve air quality. Journal of Environment Management 86(1): 148-157.
- Nwadinigwe AO (2013) Air pollution tolerance indices of some plants around Ama industrial complex in Enugu State Nigeria. African Journal of Biotechnology 13: 1231-1236.
- Poorter H (1993) Interspecific variation in the growth response to an elevated and ambient CO2 concentration. Vegetation 77-97.
- Allen LH, Boote KL, Jones W, Jones PH, Valle RR, et al. (1987) Response of vegetation to rising carbon dioxide photosynthesis: biomass and seed yield of Soybeans. Global Biogeochemical Cycles 13: 1-44.
- Dohmen GP, Koppers A, Langebartels C (1990) Biochemical response of Norway spruce (Picea abies L.) Karst) towards 14-month exposure to ozone and acid mist: effects on amino acid, glutathione and polyamine titers. Environ Pollut 64: 375-383.
