Impact Factor : 0.548
- NLM ID: 101723284
- OCoLC: 999826537
- LCCN: 2017202541
Tomoe Ueyama1, Shu Nakao1, Tasuku Tsukamoto1, Dai Ihara1, Yukihiro Harada1, Yuka Akagi1, Shohei Torii1, Sae Nakagawa1, Tomoaki Ishida1, Takahiro Sogo2 and Teruhisa Kawamura*1
Received: December 04, 2019; Published: January 02, 2019
*Corresponding author: Teruhisa Kawamura, Laboratory of Stem Cell and Regenerative Medicine, Department of Biomedical Sciences, College of Life Sciences, Japan
DOI: 10.26717/BJSTR.2019.12.002283
Induced pluripotent stem cells (iPSCs) are produced by introduction of the defined factors (Oct4, Sox2, Klf4, c-Myc: OSKM), and exhibit infinitive self-renewal and pluripotency. However, iPSCs are not efficiently established, and the details of precursor cells toward iPSCs remain uncovered. Although we previously proposed a surface marker profile Sca1-CD34- as iPSC progenitors, several studies reported that SSEA1+ and CD44-CD54+ cell populations are also predictors for successful reprogramming. Here we examine the detailed correlation of surface marker expression profiles among Sca1, CD34, CD44, CD54, and SSEA1. Following OSKM-infection in mouse embryonic fibroblasts, cell surface marker genes, Sca1 and CD34 were upregulated. Fluorescence-activated cell sorting analysis showed that the highest incidence of iPSC colony formation was observed in Sca1-CD34- cells sorted in the early-to-mid phase of reprogramming, when SSEA1 is barely detected.
In contrast, in the late phase, half of Sca1-CD34- population expressed SSEA1, whereas CD44- cells displayed the lower percentage of SSEA1-positive regardless of CD54 expression. In addition, favorable efficiency of iPSC induction from Sca1-CD34- cells was also observed in somatic cells reprogrammed by OSK and L-Myc instead of oncogenic c-Myc. Altogether, the surface marker profile Sca1-CD34- is a more sensitive early predictor for bona fide iPSC progenitors, and it may shed light on the molecular basis of successful reprogramming to iPSCs.
Keywords: Induced pluripotent stem cell; Reprogramming; SSEA1; Sca1; CD34; CD44; CD54
Abbrevations: ACD34: cluster of Differentiation Gene 34; CD44: Cluster of Differentiation Gene 44; CD54: Cluster of Differentiation Gene 54; FACS: Fluorescence-Activated cell sorting; GFP: Green Fluorescent Protein; iPSC: Induced Pluripotent Stem Cell; LIF: Leukemia Inhibitory Factor; MEF: Mouse Embryonic Fibroblast; Sca1: Stem Cell Antigen 1; SSEA1: Stage Specific Embryogenic Antigen 1
Induced pluripotent stem cells (iPSCs) are generated from somatic cells by introduction of Yamanaka factors comprised of Oct4, Sox2, Klf4, and c-Myc (OSKM), and they are highly desired for applications in regenerative medicine, tailor-made therapy, and disease modeling [1,2]. iPSCs derived from patients’ somatic cells are thought to minimize graft rejection when they are implanted into the target tissue. In addition, it is not necessary to consider an ethical issue accompanied with embryonic stem cells. However, due to the low efficiency of iPSC formation and heterogeneity in the reprogramming process, it remains difficult to gain insights into the molecular basis of successful reprogramming to iPSCs. To address these issues above, we have recently revealed that a certain surface marker profile determines a cell population in which bona fide reprogramming progenitors is highly enriched [3]. We previously performed microarray analysis to identify surface marker profiles for bona fide iPSC progenitors [3].
Based on 886 genes registered as surface markers in a Gene Ontology database, we explored surface marker genes regulated by introduction of reprogramming OSKM in mouse embryonic fibroblasts (MEFs). There were 61 upregulated and 131 downregulated genes by OSKM introduction at the early phase of reprogramming. Among these candidate marker genes, we focused on stem cell antigen 1 (Sca1) and cluster of differentiation gene 34 (CD34), also known as marker genes of hematopoietic stem cells, and examined their involvement in successful reprogramming to iPSCs. Although expressions of Sca1 and CD34 are induced by OSKM at the early state of the reprogramming process, they are not detectable in undifferentiated iPSCs. Of note, we have recently revealed that Sca1-CD34- surface marker profile determines a cell population in which bona fide reprogramming progenitors is highly enriched (Kida et al.). Sca1-CD34- cells on day5, early-to-mid phase of reprogramming, efficiently produce iPSC colonies positive for Nanog, a specific marker of undifferentiated pluripotent stem cells. Thus, Sca1 and CD34 would be available to distinguish iPSC early progenitors. In contrast, cell populations apart from Sca1-CD34- cells may give rise to cell conversion to other cell types or undergo apoptotic cell death. We assessed, in the present study, further details of Sca1-CD34- population, and we showed that this pool of intermediate cells at the late stage revealed a high incidence of preiPSCs positive for stage-specific embryogenic antigen 1 (SSEA1), reported as another surface marker of iPSC progenitor. Our results also indicate that Sca1-CD34- profile is a useful early predictor for successful reprogramming to iPSCs.
MEFs used as somatic cells for this study were prepared from C57B/6 mouse embryos E13.5 to E14.5. MEFs were cultured in a medium containing Dulbecco’s Modified Eagle Medium (Nacalai Tesque, Japan), 10% fetal bovine serum (Nichirei Bioscience, Japan), 2 mM L-glutamine (GlutaMAX, GIBCO), and 1% (10,000 U/L and 10 mM) penicillin-streptomycin (Wako, Japan). We performed iPSC induction as previously described [3]. We used retroviral vectors as follows: pMXs-mOct4, pMXs-mSox2, pMXs-mKlf4, pMXs-mcMyc, pMXs-null. Following transfection of these plasmids to HEK293T packaging cells, the supernatant of the medium for transfected cells were used as virus-containing solution. The day when MEFs were incubated in the virus-containing solution was set as day 0. Two days after infection, cells being reprogrammed were maintained in a LIF-supplemented medium for undifferentiated iPSCs as previously described [3]. Cell culture was performed in the condition at 37°C and 5% CO2 in a humidified incubator.
Based on a standard protocol for ABC staining, immunolabeling of iPSC colonies were performed using the Vecta Stain ABC kit and ImmPACT DAB substrate (Vector Laboratories) with polyclonal rabbit anti-mouse Nanog (Calbiochem) antibodies as previously described [4]. Nanog-positive colonies were counted under a stereomicroscope.
Cells infected with OSKM were sorted by FACS (FACSAria III, BD Biosciences) at 2, 5, or 13 days after infection using FITC-conjugated or APC-conjugated anti-Sca1, PE-conjugated anti-CD34, PEconjugated anti-CD44, Alexa Fluor 647-conjugated anti-CD54, and PE or APC-conjugated anti-SSEA1 antibodies. After trypsinization, cultured cells were resuspended with antibody-containing D-PBS (-) containing 1% fetal bovine serum (Nichirei Bioscience) and 1 mM 2NA (EDTA-2Na) at 4°C for 1 hour, then washed twice. The cells were resuspended at up to 5.0 x 10⁶ cells/mL in the buffer solution and subjected to FACS. Acquired data were analyzed with FlowJo software (FlowJo, LLC).
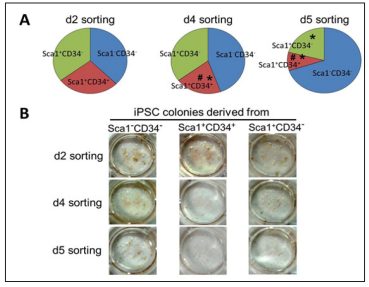
First, we examined the crucial timing to detect the Sca1-CD34- population for the most favorable efficiency of reprogramming to pluripotency. We performed FACS analysis after OSKM-infection in MEFs at days 2, 4, and 5. The sorted cells were subsequently replaced and cultured for iPSC generation. Subsequently, to evaluate reprogramming efficiency, we performed immunostaining using antibodies against Nanog, one of the specific markers for undifferentiated iPSCs. We observed significant increases in reprogramming efficiency originated from the Sca1-CD34- cell population sorted at day 4, compared to day2 at which there were almost no differences among all cell populations. However, the efficiency was remarkably increased in Sca1-CD34- cells sorted at day 5 (Figure 1A and 1B), demonstrating that detecting the Sca1-CD34- profile at day 5 is most effective to predict successful reprogramming to iPSCs.
Figure 1: Reprogramming efficiency from cell populations with different Sca1/CD34 expression profiles at days 2, 4, and 5 after OSKM-introduction. (A) and (B) The total number.
a) And representative photographs
b) Of Nanog-positive iPSC colonies derived from Sca1-CD34-, Sca1+CD34+, and Sca1+CD34- cell populations sorted at days 2, 4, and 5.
* p < 0.05 vs Sca1-CD34-, # p < 0.05 vs Sca1+CD34-.

Whereas our previous study revealed that Sca1-CD34- cells exhibit high reprogramming to iPSCs, several studies addressed that a surface marker profile of SSEA1+ or CD44-CD54+ can prospect successful reprogramming [5,6]. Stadtfeld and colleagues used doxycycline- inducible vectors to temporally express OSKM. They found that downregulation of Thy1, a surface marker for fibroblasts and other differentiated cells types [5], and subsequent upregulation of SSEA1 are the dynamic profile changes indicating an intermediate cell population with high potential to become iPSCs [6]. O’Malley et al. examined progression of the reprogramming process with expression profile changes of surface markers, CD44 and CD45. As a result, the CD44-CD54+ population sorted in the relatively late stage also displayed efficient iPSC colony formation to fully reprogrammed iPSCs [7].
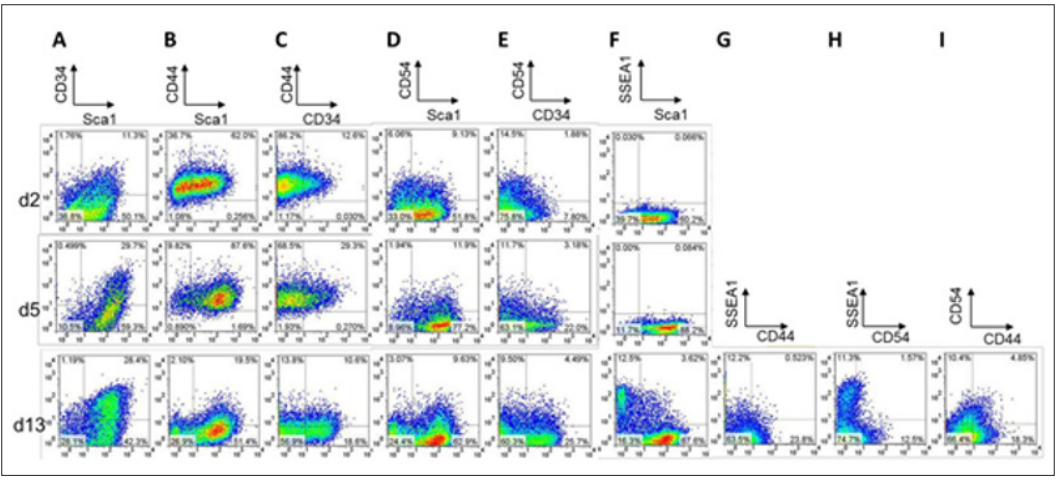
We, therefore, examined correlation among expression patterns of Sca1, CD34, CD44, CD54, and SSEA1 in reprogramming cells at the early (day 2), early-to-mid (day 5), and late (day 13) phases of the reprogramming process. FACS analysis at each time point indicated above revealed that Sca1-negative cells comprised only a small fraction (approximately 10%) at day 5 but increased to approximately 30% at day 13 (Figure 2A, 2B, 2D, and 2F). CD34, which is not detected in MEF, was positive only in 10% at day 2, but approximately 30% of the reprogramming cells at days 5 and 13 (Figure 2A, 2C and 2E). Sca1-CD34- population increased to 28% by day 13, half of which were SSEA1-positive (Figure 2A and 2F). As SSEA1 is a surface marker for undifferentiated iPSCs and iPSC progenitors [8], these results suggest that the majority of Sca1- CD34- cells would become SSEA1-positive cells. For the expression profile of CD44 and CD54, however, there was no significant correlation to that of Sca1 and CD34.
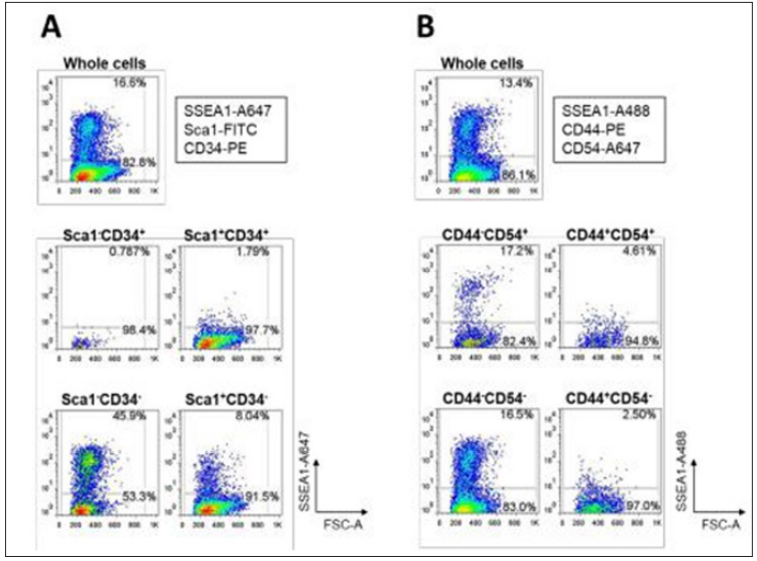
Majority of CD44- or CD54+ cells were SSEA-negative (Figure 2G and 2H), and the CD44-CD54+ population occupied at only 10% of the reprogramming cells (Figure 2I) at the late state of the reprogramming process. Moreover, SSEA1-positive population was barely detectable at days 2 and 5, finally increasing up to 16% at day 13 (Figure 2F). These findings suggest that the Sca1-CD34- population appears different from CD44+CD54- cells, but rather similar to SSEA1-positive cells in the dynamics of iPSC reprogramming. Therefore, the surface marker profile Sca1-CD34- would be possibly a more sensitive predictor of successful reprogramming to pluripotency. Focusing on the role of SSEA1 as a reprogramming predictor, we examined correlation between SSEA1 expression and surface marker profiles of either Sca1/CD34 or CD44/CD54 in OSKM- introduced MEFs at the late state (day 13) of reprogramming. As shown in (Figure 3A) SSEA1-positive cells were most evidently enriched in the fraction of Sca1-CD34- (45.9%), secondly in the Sca1+CD34- fraction (but only 8.0%). Conversely, CD44- cells exhibited relatively high SSEA1 expression (approximately 17%) regardless of CD54 positivity (Figure 3B).
Figure 2: FACS plots of correlations of expression profiles among surface markers: Sca1, CD34, CD44, CD54, and SSEA1 at the early (day 2), intermediate (day 5), and late (day 13) phases of reprogramming in MEFs introduced with OSKM. (A) through (I) Correlation between Sca1 and CD43 (A), Sca1 and CD44 (B), CD34 and CD44 (C), Sca1 and CD54 (D), CD34 and CD54 (E), Sca1 and SSEA1 (F), CD44 and SSEA1 (G), CD54 and SSEA1 (H), and CD44 and CD53 (I) are shown.

Figure 3: FACS plots of correlations between SSEA1 enrichment and various surface marker profiles in MEFs undergoing reprogramming to pluripotency at day 13 after OSKM-infection. (A) and (B) Correlation between SSEA1 enrichment and Sca1/ CD34 profiles (A) and CD44/CD54 profiles (B) are shown.

These results also support our proposal that reprogramming behavior of Sca1-CD34- cells seems to overlap with that of SSEA1-positive cells. Different characteristics of the CD44-CD54+ population compared to those of the Sca1-CD34- population might be due to different detection systems for undifferentiated iPSCs. O’Malley and colleagues used Nanog-eGFP reporter cells in which GFP is expressed under the control of the Nanog promoter [7], whereas we detected undifferentiated iPSCs with immunocytochemistry using anti-Nanog antibodies.
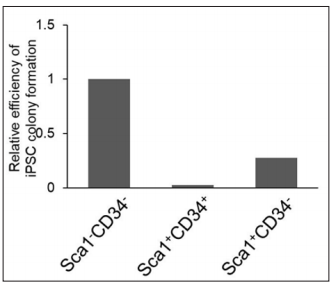
In addition, we tested whether the Sca1-CD34- population even displayed a high rate of successful reprogramming when iPSCs were generated from somatic cells infected with other combinations of reprogramming factors. c-Myc is also known as an oncogene, thus it elevates the incidence of tumor formation [9]. Myc proto-oncogene family is comprised of c-Myc, N-Myc, and L-Myc. c-Myc and N-Myc share characteristics in structure and tumorigenicity [10]. In contrast, L-Myc has a shorter structure and shows significantly lower transformation activity in cultured cells [11]. L-Myc also enhances reprogramming efficiency [9]. We, therefore, induced reprogramming to iPSCs using retroviral vectors expressing Oct4, Sox2, Klf4, and L-Myc instead of c-Myc. As observed in OSKMinduced iPSCs, we confirmed the same reprogramming efficiency that the Sca1-CD34- population exhibited as the most significant cell source of successful reprogramming (Figure 4). Although L-Myc is the only available example of a c-Myc alternative, further investigations will gain insights into the substantial potential of the Sca1-CD34- cell population for successful reprogramming to pluripotency.
Figure 4: Reprogramming efficiency from cell populations with different Sca1/CD34 expression profiles at day 5 after infection of OSK and L-Myc. Values of the bar graphs are shown as relative to Sca1+CD34- population.

Sca1-CD34- is the surface marker profile detectable at the early reprogramming stage, and it reflects successfully reprogrammed cells, half of which exhibit SSEA1 expression at the late stage. The surface marker combination of Sca1 and CD34 is a more sensitive predictor for bona fide iPSC progenitors in the early phase, and it will be useful to shed light on the molecular mechanism of successful reprogramming to iPSCs.


