Impact Factor : 0.548
- NLM ID: 101723284
- OCoLC: 999826537
- LCCN: 2017202541
Fawzia Jassim Shalsh1, Noor Azlina Ibrahim*2, Mohammed Arifullah2 and Anis Shobirin Binti Meor Hussin3
Received: December 12, 2018; Published: January 02, 2019
*Corresponding author: Noor Azlina Ibrahim, Faculty of Agro Based Industry, Malaysia
DOI: 10.26717/BJSTR.2019.12.002272
Protoplast fusion is a common approach used to improve fermentation of industrial yeast strains. Molecular study using DNA content, RAPD, DNA sequences and protein profile were applied to differentiate between S. cerevisiae and P. stipitis ATCC 58785 and their fusants from protoplast fusion for improvement of biofuel production from biomass. Fusants were showed higher DNA content than that in the parental strain and DNA concentration obtained for recently generated fusant was generally lower compared to the values expected by the theoretical addition of DNA concentration from the respective parental strains. Fusants were showed new combination of DNA fragment patterns. The DNA sequencing, which includes two non-coding regions designated as the internal transcribed spacers (ITS1 and ITS2) and the 5.8S gene were performed for further confirmation of the fusant nature of fusants. According to genetic similarity and intra-species differentiation, two parent strains and fusants were grouped into two different clusters. S. cerevisiae which correspond to 88% sequence similarity whereas approximately 97% similarity was observed with P. stipitis ATCC 58785.
The sequence of the ITS1, ITS2 and the 5.8S gene of each fusants was submitted to Genbank with the NCBI ACESSION NO. In general, the obtained new combination of DNA fragment patterns and the presence of new DNA fragment or the absence of existing parental DNA fragments in the fusant strains compared to their parents could be considered as indicator of nuclear fusion of the two parental nuclei in the fused protoplasts, also differences in polypeptide profile on SDS-PAGE analysis were investigated. The polypeptide profile was seen with reference to a protein ladder (GangNam-STAIN™ Prestained). SDS–PAGE protein analysis of the selected fusants and their parental strains confirmed that all fusant strains acquired and expressed many specific protein bands from the parental strains.
Keywords: S cerevisiae; P stipites; Protoplast fusion; Biofuel
Protoplast fusion is a conventional technique even though it has been shown to be successful for strain enhancement and it is seen as significant in constructing yeast strains as it mitigates the challenges of genetic modification enforced by traditional mating systems and supports the movement of sizeable segments of genomic DNA. Protoplast fusion is a common approach used to improve fermentation of industrial yeast strains [1-3]. The ease of the technical application in addition to the materials needed for this approach makes protoplast fusion the most extensively employed technique of transformation in fungi. Hence, enzymatic approaches for proto plasting have been preferred in most laboratories [4].
This study used two yeast strains S. cerevisiae and P. stipitis ATCC 58785. P. stipitis ATCC 58785 was bought from the American Type Culture Collection (ATCC). The fusant obtained from yeast by protoplast fusion.
a) The genomic DNA of S. Cerevisiae, P. Stipitis ATCC 58785 and the best tolerance fusants were extracted using AMRESCO’s Yeast Genomic DNA Purification Kit.
b) Agarose gel electrophoresis of DNA
c) All samples of genomic DNA were analyzed by agarose gel electrophoresis according to [5].
d) Random amplified polymorphic DNA (RAPD)
PCR reaction was performed with one set of primer with following 5′- 3′ sequences OP-M05 (GGGAAGCGTG) and OP-V09 (TGTACCCGTC) [6]. The 10 μM of each primer and 25 ng ̸ μL of genomic DNA were mixed with 25 μL of Maxime PCR PreMix as in Table 1. The components of the Maxime PCR PreMix kit (i-Taq) contain of i-Taq DNA polymerase (5U/μL), dNTPs (2.5 mM), 10X Reaction buffer and 1X loading buffer. The PCR was carried out in a thermal cycler programmed as in Table 2 using a thermal cycler (Gene Amp, PCR system 9700, Applied Biosystem). The PCR products were detected using 1.5% agarose gel.
Amplification of ITS Sequence Region: Detection of ITS sequence region for fusants strains was conducted using primers for amplification [7,8]. Fragment 600 bp of ITS region was amplified using a forward primer ITS1 (5′- TCCGTAGGTGAACCTGCGG -3′) and a reverse primer ITS4 (5′- TCCTCCGCTTATTGATATGC-3′) [9]. The PCR amplification was performed in a total volume of 25μl containing 1.5μL DNA (25 ng ̸ μL), 5 μL Taq PCR PreMix, 1μL of each primer then distilled water was added into tube to a total volume of 25 μL. The thermal cycling conditions was carried out in a thermal cycler programmed as in Table 3 using a thermal Cycler (Gene Amp, PCR system 9700, Applied Biosystem). The PCR products were detected using 1.5% agarose gel.
Sequencing of gene was performed by National Instrumentation Center for Environmental Management (NICEM), Korea using DNA sequencer 3730XL (Applied Biosystem, Macro Gen Company, USA). Homology search was conducted using Basic Local Alignment Search Tool (BLAST) program which is available at the National Centre Biotechnology Information (NCBI) online at http:// www. ncbi.nlm.nih.gov and BioEdit program. Phylogenetic tree was constructed using neighbor-joining method implemented by Molecular Evolutionary Genetics Analysis (MEGA 6.0 version) software. Multiple sequence alignment was done using CLUSTALW (Multiple Sequence Alignment) that was obtained from http:// www.genome.jp/tools/clustalw/. The sequences of the fusants were submitted to Genbank.
Yeast strains used were grown on sabouraud dextrose agar and subjected to incubation for 3 days at the 30 ºC. Subsequently, loop full of the yeast cells were transferred into 10 mL of sabouraud dextrose broth and incubated for 24 h at 30 ºC. The yeast culture at concentration 2 ×10⁷ cell/mL was subsequently subjected to treatment with sonication using ultrasonic processor operating at the ultrasound frequency of 20 kHz with fixed time of 5 min, the disruption studies were carried out using horn tip sonicator [10,11]. A series of bovine serum albumin (BSA) concentrations (0.2 to 0.8 mg/mL) from the stock 1mg /mL (Table 4) were prepared. The absorbance of these solutions was determined at 595 nm and a standard curve was constructed between the BSA concentrations and the absorbance of BSA at 595 nm [12] All protein concentration used in SDS page were 300 μg/mL. Before loading protein sample into sample well, protein sample was prepared by mixing protein and 0.002% bromophenol blue (BPB) with ration 6:1 [13]. 30 μL of the samples were carefully loaded onto the wells of gel using a micropipette. The polypeptide profiles of the parent protein and fusant protein bands were seen with reference to the protein marker ranging from 10 to 245 kDa (GangNam-STAIN™ Prestained) (Table 5).
For genomic DNA extraction of S. cerevisiae, P. stipitis ATCC 58785 and the best ethanol tolerant fusants F4, F12, F18, F22, F24, the cells used were standardized based on OD Abs at 600 nm 1.0. All extracted genomic DNA were confirmed on gel electrophoresis (Figure 1). The DNA concentrations of S. cerevisiae, P. stipitis ATCC 58785 and fusants strains were estimated as presented in Table 6. The DNA concentration of S. cerevisiae was 389.54 ± 14.76 ng ̸ μL, P. stipitis was 417.18 ± 19.21 ng ̸ μL, whereas that of F24 was 563.38 ±19.06 ng ̸ μL. These results of enlarged DNA content of the fusants compared to the parent are a verification of fusant formation and hence, there had been the occurrence of multiple fusions. Also, fusants F12, F18 and F22 showed enlarged DNA concentration compared to the parent, DNA concentration were 519.21±13.03 ng ̸ μL, 532.54±12.65 ng ̸ μL and 512.23±12.32 ng ̸ μL respectively. The inclusion of the whole chromosomes of parent strains did not happen through protoplast fusion and DNA concentration obtained for recently generated fusant was generally lower compared to the values expected by the theoretical addition of DNA concentration from the respective parental strains.
Figure 1: Gel electrophoresis of genomic DNA extraction from S. cerevisiae, P. stipitis ATCC 58785, and fusants strain. Lane 1; S. cerevisiae, Lane 2: F4, Lane 3: F12, Lane 4: F18, Lane 5: F22 Lane 6: F24 and Lane 7: P. stipitis ATCC 58785 electrophoresis on 1.5% agarose with 1X TBE buffer at 70 voltage for 1.5 h and visualized under U.V light.
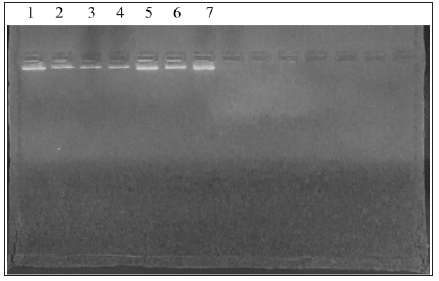
Table 6: Total DNA content of the S. cerevisiae, P. stipitis ATCC 58785 and the selected fusants with other references.
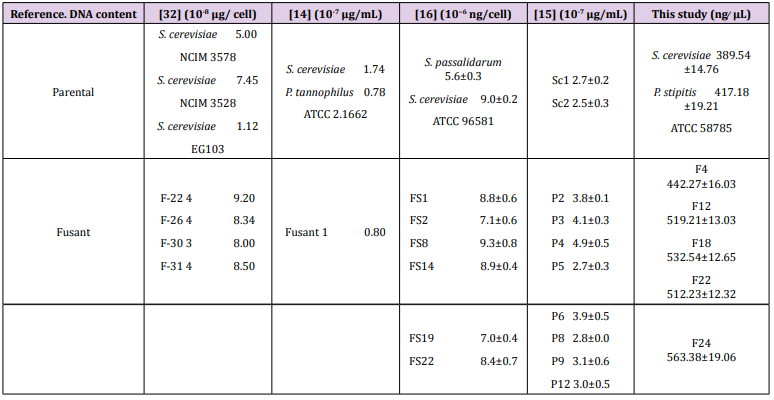
These findings are consistent with the findings reported by [14], who similarly reported that DNA content values determined in fusant F1 was 0.8×10⁻⁷ μg/mL which was compared to the value expected by the addition of the parental values S. cerevisiae 1.74 ×10⁻⁷ μg/mL and P. tannophilus ATCC 2.1662 as 0.78 ×10⁻⁷ μg/mL DNA content. In another earlier study, [15] reported that DNA content values detected in fusants whose parent had 2.7 to 4.9×10⁻⁷ μg/mL DNA content were significantly lower compared to the value expected by the addition of the parental values 5.2×10- 7 μg/mL, just as similarly observed in this study. However, some fusants were found to have DNA content values that were not considerably different from those exhibited by the parental strains, indicating a significant loss of genetic materials. In a related study, the results of six putative hybrid strains and the parental strains of S. passalidarum M7 and S. cerevisiae ATCC 96581 showed that all putative hybrids contained different quantities of DNA, but all values were higher than that in the parental strain S. passalidarum M7 as similarly reported in this study [16].
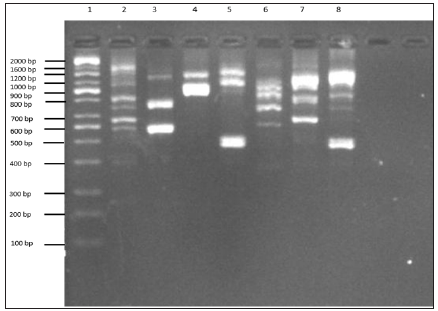
RAPD profile has been frequently used to identify variations in DNA level among yeast strains [17,18]. In this study, molecular characterization of the parental stock of S. cerevisiae and P. stipitis ATCC 58785 and fusants F4, F12, F18, F22 and F24 using RAPD profiling was carried out to know the genetic similarities of the fusant with parental strains as depicted in Figure 2. The profile of fusants represented in L3 to L7, showed diverse pattern of bands compared with parental strains. These strains were observed to share some of the polymorphic bands with S. Cerevisiae and some with P. Stipitis ATCC 58785, even though P. Stipitis ATCC 58785 has closer similarity compared to S. Cerevisiae. F4 was observed to possess band 1200 bp and ≈ 600 bp originated from S. Cerevisiae and band ≈ 800 bp originated from P. Stipitis ATCC 58785, near while F12 observed to possess band 1200 bp originated from S. Cerevisiae and band ≈1000 bp originated from P. Stipitis ATCC 58785. However F18 observed to possess band 1600 bp originated from S. Cerevisiae, band ≈1200 bp and band ≈ 500 bp originated from P. Stipitis ATCC 58785, F22 observed to possess band 1000 bp, band 900 bp and band 700 bp originated from S. Cerevisiae, band ≈1000 bp and band ≈ 800 bp originated from P. Stipitis ATCC 58785, F24 observed to possess band 1000 bp, band 900 bp and band 700 bp originated from S. Cerevisiae, band ≈1200 bp and band ≈700 bp originated from P. Stipitis ATCC 58785. These findings corroborate with the report of Guillamon and Barrio (2017), who observed and reported RAPD produced pattern of amplified products of different molecular weights that are characteristic of either the species or the different strains or isolates within the same species. The RAPD has also been reported to have the advantages of simplicity, efficiency, relative ease of execution, and no requirement of any previous sequence information [8,19-21]. Thus, the RAPD profile justifies the fusant nature of the fusants strain.
Figure 2: RAPD profile of parental S. cerevisiae, P. stipitis ATCC 58785 and fusants. Lane 1:100 bp DNA ladder, Lane 2: S. cerevisiae, Lane 3: F4, Lane 4: F12, Lane 5: F18, Lane 6: F22, Lane 7: F24 and Lane 8: P. stipitis ATCC 58785. The product was electrophoresis on 1.5% agarose with 1X TBE buffer at 70 voltage for 1.5 h and visualized under U.V light.
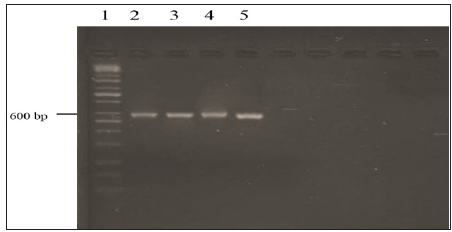
The DNA sequencing, which includes two non-coding regions designated as the internal transcribed spacers (ITS1 and ITS2) and the 5.8S gene was performed for further confirmation of the fusant nature of fusants F12, F18, F22 and F24. Fusant F4 was eliminated due to low performance in bioethanol yield. The ITS1 primer and a primer ITS4 were used to amplify the ITS1 and ITS2 and 5.8S gene. PCR product the band size 600 bp was electrophoresis on agarose gel (Figure 3). The nuclear internal transcribed spacer (ITS) regions have been employed as molecular markers because of their relative variability and ease of PCR amplification [22]. The ITS array consists of the entire ITS1, 5.8S and ITS2 regions of the nuclear rDNA cistron. It is a multigene family with the potential for variation among tandem repeats. Polymorphisms are not uniformly distributed across the ITS array. The 5.8S gene sequence is highly conserved but the ITS1 and ITS2 sequences are more variable and are highly polymorphic depending on the fungal species [7,23].
Figure 3:PCR product the band size 600 bp of ITS gene for fusant strains. Lane 1:100 bp DNA ladder, Lane 2: F12, Lane 3: F18, Lane 4: F22 and Lane 5: F 24. The product was electrophoresis on 1.5% agarose with 1X TBE buffer at 70 voltage for 1.5 h and visualized under U.V light.
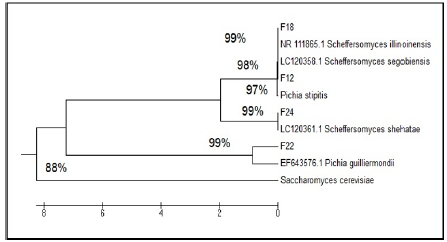
It being widely used for phylogenetic inference and in systematics, the ITS region is the formal fungal barcode and is the primary choice for molecular identification of fungi from a number of sources [24]. ITS-PCR profile of two parent strains, fusants and relative strains compare with National Centre Biotechnology Information (NCBI). According to genetic similarity and intraspecies differentiation, two parent strains and fusants were grouped into two different clusters. S. Cerevisiae which correspond to 88% sequence similarity whereas approximately 97% similarity was observed with P. Stipitis ATCC 58785 (Figure 4). The parent strain P. stipitis ATCC 58785 and fusants (F12, F18, F22 and F24) were grouped in the first cluster and the other parent S. Cerevisiae were grouped in the second cluster. Fusant F12 was found to be closely related to Scheffersomyces segobiensis LC12358, Fusant F18 was found to be closely related to Scheffersomyces illinoinensis NR111865, Fusant F22 was found to be closely related to Meyerozyma guilliermondii (Pichia guilliermondii) EF643576 and Fusant F24 was found to be closely related to Scheffersomyces shehatae LC120361.
Figure 4: ITS-PCR profile of parental S. cerevisiae, P. stipitis ATCC 58785, fusants and relative strains compare with NCBI.
The results are in accordance with the findings of [25], as reported that the fusant usually resembles any one of the parent in its properties and supported the fact that the fusants consist of the entire genome of the parent with which they possessed most of the characteristics, together with a chromosome from the other parent. The sequence of the ITS1, ITS2 and the 5.8S gene of each fusants was submitted to Genbank with the NCBI ACESSION NO (Table 7). In general, the obtained new combination of DNA fragment patterns and the presence of new DNA fragment or the absence of existing parental DNA fragments in the fusant strains compared to their parents could be considered as indicator of nuclear fusion of the two parental nuclei in the fused protoplasts. The sequencing of a region of the rDNA gene unit, which includes two non-coding regions designated as the internal transcribed spacers (ITS1 and ITS2) and the 5.8S gene of fusants F12, F18, F22 and F24 as shown in (Appendix 1-4) receptively. Molecular study using sodium dodecylsulphate polyacrylamide gel electrophoresis (SDS-PAGE) was employed to identify the genetic inter-relationship between fusants and their parents [26-28].
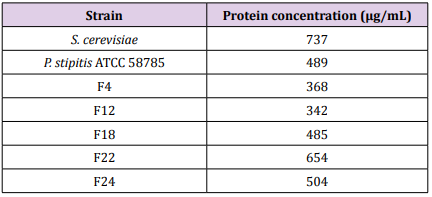
The protein contents of fusant F24 was found 504 μg/mL. The protein contents of fusant F22 was found to have increased to 654 μg/mL while those of fusant F4 and F12 were found to below which reached 368 μg/mL and 342 μg/mL respectively. The protein contents of fusant F18 was found to be comparable to the parental strain for P. stipitis ATCC 58785 as 485 μg/mL (Table 8), These results were in agreement with Hassan, 2014 who tested 17 fusants obtained from protoplast fusion between T. harzianum and T. viride and found that the protein content of fusant 16 (322.3 μg/mL) was significantly higher compared to those of fusant 3 and fusant 8 (184.3 μg/mL and 191.7 μg/mL) which were significantly low. The protein contents of fusant F22 and F24 (654 μg/mL and 504 μg/mL) were higher compared to the parental strain for P. Stipitis ATCC 58785 as 489 μg/mL. As similarly observed in this study, the protein contents of fusant 16 in the said study (Hassan, 2014) was significantly higher compared to those of the parental strains (223.7 μg/mL and 229.3 μg/mL) for Trichoderma parental isolates. These results are indications that partial or incomplete genetic recombination might be taken place during protoplast fusion. [27] observed higher protein content in fusant compared to the parental strain in intrageneric protoplast fusion between Aspergillus oryzae and Trichoderma harzianum, protein content of the fusant was 60 μg/mL while those of the parental strain were 27 μg/mL and 15 μg/mL for A. oryzae and T. harzianum respectively. [29] carried out protoplast fusion between T. harzianum and T. viride and found that fusant HF9 exhibited 1.5fold increases in total protein content compared to the protein content of parental strains.
Table 8: Comparison of above ground and below ground mean carbon stock potential over time using paired t-test.
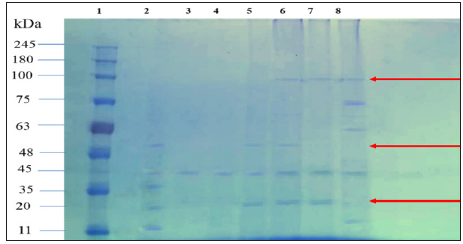
SDS-PAGE was utilized to analyse the polypeptide profile of S. Cerevisiae, P. Stipitis ATCC 58785 and the fusants culture proteins. The polypeptide profile was seen with reference to a protein ladder (GangNam-STAIN™ Prestained), with 12 bands between 10 to 245 kDa. SDS-AGE protein analysis of the five selected fusants and their parental strains confirmed that all fusant strains acquired and expressed many specific protein bands from the parental strains as similarly reported in an earlier study [26]. Protein bands with high molecular masses of 100 kDa, which existed in S. Cerevisiae parental strain and not in P. Stipitis ATCC 58785 parental strain was expressed in the fusants F22 and F24. Two other protein bands with molecular masses of 48 and 20 kDa, which existed in P. Stipitis ATCC 58785 parental strain and not in S. cerevisiae parental strain, were also expressed in fusants, protein bands with molecular masses of 48 kDa existed in fusant F18 and F22 while protein bands of 20 kDa existed in F18, F22 and F24. The similar bands from parents that were expressed in the fusants are indications of protoplast fusion between two yeasts S. Cerevisiae and P. Stipitis ATCC 58785 (Figure 5). These findings of acquisition of different proteins by the fusant from the parental strains as observed in this study agree with those reported by [26], who found that 17 selected fusants obtained in their study and their parental strains confirmed that all fusant strains acquired and expressed many specific protein bands from the parental strains [26]. [30] used SDS-PAGE analysis for screening of the fused cultures from protoplast fusion of the polypeptide profile yeast cultures S. Cerevisiae and K. Marxianus for enhancing bioethanol production from cheese industry waste [31-34].
Figure 5: one side of the fenced permanent plot (photo by Giday, 2013 left and Gebremichael Yiebyo on 19/11/2016 right).
