info@biomedres.us
+1 (502) 904-2126
One Westbrook Corporate Center, Suite 300, Westchester, IL 60154, USA
Site Map
Received: December 06, 2018; Published: December 13, 2018
*Corresponding author: Nita Viwattanatipa, Orthodontics Department, Faculty of Dentistry, Mahidol University, Thailand
DOI: 10.26717/BJSTR.2018.12.002201
Background: Two dimensional (2D) cephalometry showed projection errors of mandibular curved structures which led to inaccuracies in landmark measurements.
Objective: To create geometric formulas for ramal height and mandibular corpus length and test the validity of these hypothetical geometric formulas in comparison to the actual skull measurements to solve the problems of projection errors.
Material and Methods: Twenty-two skulls were included in the study. Two-dimensional(2D) cephalometric films which include Lateral (1), Postero-anterior (2) and Submento vertex (3) were taken for each skull. The actual measurements of ramal height (Co-Go), mandibular corpus lengths (Go-Me) and total mandibular lengths were obtained directly from the skull. 2D measurements were obtained from 3 views of 2D cephalometric films. Based on 3-dimensional co-ordinate axis (X, Y, Z), geometric formulas were constructed using variables from multiple 2D films to calculate ramal height (R) and mandibular corpus length (M). Validity of these formulas were tested with matched pair T-test statistics by comparing with the direct skull measurements.
Results: All 2D cephalometric mandibular measurements were significantly shorter than direct skull measurements. The average ramal height and mandibular corpus lengths measured from Lateral cephalometry was 1.27mm. (SD 0.97) and 17.64mm. (SD 2.12) shorter than actual skull measurements. Geometric formulas significantly reduced mean difference between values from 2D cephalometrics and skull measurements. Most valid formulas for ramal height and mandibular corpus length were √YR12+ ZR32+ XR22 and √M12+XM22 respectively.
Conclusion: 2D cephalometric measurements were found to be imprecise. Geometric formulas could be a tool to overcome the problems of projection errors.
Keywords: Cephalometry; Geometric Formulas; Mandibular Corpus Length; Projection Error; Ramal Height
Abbreviations: Co: Condylion; Go: Gonion; Me: Menton; Gn: Gnathion; ANS: Anterior Nasal Spine; MBC: Mandibular Body Curvature; L: Lateral Cephalogram; PA: Postero-anterior cephalogram; SMV: Submento-vertex cephalogram; 2D: Two-dimensional; 3D: Three-dimensional; CBCT: Cone Beam Computed Tomography; CT: Computed Tomography; RH: Ramal Height; MCL: Mandibular Corpus Length; Ave: Average
Cephalometry is one of the indispensable diagnostic tools in orthodontics for diagnosis of dentofacial problems, growth evaluation, treatment planning and outcome evaluation [1,2]. However, the most highlighted drawback still remains the representation of three-dimensional (3D) structures in twodimensional (2D) axis, leading to projection distortion, positional distortion, image magnification, landmark identification error, superimposition of structures which has partly frustrated clinicians particularly in the aspect of treatment evaluation [2- 4]. To overcome the drawbacks of 2D projection, Adams invented a correction formula for image enlargement and distortion [5]. Similarly, a compensator for lateral films was developed by Wylie and Elsasser which was later modified by Vogel to include PosteroAnterior (PA) cephalograms [6,7]. Savara also introduced a method to measure landmarks in three-dimension using lateral and PA cephalograms [8]. Additionally, in an attempt to combine the use of lateral and PA films together, Broadbent and Bolton introduced “Broadbent Orientator” which was an acetate overlay of lateral and PA film registered at Frankfort horizontal plane [1]. Additionally, Buamrind, et al.[9]. attempted to combine the use of two coplanar films based on the principle of photo-stereometry.
Despite all of these attempts to overcome projection errors, the complexities and cumbersomeness of techniques made it difficult for routine clinical use [4,9]. With passage of time, various computer software algorithms were also invented to analyze the 3D coordinates directly from cephalometric images as described by Grayson et al. [10]. Brown and Abbott [11] proposed the “vector intercept with manual adjustment algorithm” to calculate 3D cephalometric measurements. Kusnoto et al. [12] compared several computerized algorithm and combinations of cephalogram projections with computed tomography (CT). Invention of medical CT has helped clinicians to study any body parts in 3D efficiently, but huge cost, high radiation exposure, and artifacts from metal orthodontic brackets has restricted its use [13]. With recent introduction of CBCT, it is now possible to obtain all the traditional orthodontic images in single exposition, and the exposure to radiation reduced to around 10 folds when compared to medical CT [14]. However, not all can afford it and is also not recommended for routine screening of patient due to ethical issues. Moreover, standard norms of dento-facial measurements of 3D CBCT have not yet been established.
Cephalometry is a three-dimensional entity [10]. However, clinicians mostly relied on just lateral films and not adhering to Broadbent’s initial concept [15-17]. In recent times though, the use of PA films has increased to further the understanding on transverse discrepancies in cases with facial asymmetries [10,18]. Simultaneously, many ways have been proposed to use multiple radiographs in combination to obtain 3-dimensional assessment of the patients [12,19,20]. Gribel et al. [21] presented a mathematical algorithm developed based on a principle of trigonometry which can successfully convert 2D to 3D measurements. However, even today, the use of only lateral or PA films to evaluate treatment changes have not declined and it seems unreasonable to send every patient for CBCT.
The rationale behind our study were as follows. Although error and limitations of the 2D cephalometry were recognized, it has been used in orthodontics for more than 70 years. Many orthodontic programs still keep the large archives of radiographic patient records for their clinical research. In addition, skeletal and dental cephalometric norms which are used in orthodontic treatment nowadays derived from the 2D cephalometry. Therefore, it would be beneficial if there is any method to increase the validity of measurement from 2D radiography so that the 2D archives films can be used efficiently for retrospective clinical studies rather than wasting the valuable archive collection. Secondly, there was no study in the past that clarified how much was the difference between mandibular cephalometric measurements and the actual length of mandibular curvature. Thirdly, many research publication showed that the effectiveness of functional appliance to enhance mandibular growth was highly controversial [22-26]. Yet one common observation is that all of these studies related to functional appliance were performed with just lateral films which reported conflicting results and hence undermined the real effectiveness of functional appliance [27,28]. The validity of these results remains questionable since 2D cephalometric measurements would give smaller values than actual skull dimension. Therefore, it is expected that the results of our study will help researchers and clinicians to measure ramal height and mandibular body more accurately. Consequently, evaluation of the true effectiveness of functional appliance on mandible can be achieved in the future.
Whether geometric formulas could be used to reduce the difference between cephalometric and direct skull measurement was our research question. This study intended to firstly compare the ramal height and mandibular corpus length obtained directly from skull with measurements obtained from multiple 2D cephalometric films (lateral, PA, submento-vertex). Secondly, the 3D geometric formulas to calculate ramal height and mandibular corpus length were developed and tested for their validity in comparison with direct skull measurements.
The study material comprised 22 dry dentate human skulls with mandibles. The samples were selected from a larger group based on inclusion criteria of having intact skull without any bony pathologic lesions, presence of permanent upper and lower incisors, presence of molars on both sides to maintain the vertical dimension, and having stable and reproducible occlusion.
Firstly, anatomical landmarks were examined and located on the mandible. The direct skull measurements of all samples were obtained manually using dental floss running along anatomical contour of mandible. The length of the dental floss was then confirmed by digital caliper (Absolute Digimatic Caliper, Mitutoyo, Japan). The measurements were as follows:
Ramal Height: Left and right ramal heights were measured from Condylion (Co) to Gonion (Go) on respective sides (Figure 1).
Mandibular Corpus Length: Left and right curvature of mandibular corpus lengths were measured from Gonion (Go) to the Menton (Me) as shown in Figure 1.
Figure 1: Direct skull measurement from mandible
a) Ramal height (R): Measured from Condylion (Co) to Gonion (Go).
b) Mandibular corpus length (MCL): Measured from Gonion (Go), to Menton (Me).

Total Mandibular Length: The Left and right actual total mandibular length was the sum of ramal height plus mandibular corpus length. All the measurements were repeated twice and averaged for final comparison.
Tiny metallic balls were attached to all the identified landmarks: Condylion (Co), Gonion (Go) and Menton (Me)) using orthodontic wax. Subsequently, mandible was fixed with their respective skull according to the actual fossa to condyle relationship, with the dentition in maximum intercuspation. This position of the mandible was stabilized on several sites bilaterally and reinforced with a broad tape from the temporal bone of the skull to the mandible on both the sides. Each sample skull was then oriented in a cephalostat (Orthoceph® OC100 GE Healthcare, Finland) and stabilized with the help of bilateral ear rods in external auditory meatus. Frankfort horizontal plane was parallel to the floor for lateral and P-A cephalograms, while it was perpendicular to the floor for submento-vertex technique. Water level device was also used to check the skull position. Three 2D films in perpendicular directions to each other were taken for each skull, which include
a) Lateral (L),
b) Postero-anterior (PA) and
c) Submento-vertex cephalogram (SMV) (Figure 2).
Figure 2: Three different views of cephalometric films with attached metal balls.
a) Lateral cephalogram.
b) Postero-anterior cephalogram (PA).
c) Submento vertex cephalogram (SMV).

Following radiation settings were followed throughout the process. The distance from mid-sagittal plane of skull to film was 9cm for lateral cephalograms, 15cm for PA cephalogram and 15cm for submento-vertex cephalogram respectively. The distance between the mid-sagittal plane of skull to radiation source was 5 feet. Radiation setting was adjusted at 69kVp, 15mA and exposure time of 0.64 seconds.
Following the tracing of the films, the XYZ coordinate axis system in this study was defined for each cephalogram as follows.
Lateral Cephalogram: ZY coordinate axis system with Frankfort horizontal plane as reference plane (Figure 3a).
Postero-Anterior (PA) Cephalogram: XY coordinate axis system with horizontal reference plane as a line connecting the medial aspects of the zygomatico-frontal sutures (Z) (Figure 3b).
Submento-vertex cephalogram: ZY coordinate axis system with sagittal reference plane as a line along vomer best fit (Figure 3c).
Figure 3: Geometry construction for three-dimensional coordinate axes (X, Y, Z) for formula derivation.
a) Lateral cephalogram. b) Postero-Anterior cephalogram (PA). c) Submento-Vertex cephalogram (SMV).

Ramal height and mandibular body length were measured from all the three films of respective skull using digital caliper with the help of radiopaque metallic balls. The right and the left measurements were obtained separately. Measurements were also repeated twice and averaged for final comparison with the corresponding direct skull measurements of the same skull. Altogether, 40 variables (12 from lateral, 14 from PA and 14 from submento-vertex) were measured for ramal height and mandibular body length from set of three films for each skull. The operational definitions of the variables are mentioned in Tables 1-3 for lateral, PA and submento-vertex respectively. The radiographic measurements mainly comprised of:
a) Anatomical landmarks distance and
b) Projected distance both along and perpendicular to the XYZ coordinate system.
Comparison was done for all the 2D variables to the corresponding direct skull measurement for both ramal height and mandibular corpus length categories.
Table 1: Definitions of variables measured from lateral cephalogram.

Table 2: Definitions of variables measured from Postero-Anterior (PA) cephalogram.

Table 3: Definitions of variables measured from Submento-vertex cephalogram.

The differences were calculated by substracting the 2D measurements from the direct skull measurements. As depicted in Figure 3, the coding for each measurement starts with the coordinate axis, either X, Y or Z followed by R (ramal height) or M (mandibular body length). The numeric codes indicate 1(lateral), 2(PA) and 3(submento-vertex) cephalogram, whereas last alphabet R or L designate right or left side respectively. For example, YR1L means ramal height which was projected on Y axis, obtained from lateral cephalogram on the left side.
The mathematical formula used in our study was developed based on algebraic Pythagorean theorem of right angle triangle [29]. The basic theorem equation for the two-dimensional rightangle triangle can be written as:
where “c” represent the hypotenuse and “a” and “b” are other two sides of the right-angle triangle respectively. For a threedimensional geometric figure illustrated in Figure 4a, to calculate the length of the side “s”, the value of “c” has to be calculated first. From the same figure, using Pythagorean theorem for 2-dimensional figures,
Figure 4:
a) 3-Dimensional geometric figure.
b) Three-dimensional coordinate axes (X, Y, Z) for formula derivation.

Subsequently, using geometry construction applied to the measurements in three-dimensional coordinate axis (X, Y, Z) of the 2D cephalometric films as illustrated in Figure 3a-3c, different possible geometric formulas were derived. Basically, measurement variables across 2 to 3 cephalometric films were arbitrarily constructed. Hypothetically, 4 geometric formulas to calculate ramal height and 6 formulas to determine mandibular corpus length were derived as shown in Table 4. The formulas derived were then investigated for their validity by comparing with the direct skull measurements which represent the true measurement.
Table 4: Definitions of variables measured from Submento-vertex cephalogram.

The data analysis was performed with the SPSS (version 20.0, IBM Corp, Released 2011, Armonk, NY).
Normality Test and Scatter Plots: The data normality and distribution was tested with Shapiro-Wilk test which indicated normal distribution. Scatter plots were generated for 4 formulas of ramal height and 6 formulas of mandibular corpus length.
Comparison Between Actual Skull VS. 2D Cephalometric Measurements: Descriptive mean and standard deviation at 95% confidence interval (CI) of differences between actual skull versus each cephalometric measurement (the average of right and left side) of ramal height (Table 5) and mandibular corpus length (Table 6) was calculated. Moreover, radiographic mandibular length; Ave CO-Me1, Ave CO-Me2 and Ave CO-Me3 were compared with the actual total mandibular size (the sum of ramal height plus mandibular corpus length) (Table 6). Paired sample t- test at 95% confidence interval and p value at <0.05 was used to contrast mean values between actual skull measurements and cephalometric measurements.
Comparison Between Actual Skull VS. Geometric Formulas: Descriptive mean of differences and standard deviation between actual skull versus geometric formulas of ramal height (Table 7) and mandibular corpus length (Table 8) was calculated. Minus sign in some mean of differences indicate that the values obtained from geometric formulas was greater than the actual skull values. Paired sample t- test at 95% confidence interval and p value at >0.05 was used to contrast mean between actual skull measurements and geometric formulas measurements.
Error Measurements: Error analysis of cephalometric measurements was performed for 8 ramal height and 12 mandibular corpus length variables by re-measuring cephalograms of 8 sample skulls with Dahlberg’s formula (D).
Table 5 summarizes the mean of differences between the actual skull and 2D cephalometric measurements of ramal height (Co-Go) classified by type of cephalograms. All parameters revealed a statistically significant difference between actual skull measurements and 2D values obtained from 3 cephalometric films. In general, the values of projected (X, Y, Z) measurements showed greater mean of differences than direct measurements. The 4 measurements with least mean differences (values less than 1.5mm) in an ascending order were:
1) Ave R2 from PA cephalogram (1.22mm),
2) Ave. R1 from lateral cephalogram (1.27mm),
3) Ave. YR2 from PA cephalogram (1.30mm) and
4) Ave. YR1 from Lateral cephalogram (1.48mm). These values represent the closest value to the actual skull measurements.
Table 5: Paired T-test comparison of direct skull versus 2D cephalometric measurements of ramal height (R) in mm.

Table 6 summarizes the mean of differences between the actual skull and 2D cephalometric measurements of mandibular corpus length and total mandibular length. All parameters also showed a statistically significant difference between actual skull measurements and 2D values from 3 cephalometric films.
Table 6: Paired T-test comparison of direct skull versus 2D cephalometric measurements of mandibular corpus length (M) and total mandibular length in mm.

The lowest mean difference was recorded for submento-vertex film while all other variables had a vast difference with the actual skull measurements. The measurement with least mean difference was Ave. M3 from SV Cephalogram (8.86mm). Regarding total mandibular length, the least mean differences was recorded by Ave CO-Me1 from lateral cephalogram (44.01mm) followed by Ave COMe2 from PA cephalogram (49.57mm) and Ave. Co-Me3 from SV cephalogram (79.92mm) respectively
Table 7 shows the mean of differences and Paired T-test comparison of measurements between 4 geometric formulas and actual ramal height. Three geometric formulas (R1, R2, R3) were successful in reducing the mean of differences to significant level, while R4 still shows between-group significance at p-value 0.03. R3 shows least mean of differences (0.41mm), followed by R1 (0.46mm) and R2 (0.65mm) respectively. Table 8 shows the mean of differences and paired T-test comparison of measurements between 6 geometric formulas and actual mandibular corpus length. All parameters demonstrated between-group significance except M4 which shows least mean of differences at 0.46mm.
Table 7: Paired T-test comparison of measurements between direct skull versus 4 geometric formulas of ramal height (R).

Table 8: Paired T-test comparison of measurements between direct skull versus 6 geometric formulas of mandibular corpus length (M).

All scatter plots of 4 formulas of ramal height indicated excellent correlation of data with the best fit lines (r ranges from 0.91 – 0.95). Geometric formula 3 (R3) show the greatest r value of 0.953. All 6 scatter plots for mandibular corpus length indicated good to excellent correlation of data with the best fit lines (r ranges from 0.78 – 0.953). Geometric formula 5 (M5) showed the least r of 0.78 while Geometric formula 4 (M4) showed the greatest r value of 0.953.
Table 9 shows the results of Dahlberg’s error analysis calculated by repeating cephalometric measurements from 8 sample skulls. The errors for ramal height ranged from 0.31 (Ave.XR2) to 1.37 (Ave.YR1) whereas values of mandibular corpus length ranged from 0.56 (Ave. XM2) to 1.37 (Ave.YM1, Ave.M3).
Table 9: Error measurements.

Using the value of M4 from Table 8, sample size of 22, Type I error rate, α = 5%, True mean, μ = 0.46mm., Null Hypothesis mean, μ0 = 1.5mm., standard deviation, σ = 1.0, the calculated power obtained for this study was 0.998 or 99.8% [30].
A new innovative approach of geometric formulas has been proposed which can accurately calculate ramal height and mandibular body length. We found significant disparity between skull measurement and 2D cephalometric measurements as reported in previous studies. The findings of this study supported the application of geometric formulas to calculate ramal height and mandibular body length more accurately whenever they are in question. For ramal height, the valid formulas were R1, R2, R3 as shown in Table 7, whereas for mandibular corpus length, the only valid formula was M4 as shown in Table 8. Accordingly, the validity of total mandibular length could be obtained from the combination of the valid values of ramal height and mandibular corpus length.
Orthodontists commonly used lateral films and seldom PA films to ascertain ramal height from Condylion to Gonion (Table 5). The findings in this study show that same measurement, AveR1 which represent the 2D Co-Go was slightly shorter than direct skull measures with a small mean difference of 1.27mm (95% CI: 0.83mm – 1.70mm) and 1.22mm (95% CI: 0.73mm – 1.71mm) for lateral and PA cephalograms respectively. This minute disparity was mainly assumed to be due to the divergence vector in rightleft (X axis) and antero-posterior direction (Z axis). Considering the fact that orthodontist mostly rely on lateral and PA cephalogram, this minor discrepancy could be slightly improved by using formula R2 in Table 8, which reduced the disparity to 0.65mm (95% CI: 0.03mm – 1.27mm). However, this minimal amount of reduction of around 0.6 mm may be considered clinically insignificant. Even though, R3 and R1 showed better results than R2, the fact that these 2 formulas resorted on using variables from submento-vertex film, may limit its practical use by the orthodontists.
Mean of difference of mandibular corpus length in Table 8 show that there exists a large disparity between direct skull and 2D cephalometric measurements. For mandibular corpus length, the 2D cephalometric measurements that orthodontist mostly follow was Go-Me from lateral cephalogram. We found that AveM1 which represent 2D measurement of Go-Me was markedly shorter than actual skull measures with the mean of 17.64mm (95% CI: 16.70mm – 18.58mm). This large disparity may be due to the failure of 2D radiographs to represent curvature of mandibular corpus, wideness in right-left (X axis), and the steepness of mandibular plane in vertical direction (Y axis). It is felt that these factors contributed for a large difference in the mean between the 2D cephalometric measurements and direct skull measurements.
A few methods have been proposed in the past to solve the problem of mandibular corpus length distortion. Lee et al. [31] stressed the importance of mandibular body curvature which is often overlooked with a mere straight line from gonion to menton in 2D radiographs which in reality is a curve. He proposed a new landmark MBC (Mandibular body curve) located at the most convex point of the curve between gonion and menton. Bayome et al. [32] and Devana [33] in a similar study proposed an approach to calculate the length of mandibular body by measuring length of the curve passing through Go, MBC and Me which could be an accurate representation of the mandibular corpus. Even though the submento-vertex cephalograms showed the nearest mandibular corpus length to actual skull measure, as seen from the lowest mean of difference of Ave M3 (8.86), it’s use is nearly impractical in orthodontic practice. Moreover, the addition of variables from submento-vertex film into geometric formula did not help to reduce the mean difference to a significant level. Interestingly, it was observed that the amount of discrepancy could be strikingly reduced by employing both the mandibular corpus lengths measured from lateral and PA cephalograms as shown in formula M4. Table 8 demonstrate that formula M4 recorded mandibular corpus length with the mean difference of 0.46mm (95% CI: -0.01mm – 0.94mm) when compared to direct skull measurement. In another word, formula M4 helped reducing the disparity as much as 17mm, which is speculated to be due to the fact that we combined Y, Z dimensions from lateral cephalogram, and X dimension from the PA cephalogram.
Co - Me still is a popular parameter used by orthodontist to represent total mandibular length. When we compared the Ave CoMe from 2D cephalometric films with the actual total mandibular size (the sum of ramal height plus mandibular corpus length of actual skull), we noticed a huge difference between the two values. Ave Co-Me1 from lateral cephalogram was on average 44.01mm shorter than actual skull measurements. This disparity became even worst in Ave Co-Me2 from P-A cephalogram. Due to this observation, we proposed that cephalometric Co-Me measurement was not appropriate to represent the total mandibular length as orthodontists assumed in the past. Hence, using cephalometric CoMe would underestimate the total mandibular size to a great extent which may lead to misinterpretation of the treatment results.
The available literature supported the existence of significant difference between the direct skull measurements and 2D cephalometric measurements [34-37]. Whether cephalometric or direct skull measurements is greater may depend on the type of films with inherent magnification, projection error and skull anatomy characteristics. The finding of the current study concurs with the study of Farkas LG et al. [34] where they reported that both singular and paired measurements from PA cephalograms were significantly shorter than direct skull measurements. This mismatch between direct skull and cephalometric measurements was attributed to the nature of two-dimensional films exhibiting distorted image of three-dimensional objects.
Durão et al. [38] in 2014 observed that seven of the total ten linear measurements evaluated were greater on 2D radiographs while compared to gold standard skull measurement. However, three measurements involving Co-Gn, Co-ANS, Go-Gn were larger when measured directly on skull. Go-Gn and Co-Gn which corresponds to Go-Me and Ave CoMe in our study, was observed to be greater when measured directly on skull. Our finding was generally in agreement with their observation. We found that 2D measurements of ramal height, mandibular corpus length and total mandibular length was shorter than actual skull (Tables 5 & 6). It was however, interesting to observe that the mean difference of GoMe in our study was much larger (17.64mm) while Durão et al. [38] reported the difference of only 0.45mm. This was probably due to different methodologies employed in the two studies. In our study, Go-Me was measured following the curvature of mandibular body, whereas they used a mere linear distance between Go to Me. It can therefore be stated that radiographic linear measurements can significantly underestimate the actual measurement of the skull. Therefore, clinicians must be extra cautious while reporting the results. Additionally, our findings also substantiate the statement put forward by Moyers and Bookstein [39] that cephalometric measurements are inefficient and fail to capture the measurements of the curved structures.
Gribel et al. [35], while comparing direct skull versus 2D cephalometric versus CBCT measurement of 25 skulls reported that 2D cepahometric measurements differed significantly from direct skull and CBCT measurements. However, there was no recognized pattern or consistency with some measures being larger on 2D radiographs and some otherwise. Similar result was reported by Adams et al. [40]. They reported that 2D cephalometric measurements from lateral and PA cephalograms varied significantly when compared to direct skull measurements. Interestingly, ramal height was found greater when measured on 2D cephalograms while mandibular corpus length was found greater on direct skull measurement. This inconsistent report may reflect an inherent disability of 2D cephalograms in representing 3D structures and the amount of information either lost or exaggerated in the due process.
In a separate study, Gribel et al. [21] described an algorithm based on the principles of trigonometry to correct 2D measurement to 3D values. They reported a significant disparity between lateral cephalometric and CBCT measurements which were the representatives of 2D and 3D measurements respectively. However, following the application of the algorithm to convert 2D to 3D values, it was observed that there was no significant difference between algorithm corrected and CBCT measurements.
In contrast to above studies, the strength of our study was to obtain true dimension of mandible by measuring the curvature of mandibular corpus, while most other studies merely measured linear distance between the anatomical landmarks. Furthermore, tiny metallic balls were employed on anatomic landmarks (Co, Go, Me) to control landmark identification error. We considered the projected measurements of lateral and posterior inclination of mandibular ramus which were unnoticed by lateral or posteroanterior films. In addition, considering that the bilateral structures are not perfectly symmetrical, the measurements on right and left side were obtained separately rather than using the average lines. As pointed out by Grayson et al. [10] that any three-dimensional reconstruction would be more accurate and length measurement would be more valid if the bilateral landmarks on the lateral film are not averaged. Finally, we successfully demonstrated a more pragmatic way to obtain an error free measurement of mandible simply by applying Pythagorean theorem with variables from multiple 2D cephalograms. The validity of some geometric formula was very high as supported by significant decrease in mean difference
In actual patient, measurement could be subjected to more error since metallic markers cannot be placed. Thus, it may be more difficult to control factors that contribute to error. Moreover, application of some formulas containing variables from submentovertex film may be impossible due to the ambiguity of landmarks like condylion and gonion without radio-opaque metal markers. Lateral cephalograms may present differential enlargement between the left and right side. Thus, it may be more difficult to control several factors that contribute to error in live patient.
Although, 3D CBCT have become increasingly popular, cephalometric radiographs are still widely used by practitioners around the world due to the virtues of being economical and less radiation exposure. Moreover, 2D cephalometrics have normative database and are more practical for quantitative or long-term serial analysis. The findings of this study confirmed that there exists a significant disparity between direct skull measurement and 2D cephalometric measurements. This suggested that clinicians must be cautious while interpreting dimension changes of mandible from 2D cephalograms. Our results found that geometric formulas can be applied to calculate ramal height and mandibular body length more accurately. This current approach may prove to be an effective alternative to evaluate the effects of functional appliance on ramus and mandibular body by comparing pretreatment and posttreatment measurements. Future studies may focus on comparing the geometric formulas with the 3D CBCT techniques and also apply the geometric formulas to evaluate the effects of orthopedic appliances on ramus and mandibular body.
a) All 2D cephalometric mandibular measurements were significantly shorter than direct skull measurements.
b) Average ramal height and mandibular corpus lengths measured from Lateral cephalometry was 1.27 mm. (SD 0.97) and 17.64 mm. (SD 2.12) shorter than from actual skull respectively
c) Geometric formulas significantly reduced mean difference between values from 2D cephalometrics and skull thereby the ramal height and mandibular corpus length were more accurate.
d) Valid formulas for ramal height were
i.  followed by
ii.  and
and
iii. 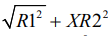 , whereas the only valid formula for
mandibular corpus length was
, whereas the only valid formula for
mandibular corpus length was 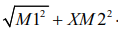 .
.
The authors would like to extend our heartfelt gratitude for a valuable assistance from Faculty of Medicine and Faculty of Dentistry, Khon Kaen University and Faculty of Graduate studies, Mahidol University, Bangkok Thailand for generous research grant.


