info@biomedres.us
+1 (502) 904-2126
One Westbrook Corporate Center, Suite 300, Westchester, IL 60154, USA
Site Map
Received: November 27, 2018; Published: December 11, 2018
*Corresponding author: Guo Ruo, College of Enviromental Science and Engineering, Tongjji University, China
DOI: 10.26717/BJSTR.2018.12.002183
Dryland forests of Ethiopia are facing a rapid rate of deforestation and degradation. This affects the growth and survival of plant density, diversity, growth and carbon stock. The aim of the study was to investigate the effect of fencing on regeneration, bonsai growth and carbon stock potential of Desa‟a forests. Data were collected on 24 plots of 20m×20m for trees and shrubs, 5m×5m for seedlings and on 40m×40m for bonsai growth on permanent plots established in 2009. Data were analyzed using paired t-test to estimate any change on regeneration and carbon stock within the fenced and unfenced block over time. However, an independent t-test was used to measure any significant difference on regeneration, carbon stock and bonsai growth between fenced and unfenced. Results showed that a total of 27 woody species were found representing 18 families. Olea europaea subspecies cuspidata and Juniperus procera were with the highest Importance Value Index. The overall diameter distribution showed an inverted J-shape indicating active regeneration status. Fencing has a significant effect on the regeneration of seedlings (P=0.007). Significant change in the regeneration of woody plants were found within the fenced plots overtime (P=0.001). Unfenced has a significant effect on basal area over time (P=0.036). Bonsai height and diameter growth was significantly affected by fencing (P< 0.001) showing mean height and diameter growth of 14.4cm and 1.34cm per year in the fenced plots respectively. Total tree carbon stock of the fenced and unfenced plots was increased from 15.88 to 19.43 and 12.05 to 12.95 Mg C ha-1 respectively over time. Fencing had a significant effect on tree carbon stock over time (P=0.005). In general, long term fencing was found to be an effective management option to enhance regeneration and carbon stock of the forest. Particularly, fencing is very important management options to improve the regeneration of Olea europaea and bonsai growth which is reported to have low regeneration record on an open environment. However, the regeneration potential of Juniperus procera is weak on both management options indicating the need of further study and conservation priority in the dry Afromontane forest environment.
Keywords: Regeneration; Bonsai Growth; Fencing; Carbon Stock; Permanent Plot
Dryland forests are among the most and widespread threatened ecosystems from expanding human populations and climate changes, and conversion mostly to agricultural lands [1,2]. Browsing with animals are one of the main challenges for today and tomorrow in forest management and as this it affects regeneration, abundance and forest species distribution Ambroz et al. [3]. Interference of different animals (i.e. disturbances and continuously over browsing) to the forest area affects the growth and survival of many herbs and tree species, as a result plant cover density and diversity is reduced Jean-Pierre [4]. Disturbance and browsing are main factors that lead to change the vegetation and diversity patterns through time in forests worldwide yet rarely are these processes examined both together simultaneously, even though interactions likely to be greater Whigham [5]. In the dryland forest of the world, various forces may influence vegetation dynamics such as regeneration, composition and structure Pickett et al. [6].
As Roberts et al. [7,8] studied, overstory disturbance (e.g., canopy gaps), understory fire, and animal browsing are generally recognized among the principal factors determining understory species composition over the past century. However, the entire region has experienced disruptions to historic disturbance and herbivory regimes including widespread clear cutting and conversion to second-growth forests, fire suppression, and increased ungulate browsing densities Guyette et al. [9]. Forest ungulates affect woody plant species in many ways, for instance by browsing and or antler rubbing removing shoots and leaves, stripping bark, fraying, trampling, defection and urination Danell et al. [10]. The regeneration development in forests with natural or near-natural structure is related to the occurrence of disturbances in the forest development. The success of natural regeneration, tree establishment, growth and mortality and thus both structure and species composition of forests depends on many some of them are trampling effect, browse by animals, attacked by pests and soon (Swiss Federal Institute for Forest) [11].
Figure 1: study area map of Desa”a (Source: Hishe et al., 2015a).

According to the study of EFAP [12]; Mengistu et al. [13,14] from the total area of the Ethiopia, 1.1million square kilometer 66% (75 million hectare) is dryland and from these 2.5million hectares of the land is covered by bush lands and wood lands. This Figure 1 indicates that majority vegetation resource of Ethiopia is found in the drylands. Thus, the development of the country is highly dependent upon the efficient and effective use of these areas (UNDP) [15]. In the dry Afromontane forests, soil moisture, light, temperature, nutrient and intensity of browsers significantly affect the seed and seedling quality of the forest composition. The highland area of Ethiopia was once covered with widespread forest resources considered 40% the total are of the country in 1900 EMA, [16,17]. However, these forests are being subjected to intensive anthropogenic pressure, through activities such as cutting, burning and browsing by livestock Birhane et al. [18,19].
Such process can result in deforestation, degradation, clearances, fragmentation of the forests and biodiversity loss Lemenih et al. [20]. In Ethiopia, the rate of deforestation is estimated to range from 150,000-200,000 ha EFAP [21] and recently studies indicate that the net annual loss of forest resources of the country is estimated 210,000 ha by deforestation and forest degradation MEF [22]. The most important reason behind the rapid deforestation and forest degradation rate in the country is the ever increasing human population growth and is associated with a very high demand for agricultural and grazing lands, firewood, charcoal, timber, and construction among others Yineger et al. [23]. Fire, inappropriate investment activities, and lack of viable land use policy have also been key factors for the rapid decline of forests in the country Friis [24,25]. Thus now a days, the forest area is shrinking and left a small remnant forests only found in spiritual churches, monasteries, and mosques and inaccessible hillsides Birhane et al. [26].
Desa‟a dry Afromontane forest is mostly dominated by the species of Olea europaea, subspecies cuspidata and Juniperus procera [24,27]. A study by Aynekulu [28] showed that native tree species natural regeneration potential of the forest is low (Figure 2). Exclosure was found to be an effective management option to improve the regeneration of Olea europaea sub species cuspidata but it does not improve the regeneration of Juniperus procera Giday [27]. Thus, a closed management system in the open-access and degraded forests may not guarantee a successful regeneration of native woody species Aynekulu [28]. There are lots of trees that their growth is restricted vertically as well as horizontally to the side due to the frequently browsing effect of many grazing animals both the wild and domestic animals Giday [27]. This is particular to Olea europaea subspecies cuspidata and which results in a persistent reduced and stunted growth called it Bonsai Giday [29].
Figure 2: Mean monthly maximum temperature and mean monthly minimum temperature (Ethiopia National Metrological Agency).

Protected forests and exclosures in Ethiopia play an important role in carbon storage on their carbon pools in addition to other ecosystem services Vreugdenhil et al. [30]. By absorbing carbon and storing it in trees, shrubs and soil, vegetation plays an important role in reducing the level of greenhouse gases in the atmosphere Australian Greenhouse Office [31]. The carbon pools in these ecosystems are living biomass of trees, understory herbs, the dead mass of the litters, woody debris, soil organic matter and peat. The carbon stored in the above ground living biomass is the largest pool Vreugdenhil et al. [30]. Therefore, maintaining and enriching these ecosystems is a very crucial step wards to a sustainable development and green economy of a nation. Therefore, the objective of this study is to investigate the vegetation regeneration, tree growth, composition and above ground biomass and carbon stock potentials of the vegetation in Desa‟a forest from the permanent plots (Figures 3 & 4).
Figure 3: Monthly rainfall of Desa’a forest record at Atsbi metrological station from 1980-2016 (Ethiopia National Metrological Agency).

Figure 4: location of the study area blocks from Google earth (Giday, 2013).

Geographical Location: Desa‟a protected area lies between 130 20‟and 140 10‟ North latitudes and between 390 32‟ and 390 55‟ East longitudes. Desa‟a forest stretches in a narrow corridor along the eastern escarpment from close to Freweini town near Adigrat to the east of Quiha subcity Gebreegziabher [32]. The forest is located 60 km far north-east of Mekelle, the capital city of Tigray region Giday [27] and about 20 km south-east of Agula-e town, Eastern Zone. It is part of the northeastern highlands of Ethiopia, positioned in northeastern Tigray and northwestern Afar well placed for joint regional planning where its tributaries flow towards the Afar plains. In Tigray Region, it touches three woredas (districts); SaesieTsaeda-Emba, Atsbi-Wonberta and Enderta. Administratively, the former two woredas (districts) are found in the Eastern zone of the region and the latter one in the Southern zone of the region. And that part of the protected area falling in Afar Region touches the districts Aballa, Berahle and Koneba. However, considerable part of the area falls within Tigray Region Gebreegziabher [32]. The natural vegetation of the study area had been broadly classified as “dry evergreen Afromontane forest” with Juniperus procera and/or Olea europaea subsp. cuspidata as the dominant species Friis et al. [24,28,29].
Geology: As Giday [27] suggests extensive layer of flood basalt were positioned on the Ethiopian plateau of the Afar depression subsided to form the Denakil depression. The land forms encountered in the study area are from west to east. These are the Ethiopian plateau, the Ethiopian escarpment and the marginal basin. Antalo limestone, Enticho sandstone and Crystalline Basement are the dominant parent materials that are found on the plateau Asrat [33].
Soil: Desa‟a forest has a diverse geological formation that plays a big role in soil variability (Asrat [33]. The soil types of Desa‟a forest were classified as freely draining and variably textured Phaeozemes, Leptosols, Regosols, Calcaric combisols and Fluvisols are occurred Aerts et al. [34].
Altitude: Topographically the area exhibits moderately gentle to steep scarps. It forms a climatic buffer zone between the highlands of Tigray Region and the lowlands of Afar Region by extending in an easterly direction along and down the northeastern escarpment. In general the forest lies in an elevation range between 1500 and 2862m.a.s.l Hishe et al. [35]. Specifically the altitude of the permanent plots (research block) ranges from 2480m.a.s.l to 2540m.a.s.l Giday [29] with average altitude 2506m.a.s.l. All the permanent plots of the study area are homogenous in their environmental characteristics in terms of their slope, altitude, aspect, soil depth, stoniness and rock outcrop Giday [27].
Temperature: As the data from (1980 -2016) collected from National Meteorological Agency Atsbi Wenberta station (130 52.7‟N and 130 44.6‟E) located adjacent to the study area indicate that the mean minimum and the mean maximum temperature for the area varies in the range of 60C to 12.10C and 17.80C to 22.70C, respectively (Figure 2).
Rainfall: According to National Metrological Agency rainfall data of Atsbi Wenberta district that is near to the study area from 1980-2016, the rainfall of the area is frequently observed during the months of July and August. The amount of rainfall during these months ranges from the 158mm in the month of July up to the maximum 230mm in the month of August. This amount is very low when we compared to that of the other parts of the Tigray region. Such an amount of rainfall is also marginal for the growth of trees. However, there is an argument that the forests collect (absorb) moisture from the clouds or moist which usually builds up along the escarpment EWNHS [36].
Vegetation Cover: The vegetation cover of the forest is mostly dominated by the species of Olea europaea subspecies cuspidata and Juniperus procera followed by the thorny and shrub species of Carisa edulis, Maytenus obscura Giday [29]. There are also few species occurred like Rus vulgaris, Rus natalensis and Dodonea viscose.
The forest area was selected for a long term study by Mekelle University as with permanent plots established in 2009 for the following reasons., One, because it is one of the remaining patch forests under heavy challenge that found in the Tigray region; two, it possess diverse landscape and biological habitat; three, because of the ecological and economic importance it furnishes to the people near and around the forest areas.
Experimental Design: Three fenced and three unfenced permanently marked blocks of 40 × 160m established in 2009 were used for the purpose of the current study. Within each permanent block, nested plots of 40m x 40m for Bonsai, 20 m × 20m for trees and 5 × 5m for seedling measurements were laid out (Figure 5). There are four permanent plots within one block with three replication totally 12 permanent plot in the fenced and 12 permanent plots in the unfenced. The unfenced and fenced permanent plots are found side by side 20meter far by buffer zone between them.
Figure 5: one side of the fenced permanent plot (photo by Giday, 2013 left and Gebremichael Yiebyo on 19/11/2016 right).

Vegetation Composition and Tree Carbon Stock: The nested plots are to increase measurement efficiency, time and minimize counting errors. All trees and shrubs (diameter at stump height (DSH)≥1cm) encountered within the 20m x 20m were identified and measured for either their diameter at breast height or diameter at stump height using diameter tape and height using graduated stick for shorten trees and clinometers for tall trees. All seedlings and saplings (< 1cm diameter at stump height (DSH)) encountered within the 5m x 5m sub plots were also counted and identified KYOTO Giday [27,37]. The trees, shrubs and seedlings were identified and categorized based on local classification knowledge and crosschecked with scientific names on the use full trees and shrubs for Eritrea Bein et al. [38] and trees and shrubs of Ethiopia Bekelle [39] books.
All Bonsai growths, persistently browsed trees, encountered within the 40m x 40m plots were measured for both their diameter and height. Height of individual species was measured using meter tape and graduated stick based on their height accessibility and diameter tape and caliper for the diameter at breast or stump height
Regeneration and Composition of the Forest: After having tree inventory and measurement, data were assessed for regenerations and structural differences between paired fenced (Exclosure) and adjacent non-fenced plots. The density and percentage frequency of all woody species were calculated and the trees and shrubs were classified based on their DBH classification in to nine and height classification in to eleven classes and then finally drawn a histogram for both diameter and height classes.
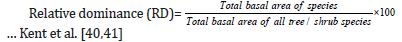
Importance value index (IVI) is used as a measure of species composition that combines frequency, abundance and dominance importance values [40,41]. The ecological importances of tree species in the permanent plot (IVI) were calculated using relative density, frequency and dominance parameters of each species.
IVI = RD + Rd + RF …………… Kent et al. [40,41]
Relative Density (Rd): Relative density is the study of numerical strength of a species in relation to the total number of individuals of all the species and calculated as Kent et al. [40,41].

Dominance of a species is determined by the value of the basal cover. Relative dominance is the coverage value of a species with respect to the sum of coverage of the rest of the species in the area.
Relative Frequency (RF): The degree of dispersion of individual species in an area in relation to the number of all the species occurred

Basal Area (BA): Basal area is the cross-sectional area of a tree estimated at breast height (1.3m), which is expressed in m2. Species with largest contribution in dominance value through higher basal area could be considered as the most important species in the study vegetation. The basal areas of each species were calculated using the formula of Philip [42]:
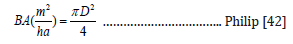
Where; BA = is basal area and D = is diameter at breast height of a tree
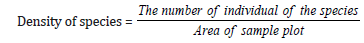
Density (Stems ha-1): Density expressed the numerical strength of a species. Here it will be calculated as number of individuals per hectare. …… [40,41]. Previous baseline and current regeneration data were used to analyze the regeneration and composition of
the forest. To estimate the effect of fencing on regeneration in the year 2009 and 2016 used paired t- test. Fencing is independent variable (fenced and unfenced management) to estimate the effect of fencing on regeneration was analyzed using independent t- test. The present data were only used to see the effect of fencing on bonsai growth. Hence fencing was the independent variable and bonsai growth was the dependent variable. The difference was tested using independent t-test.
Frequency is the number of times a species is recorded in a given number of plots. It refers to the degree of dispersion of individual species in an area and it is expressed in term of percentage of occurrence and calculated by the equation.

Previous baseline and current regeneration data were used to analyze the regeneration and composition of the forest. To estimate the effect of fencing on regeneration in the year 2009 and 2016 used paired t- test. Fencing is independent variable (fenced and unfenced management) to estimate the effect of fencing on regeneration was analyzed using independent t- test. The present data were only used to see the effect of fencing on bonsai growth. Hence fencing was the independent variable and bonsai growth was the dependent variable. The difference was tested using independent t-test.
Above Ground Carbon Stock
In the permanent plot for woody species an allometric equation developed by Chave et al. [43] was used. The development and use of country, biome, climate and species specific equations improve accuracy, minimizes error propagation and reduces bias arising from the generalizations producing by using a generic equations [43,44]. Chave et al. [43] allometric equation was selected because it is more robust than the other generalized allometric equations as it includes diameter, height and specific wood density rather than diameter at breast height only Huy et al. [45]. The inclusion of species and country specific wood density is an important predictor and it improves significantly biomass estimation Chave et al. [43]. For this study specific wood density of the species found in the study area for both indigenous and exotic species done by Ethiopia national forest reference submission report to UNFCC Anonymous [46] was used.
AGB = 0.0673 * (WD*∧ DBH 2 * H )∧ 0.976
A study conducted in Ethiopia by the Ministry of forest, environment and climate change says it gives values closer to the average calculated for different forest types in Ethiopia and it is selected by FDRE the Ethiopia forest reference level submission report to UNFCC Anonymous [46]. Where; AGB: Above Ground Biomass of the tree (kg) DBH: is diameter at breast height in (cm) at 1.3m height and H: is Tree height (m) WD: specific wood density of the tree we can take the specific wood density if not available we use the overall average wood density for the species which is 0.612g cm-3 (Anonymous [46]. Species specific allometric equations developed by different authors were used to estimate the biomass of a trees and shrubs. The species specific allometric equations developed by different authors are listed below in a Table 1.
Table 1: Species specific allometric equations developed by different authors used in the study area..

Below Ground Carbon Stock: Root biomass plays an important role in the carbon cycle as they transfer considerable amount of carbon to the ground. Root biomass is often obtained from root shoot ratio by taking 20% of below ground biomass conversion factor Mac Dicken [45]. The standard method for estimation of below ground biomass can be based on the equation given below developed by Mac Dicken [45]. Below Ground Biomass (BGB) = Above Ground Biomass (AGB) × 0.2 Mac Dicken [45]. To estimate the amount of carbon stock in the below ground can be followed the same procedure as to estimate above ground carbon.
BCG = BGB× 0.5……. (IPCC, 2006)
Where BGC is Below Ground Carbon, BGB is Below Ground Biomass and 0.5 is the conversion factor.
Estimation of Above Ground and Below Ground Carbon Stock: The total carbon stock density of the forest was calculated by summing of all carbon pool stocks
AGBGC = AGBC + BGBC
Where AGBGC is the Above Ground and Below Ground Carbon Stock of the permanent plot study area in Mg ha-1
AGBC is Above Ground Biomass Carbon Stock in Mg ha-1
BGBC is Below Ground Biomass Carbon Stock in Mg ha-1 and
Net change in Carbon Stock: Net change carbon stock of the study area is calculated by the total amount of carbon stock quantified in the last year subtracted by the total amount of carbon stock quantified in the baseline. Net carbon stock change = carbon stock of the 2016 – carbon stock of the 2009 Previous baseline and current regeneration data were used to analyze the carbon stock potential of the forest. To estimate the effect of fencing on carbon stock potential in the year 2009 and 2016 used paired t- test. Fencing is independent variable (fenced and unfenced management) to estimate the effect of fencing on carbon stock potential was analyzed using independent t- test. Data that violated the assumption of normality was log 10 transformed before the statistical analysis. For all statistical tests was carried out using (IBM SPSS statistics for windows, version 22. Armonk, NY: IBM Corp.).
Forest Composition: The established three blocks paired permanent plots, a total of 27 woody species representing 18 families were encountered within the total of 24 plots, in 2016. There were five species commonly found within the permanent plots. These are Olea europaea subspecies cuspidata, Juniperus procera, Maytenus arbutifolia, Rhus natalensis and Carissa edulis, which had similar composition with that of 2009. The total woody species seedling composition of the study area in the fenced permanent plot was increased in number from 1047 in 2009 to1480 in 2016, and the number of sapling, shrubs and trees was also increased from 535 in 2009 to 820 in 2016.
A total of 2300 and 1187 stems within 0.48 ha individuals of woody species including seedling, trees and shrubs were encountered in the fenced and unfenced permanent plots respectively in 2016 (Table 2). Whereas, the number of individual woody species in 2009 were 1582 in the fenced and 1210 in the unfenced plots (Table 2). The composition of the whole woody vegetation species in the fenced plots were 64.35% seedling and 35.65% trees in 2016 (Table 2). However, the compositions of seedling and trees in the unfenced plots in 2016 were 42.97% and 57.03% respectively (Table 2).
Table 2: Forest composition of the permanent plot study area stems per sample plot.

In 2016, total density of all seedling woody species was found to be 50666 and 1700 stems per hectare in the fenced and unfenced permanent plots respectively (Table 3). Whereas, the density of all seedlings that found in 2009 were 34900 and 24100 stems per hectare respectively (Table 3). Total density of all tree and shrubs woody species in 2016 was found to be 1708 and 1410 stems per hectare in the fenced and unfenced permanent plots respectively (Table 3). However the total density of all trees and shrubs found in the year 2009 were 1114 and 1014 stems per hectare for the fenced and unfenced permanent plots respectively (Table 3). The overall trees and seedling density that found in the fenced and unfenced was 52375 and 18410 stems per hectare in 2016 (Table 3). However, the total density of the permanent plots that found in the fenced and unfenced was 36014 and 25114 stems per hectare in 2009 (Table 3). Only two species of trees and shrubs were found to be dominating the permanent plots. The dominant species of the area relatively to the other 26 species based on relative density are Olea europaea sub species cuspidata and Juniperus procera which shared almost 88% of the total density.
Table 3: Effect of fencing on regeneration of seedling, tree and total density in stems per hectare using independent t-test.

On the other hand Acacia seyal, Tarchonanthus camphoranthus, Calpurnia aurea, Osyris quadripartita, Ekebergia capensis, Combretum aculeatum, Euclearacemosa, Rhus glutinosa, Acokanthera schimperi and Maytenus undata had very low density both in the fenced and unfenced plots both 2009 and 2016 regeneration data. Where; left actual mean in bracket the transformed mean and plus or minus is the standard error of the actual mean, significant difference among the management and time tested at P < 0.05. In 2016 fencing has brought a significant difference on regeneration of seedling and the total woody plant species with seedling densities of 50666 ± 11187 and 52375 ± 11266 stems per hectare (P < 0.05) respectively. However, the density of trees (trees and shrubs ≥ 1cm DSH) woody plant species was not significantly different (P = 0.373). Long term effect of fencing has a significant difference on vegetation regeneration of the seedling and overall woody plant species densities between the fenced of 2009 and 2016 (P = 0.001) (Table 4) for both seedlings and total woody plant species densities.
Fencing has also a marginal significant difference on tree (trees and shrubs ≥ 1cm DSH) densities of the fenced 2009 and 2016 (P = 0.02). The unfenced (open environment) has also a significant difference within 2009 and 2016 (P< 0.001) (Table 4) for seedling and total density. The open environment has also a significant difference in the tree density over the time. The basal area of all woody plant species with diameter greater than 2.5cm was found to be around 10 m2 ha-1 for both fenced and unfenced permanent plots in 2016. However, it was found 8 and 7 m2 ha-1 for fenced unfenced plots in 2009 respectively. At species level, all woody species was found to have less than 0.1meter square per hectare except Olea europaea subspecies cuspidata and Juniperus procera which had basal area of 5 m2 and 6 m2 ha-1 in the fenced and unfenced plots respectively in 2016. The mean basal area of the 2016 permanent plot was found 10.71 and 10.18 for fenced and unfenced respectively (Table 5). However, the mean basal are of 2009 was found 8.38 and 7.07 in the fenced and unfenced permanent plots (Table 5).
Table 4: Long term effect of fencing on regeneration between 2009 and 2016 using paired t-test.

Table 5: Mean Basal Area in m2 ha-1 comparison between the fenced and unfenced at the two years using Independent t-test.

Fencing did not bring significant change in mean basal area of the 2016 (P = 0.836). Similarly fencing has also no significant change in mean basal area of 2009 (P = 0.542). Time did not bring any significant difference in mean basal area of the 2009 and 2016 (P = 0.43) for fenced management. But, unfenced (open environment) has got a significant change in mean basal area (P = 0.036) (Table 6). Generally, according to the important value index results, Olea europaea subspecies cuspidata and Juniperus procera were the two most important dominant woody species found with high value of relative frequency, relative density and relative basal areas in the study area in both fenced and unfenced plots in 2016 and 2009.
Table 6: Mean basal area in m2 ha-1 comparison of the fenced within the two years and unfenced within the two years using paired t-test.

The comprehensive patterns of the population structure of the whole woody species expressed in diameter class distribution of the fenced in 2016 (Figure 6) showed an inverted J-shape. However, the diameter class distribution of the whole woody species in the unfenced block was an irregular shape (Figure 6). More numbers of individuals are shown in the lower diameter and height classes of the fenced and unfenced permanent plot (Figures 6 & 7). However, higher regeneration potential was observed in the fenced. The DBH class is classified as 1= <2.5cm, 2= 2.6-5cm, 3= 5-7.5cm, 4=7.5- 10cm and 5=10-12.5cm, 6=12.6-15cm, 7=15.1-17.5cm, 8=17.6-20, 9=>20cm. The Height class of the fenced and unfenced is classified as 1=<2m, 2= 2-2.5m, 3= 2.53m, 4= 3-3.5m, 5= 3.5-4m, 6= 4-4.5m, 7=4.5-5m, 8=5-5.5m, 9= 5.5-6m, 10= 6-6.5m and 11=>6.5m At the time of permanent plot established the diameter and height class distribution of the whole woody species showed there is higher number of lower class and there is a few number of woody species in the second class. In general the diameter and height structure showed as there is an irregular shape (Figures 8 & 9). The DBH class is classified as 1= < 2.5cm, 2= 2.6-5cm, 3= 5-7.5cm, 4=7.5- 10cm and 5= 10-12.5cm, 6=12.6-15cm, 7=15.1-17.5cm, 8=17.6-20, 9=>20cm
Figure 6: Experimental design of the permanent plot within one block for regeneration and bonsai growth (own processing, 2016).

Figure 7: Diameter class of all woody species of the fenced and unfenced 2016.

Figure 8: Height Class of all Woody Species of the Fenced and Unfenced 2016.

The Height class of the fenced and unfenced is classified as 1=<2m, 2= 2-2.5m, 3= 2.53m, 4= 3-3.5m, 5= 3.5-4m, 6= 4-4.5m, 7=4.5-5m, 8=5-5.5m, 9= 5.5-6m, 10= 6-6.5m and 11=>6.5m. The DBH class is classified as 1= <2.5cm, 2= 2.6-5cm, 3= 5-7.5cm, 4=7.5- 10cm and 5= 10-12.5cm, 6=12.6-15cm, 7=15.1-17.5cm, 8=17.6-20, 9=>20cm and The Height class of the fenced and unfenced is classified as 1=<2m, 2= 2-2.5m, 3= 2.5-3m, 4= 3-3.5m, 5= 3.5-4m, 6= 4-4.5m, 7=4.5-5m, 8=5-5.5m, 9= 5.5-6m, 10= 6-6.5m and 11=>6.5m. In Olea europaea subspecies cuspidata both the diameter and height class distribution shows an inverted J-shape at the fenced and irregular shape at the unfenced (Figures 9 & 10). The DBH class is classified as 1= <2.5cm, 2= 2.6-5cm, 3= 5-7.5cm, 4=7.5-10cm and 5= 10- 12.5cm, 6=12.6-15cm, 7=15.1-17.5cm, 8=17.6-20, 9=>20cm and The Height class of the fenced and unfenced is classified as 1=<2m, 2= 2-2.5m, 3= 2.5-3m, 4= 3-3.5m, 5= 3.5-4m, 6= 4-4.5m, 7=4.5-5m, 8=5-5.5m, 9= 5.5-6m, 10= 6-6.5m and 11=>6.5m. The diameter and height classification of the Juniperus procera species shows there is very low in number with diameter class one < 2.5cm at the seedling stage. The number of individuals of the species Juniperus procera is increase in the tree stage rather than the seedling stage. Generally both the diameter and height class structure shows an irregular shape (Figures 10 & 11).
Figure 9: Diameter Class of all Woody Species of all Woody Species of the Fenced and Unfenced 2009.

Figure 10: Height Class of all Woody Species of the Fenced and Unfenced 2009 Baseline.

Olea europaea subspecies cuspidata is the highly and frequently browsed tree species by wild and domestic animals. The study is focused on this species on growth that means producing of new developing shoot that is proactive from the existing browsed species after fencing in terms of diameter and height. The average height of the bonsai growth was found to be 1.15m for the fenced. The difference in bonsai height and diameter growth is highly significant (P< 0.001). Fencing had significant contribution to bonsai diameter growth (P< 0.001) with mean relative diameter growth of 10.5 ± 0.9cm (Table 7). The total density of the bonsai that found in the fenced permanent plots were 343 and 434 is found in the unfenced permanent plots (Figure 7). Fencing has not brought a significant difference in total density of the browsed persistent seedling (bonsai) (Figure 7). Where; DSH is the relative diameter at sapling growth in cm, height is the relative height growth of the new leading shoot from the bonsai, significant difference among the management was tested (P < 0.05).
Figure 11: Height Class of all Woody Species of the Fenced and Unfenced 2009 Baseline.

Table 7: Bonsai growth explanation based on height and diameter in cm and density per sample plot.

Above Ground and Below Ground Carbon Stock: In 2016, the above ground and below ground carbon stock of the fenced plots ranged from 2.25 Mg C ha-1 to 56.9 Mg C ha-1 and in the unfenced plots it ranged from 0.56 Mg C ha-1 to 22.53 Mg C ha-1. In 2009, the Above Ground and Below Ground Carbon Stock of fenced and unfenced plots ranged from 1.15 Mg C ha-1 to 48.2 Mg C ha-1 and from 0.07 Mg C ha-1 to 43.3 Mg C ha-1 respectively. From the base line data (2009), the average above ground and below ground carbon stock of the fenced and unfenced plots was 15.88 Mg C ha-1 and 12.03 Mg C ha-1 respectively (Table 8). Eight years later in the year 2016, the average above ground and below ground carbon stock potential of both the fenced and unfenced permanent plots 19.43 Mg C ha-1 and 12.95 Mg C ha-1 respectively (Tables 8 & 9). Fencing had a significant difference on above and below ground carbon stock of the forest between 2009 and 2016 (P = 0.005), while the unfenced permanent plot did not show significant difference (P = 0.424) between 2009 and 2016 on above and below ground carbon stock accumulation. At the time of establishing the permanent plots (2009), there was no significant difference on carbon stock between the fenced and unfenced blocks (P = 0.597). The same result is recorded after eight years in 2016, showing no significant difference on the carbon stock of the fenced and unfenced blocks (0.382).
Table 8: Comparison of above ground and below ground mean carbon stock potential over time using paired t-test.

Table 9: Comparison of above ground and below ground mean carbon stock potential between fenced and unfenced.

Figure 12: Diameter and Height Class of all Juniperus procera fenced and unfenced 2016.

Figure 13: a) goats browsing Olea europaea species b) browsed species of Olea europaea and b) Development of leading shoot on persistent bonsai after fencing for eight years (Pictured 28/11/2016 by Gebremichael Yiebyo).

Figure 14: Above ground and below ground mean carbon stock potential in the two years with the fenced and unfenced management.

Net Change In Above and Below Ground Carbon Stocks: The net total live tree carbon stock change of the fenced and unfenced block was found 3.56 Mg ha-1 and 0.9 Mg ha-1 respectively within eight years. That means the fenced management is increased its carbon stock by 0.44 Mg C ha-1 yr-1 and the unfenced permanent plot is also increased its carbon stock change by 0.11 Mg ha-1 yr-1 which is the average net gain annually.
The current (2016) species composition was similar with the baseline (2009), in which Olea europaea subspecies cuspidata, Juniperus procera, Maytenus arbutifolia, Rhus natalensis and Carissa edulis were the dominant species in both years. The same result was recorded by Giday [27] at this study area showing that there was no change in the species composition in the last decade. This study revealed that the vegetation composition of the forest overstory layers of the fenced area was much denser than the unfenced areas. This is in line with the study of Birhane et al. [47] in Aynalem Wukro Woreda Ziban Serawit exclosure for eight years encountered 2659 number of individuals of woody species in the exclosure and 746 in the open grazing area. Due to the high and frequent disturbance by animals and human interference the number of seedling of woody species was declined in the open grazing land. The better cover of overstory and understory layers are an opportunity for supporting further regeneration by crating better soil conditions and moisture conservation Birhane et al. [27,47].
Abundance, Density, Basal Area and Important Value Index: Olea europaea subspecies cuspidata and Juniperus procera were the two most important dominant woody species found with high value of relative frequency, relative density and relative basal areas in the study area. They also constituted 88% of the total density. Aynekulu et al. [48] reported similar result in Hugumbrda dry Afromontane forest where higher IVI was recorded for Olea europaea subspecies cuspidata and Juniperus procera. In the current study fencing had significant difference on plant species density over the unfenced one. This is in line with the results of Woods et al. [49] a study conducted in South Gonder Afromontane, where seedling density with a wall is significantly higher than of the seedling density without wall (P = 0.003) they recorded 383 seedlings from a wall and 113 seedlings without a wall from 54 (1m × 1m) plots.
This is due to the alleviation of anthropogenic activities such as collection of fire wood, illegal logging, livestock free grazing throughout the year as well as trampling which subsequently altered the species seedling. Fencing has been observed to stimulate the regeneration through protecting the disturbances by anthropogenic factors and it could have favored growth of native tree and shrub species such as Olea europaea subspecies cuspidata, Maytenus arbutifolia, Rhus natalensis and Carissa edulis. However, density of woody tree species did not show significant difference between the fenced and unfenced. This result agreed with the study of Wekesa et al. [50] where the stem density in the disturbed and undisturbed forests was not significantly different (P = 0.378). In line with the study of Senn et al. [51] the density of trees is higher in both fenced and unfenced areas.
A study of Leife [52] study in Gabrone, Botswana a permanent plot fenced over the 11 years is also supports this finding the total number of tree density is increased both in the exclosures and control plots (P = 0.789). This is due to the number of thorny and shrubs species affected neither the survival nor the development by the disturbances of animals and humans. The basal area of the fenced as well as the unfenced did not differ significantly P = 0.542 and P = 0.836 in both 2009 and 2016. In the open environment there was a significant difference in the mean basal area (P = 0.036). The significant difference occurred in the open environment is may be due to the reducing of the computation in nutrient, soil moisture, sunlight and other important needs to the plant at the fenced they reduce the diameter growth Aynekulu [29,48].
This study indicated that the natural regeneration status of Juniperus procera in Desa‟a forest is weak and in danger. This finding is supported by Aynekulu [48,29] and Aynekulu et al. [48] the regeneration of the native tree species in the open environment is very low and in a serious problem in the dry Afromontane forests. However, the regeneration of such forests were improved after exclosesing and protected from the interference of humans and animals [18,28,27,48]. The regeneration status of Juniperus procera is listed in IUCN Farjon [53] as in a red list of threatened species which is confirmed in this study that its regeneration is found to be very limited in both fenced and open environment of the dry Afromontane forests of Ethiopia that threatens its future existence [28,27,48].
The bonsai height was significantly higher in the fenced than the unfenced. This is in agreement with the study by Aerts et al. [54] and Giday [27] olive tree coppice, the growth of persistent Olea europaea sub species cuspidata, is more abundant and effective in the exclosures along the landscape degraded drainage lines than the open and free grazed areas. Fencing was a significant change in height and diameter growth with 11.5cm and 10.cm. This is agreed with the study of Giday [27] fencing was found to be an average increase in height growth with 22±7cm per year. Mahari, [55] has also stated that the disturbances from livestock affect the survival of tree seedlings in the drylands of north Ethiopia.
Above Ground and Belowground Carbon Stock: The fenced plots have shown a significant variation on Above Ground and Below Ground Carbon Stock over the unfenced one over the time. In line with this a study by the forest structure and tree density is higher and significant difference in the protected than the disturbed areas the above result of the forest population structure and density of trees is also affects the biomass and carbon stock of the forests. This is in agreement with the study by Yohannes et al. [56] higher total means carbon stock of above ground biomass was recorded in the least disturbed than the medium and higher disturbed forests. This is may be due to the trees and shrubs density is increased over a time has a significant effect (P = 0.02). However, on the unfenced over a time has not significant difference over a time. Because the tree density is increased over a time in both fenced and unfenced blocks.
This is may be due to in consistency with the above result of trees and shrubs stem density is not significantly differed (P = 0.373). As the trees and shrubs stem density per hectare is not that much changed over time. Because the biomass and carbon of a forest is expressed by the factor of diameter at breast height, height and wood density Chave et al. [43] affects the amount of carbon stored in the forest. This is similar with the study of Mokria et al. [57] were found 19.3 ± 3.9 Mg C ha-1 at this forest area. This may be due to the trees and shrubs stages that are explained by the factor of diameter and height are high resistant to the disturbances that do not much affect by animals browsing and trampling because once they grow the animals cannot reach the leave of the trees and they may also develop their resistivity to the climate variability like moisture stress if once move to the stage of tree from the stage of seedling. According to the report USAID [58] showed that, long term fencing or protecting of an area to exclude grazing and browsing animals is higher carbon stock in the below ground and root as woody biomass and carbon increases. This is due to the minimizing of the disturbances by animals and humans.
Net Carbon Stock: This is in agreement with the study Yohannes et al. [56-59] conducted in West Shewa Oromia region Gedo forest, which described as forest disturbance increased, carbon stock in the above ground carbons, below ground carbons, litter, grasses and herbs carbons, soil carbon and total carbon stock density pools decrease. Higher total means for above ground carbon, below ground carbon, grasses, herbs and litters biomass carbon and total carbon density was obtained on the protected and or least disturbed stand [60-68].
The population status of tree species in the fenced permanent plot showed good regeneration progress. This indicates that though fencing the whole forest is practically difficult, exclosing and avoiding disturbances can among the indigenous species, Olive tree was found to have higher regeneration and IVI in the fenced permanent plot, hinting the possibility of restoring this species through exclosion of disturbances [69-74]. However, though Juniperus procera, the most dominant species in Desa‟a, brought the highest IVI, it is in a danger with a very limited regeneration. It is currently found mostly in the tree life form. The thorny and shrub species of Maytenus arbutifolia, Rhus natalensis and Carissa spinarium is mostly dominated the regeneration of the unfenced permanent plots [75-86]. Even in the fenced permanent plots they are in a good regeneration advancing to dominate the ecosystem. In this study, it is revealed that protecting the degraded and remnant forest from the disturbances of animals and humans by fencing has contributed positively to the natural regeneration and survivssal of the native tree species especially Olea europaea sub species cuspidata and other dominant shrubs [87-93].
Even when the regeneration potential of this dry evergreen Afromontane forest is in good conditions at the seedling level there is a problems to survive and growth as their potential of the seedling regeneration to the mature tree species of the native trees species for the future they may be replaced by the drought tolerant thorny shrubs and bushes On the other hand, protecting of the remnant Desa‟a dry ever green Afromontane forest significantly contributes to the restoration of Olea europaea subspecies cuspidata alternatively from the growth bonsai. Through better growth and regeneration of different trees and shrubs, avoiding disturbances, livestock and human, improve both above and below ground carbon stock [94-105].
a. If appropriate management activities like fencing and excluding the disturbance of animals and humans are applied, the population structure of most of the native tree species like Olea europaea would be more stable.
b. Bonsai growth of the species Olea europaea subspecies cuspidata and developing new leading shoot from its persistent seedling has a significant conservation values and the most important as succession facilitator. So, protection of the staid potential of the forest areas of the dry Afromontane forest by different management to enhance the regeneration status and development of leading shoot from the persistent browsed Olea europaea subspecies cuspidata seedling is the best option to conserve the degraded dry evergreen Afromontane forests than recruitment from the seed bank.
c. Future research should focus on over all regeneration potentials including vegetative propagation and soil seed bank regeneration capacity of the forest especially Juniperus procera, and total carbon stock including soil carbon of the permanent plot study area.
More research is needed to understand the relationship between species composition and above ground biomass carbon stock in the Desa‟a dry forest.


