Impact Factor : 0.548
- NLM ID: 101723284
- OCoLC: 999826537
- LCCN: 2017202541
Sifen Lu1, Jing Song2 and Maoshan Chen*3
Received: November 26, 2018; Published: December 11, 2018
*Corresponding author: Maoshan Chen, Australian Centre for Blood Diseases, Department of Clinical Heamatology, Central Clinical School, Melbourne, Victoria, Australia
DOI: 10.26717/BJSTR.2018.11.002172
Many bioinformatics tools have been developed for data analysis and focus on some specific problems. However, one program is not enough to complete the data mining. We developed CPLSTool (https://github.com/maoshanchen/CPLSTool) that can compress multiple bioinformatics tools and the produced pipeline can be used for data anlaysis repeatly. The most significant advantage of using CPLSTool is to save waiting time, compared to step-by-step analysis. In addition, some steps for the data analysis can be run parallely in order to save the program running time. We used CPLSTool to build an automatic pipeline based on QIIME and analyzed skin 16S rRNA data. The results showed that a total of 102 minutes can be saved using CPLSTool and the visualization of results improves our understanding of the results. CPLSTool can be applied in any kind of data analysis, including genomic, transcriptomic, proteomic and metagenomic data analysis. The use of CPLSTool will improve our understanding of data analysis and save time and computing resources.
Keywords: Bioinformatics; Pipelines; Next-Generation Sequencing; Data Analysis
The last decade has witnessed the breaking development of Next-Generation Sequencing (NGS) tools, including Transcriptome Sequencing (RNA-Seq), Whole-Genome and Whole-Exome Sequencing (WGS/WXS), Metagenomics, Chromatin Immunoprecipitation or Methylated DNA Immunoprecipitation followed by Sequencing (ChIP-Seq or MeDIP-Seq), and a multitude of more specialized protocols, such as Cross-Linking Immunoprecipitation (CLIP-Seq), Assay for Transposase-Accessible Chromatin Using Sequencing (ATAC-Seq), and Formaldehyde-Assisted Isolation of Regulatory Elements (FAIRE-Seq) [1]. Every NGS tool was born with one or more analysis applications and now there are many bioinformatics tools developed for general and special research purposes, such as BWA [2], ExScalibur [3], Chipster [4], Churchill [5], NEAT [6], MG-RAST [7], TopHat [8] and QIIME [9]. However, there are some drawbacks for these tools. For example,
i) Some tools concentrate on a single analysis step instead of completing all needed contents, such as BWA and Top Hat;
ii) It is difficult to add new analysis contents to current integrated pipelines, such as NEAT;
iii) Some tools are based on web server and the analysis is limited by the internet speed sometimes, such as MG-RAST; and
iv) An automatic pipeline is necessary for the whole analysis rather than step-by-step operation, such as QIIME. Moreover, the tremendous amount of NGS output requires a possible way to speed up the analysis.
Thus, it is important to develop a clever way to organize the related tools and software within reasonable time to get automatic pipelines and to speed up the overall procedure using parallelization and acceleration technologies [10]. To address this need, some features of a program should be considered when it is developed, such as
i) Management of related tools and programs regardless of their own program language and input file formats,
ii) Flexibility of adding new contents,
iii) Generating an automatic pipeline instead of step-by-step operations, and iv) use of parallelization and acceleration technologies. We developed CPLSTool, which can conform to all the above features. CPLSTool is freely available for users from https://github.com/maoshanchen/CPLSTool.
CPLSTool functions on LINUX command lines and has been developed and tested on the CentOS operating system version 4.8 with Sun Grid Engine scheduler. It is developed using the Python3 language. Required modules for this software are listed in Table 1.
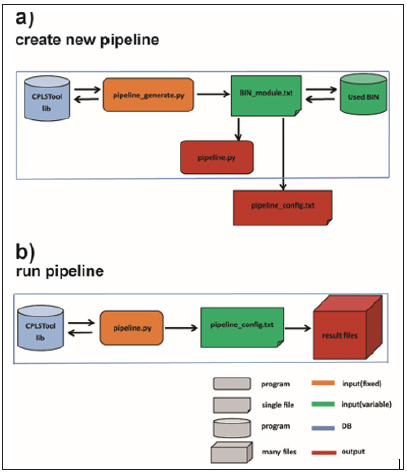
The CPLSTool can be downloaded from https://github.com/ maoshanchen/CPLSTool and can work with the LINUX system and the Sun Grid Engine scheduler. CPLSTool can be operated by the following steps (Figure 1).
Figure 1: Work flow of CPLSTool. Two steps are processed to run CPLSTool, including a) to create the new pipeline defined by the user and b) to run the new pipeline for data analysis.

a) Step 1: click the command line ‘SS’ ‘python3 pipeline_ generate.py -i BIN_module.txt -o auto_pipeline’ to create a new analysis pipeline. The auto_pipeline is the folder to store the output integrated pipeline produced by CPLSTool, and the BIN_ module.txt is the configuration file, which includes the contents and regulations used to generate the pipeline, and the Used_BIN is the place to store the tools and programs used in the BIN_ module.txt file. The pipeline generated by CPLSTool contains two files – pipeline.py, which is the main program of the pipeline, and pipeline_config.txt, which contains the variables set by the BIN_module.txt file and plays a role in the port of the pipeline.
b) Step 2: click the command line ‘python3 pipeline.py -i pipeline_config.txt -b BIN_dir -o result_dir –name test’ to run the new pipeline. The result_dir is the folder to store the analysis result files, and the pipeline_config.txt contains variables used by the pipeline. The pipeline generated by CPLSTool can be used multiple times once it is set. However, a new BIN_module. txt need to be created when new contents are added to the pipeline or some contents are removed from current pipeline.
CPLSTool works by processing multiple modules/software preset by the user. The parameters for these modules are set in the BIN_module.txt file. Figure 2 shows the required information for setting the BIN_module.txt file. Every step is defined and run as a module. The settings and parameters for every module start from [Job Start] and end with [Job End]. Fixed flag characters are in red, constent parameters for all modules are in orange, default values for some parameters are in black and required parameters are in blue. Alternatively, variables for the module can be set in bold blue and specific values of these variables can be defined in the pipeline_ config.txt file.
Modules can be added or deleted in the BIN_module.txt file and the maximal number of modules is 20. Notably, the output files of previous module which are required by the next module should be consistent all the time. The Major parameter can be set to true if the output of this module is required by the next one, or the next module can be run parallelly with this module. More detailed illustration of the BIN_module.txt file is in the (Appendix 1).
Common parameters and databases required by the analysis are set in the pipeline_config.txt file (Figure 3). Parameters for the analysis are set to contain the ‘Para’ prefix while the databases are set to contain the ‘DB’ prefix. More detailed illustration of the pipeline_config.txt file is in (Appendix 2).
Some other features of CPLSTool enables the users to customize the running of the new pipeline. For example, the setting for threads ‘-t’ and the setting of computing node ‘-q’ can cover the number of threads and cover the queue name in the BIN_module.txt file, respectively. If additional samples are put into the analysis, the setting ‘-a’ can be set to analyze the new samples only.
To test CPLSTool, we installed the program QIIME and tested the pipeline using 16S sample data from the Human Microbiome Project (HMP) [11,12]. We tested the pipeline introduced by QIIME tutorial and the 16S data can be downloaded from https://portal. hmpdacc.org/search/c?facetTab=cases.
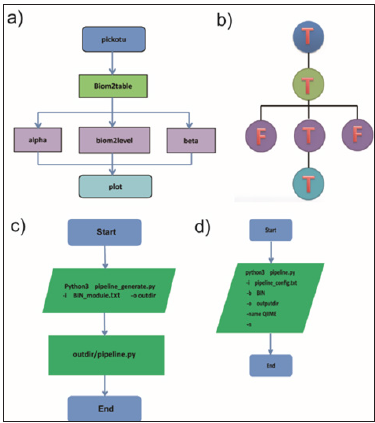
To test this tool, we installed QIIME and generated a pipeline which contains six functions for 16S rRNA data analysis, such as pickotu, biom2table, alpha, biom2level, beta and plot (Figure 4a). Figure 4b shows the order to run these subroutines of QIIME and the major steps were marked as T. Because OTU analysis is essential for subsequent analyses, it is a major step in this pipeline. Alpha, Beta and biom2level steps can be run parallelly as there is no internal communication between them. Next, we run the first part of CPLSTool to generate the pipeline for 16S rRNA data analysis and run the pipeline. The BIN_module.txt file pipeline_config.txt file and can be viewed in( Appendix 3).
Figure 4: The example of pipeline for QIIME. a) The analysis contents used in the pipeline. b) The primary and secondary relation of all the steps, T prerents major steps, F prerents minor steps. It is corresponding to the above analysis contents in a. c) The step of creating a new pipeline for QIIME. d) The step of running the new pipeline for QIIME.

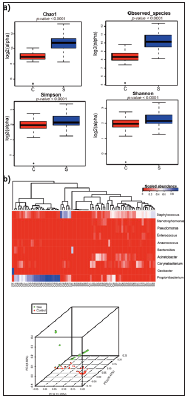
Figure 5: Alpha and beta diversity results of the QIIME pipeline. a) Alpha diversity analyses distinguish the S samples from C samples in terms of Chao 1, observed species, Simpson and Shannon indexes. b) A heat map of the abundance of top 10 species identified in the samples and the principle component analysis (PCA) of all identified species showed that S samples are different from C samples.

To test the QIIME pipeline generated by CPLSTool, 16S rRNA data for 39 retroauricular crease samples (S) and 39 control skin samples (C) were obtained from the HMP. After data cleaning, PEAR (https://sco.h-its.org/exelixis/web/software/pear/) was used to merge the paired reads into one single tag. Then, all the tags were subjected to an open-reference OTU picking process (97_otus. fasta used as the reference) and then the OTUs were analyzed in terms of their identify and abundance. The alpha and beta diversity results for these samples were analyzed and shown in Figure 5. Both indicate that retroauricular creases samples were different from the control skin samples. The most abundant species in the retroauricular crease and the control skin samples were Staphylococcus and Propionibacterium, respectively. Some control samples were clutered with retroauricular crease samples, probably because the samples were obtained from the nearby area.
The most significant advantage of using CPLSTool is to save the waiting time between steps and to save the coding time, compared to operating the analysis step by step. As the log file can record the time cost for every step, we calculated the time usage for above analysis using CPLSTool and manual operation. It is clear that CPLSTool can save a total of 102 minutes for the analyzes using the six modules and the saved time for every step can be seen in Table 2.
CPLSTool is a use-friendly framework to generate automatic bioinformatics pipelines. It requires only one input configuration file and considers parallelization and acceleration technology. It is designed to combine multiple anlaysis modules into one pipeline and process the data smoothly. Users can compress any analysis tools into the pipeline and save them for future use. In addition to the time saving, CPLSTool is adaptive to all programs that can be run on the Linux platform, such as python, perl and R programs. In omicX website (https://omictools.com) m a n y bioinformatics applications can be found and all of them can be applied to CPLSTool and to build the customized pipeline for data analysis. Users can build their own pipelines for genomics, transcriptomics and proteomics data analysis using CPLSTool to compress the available applications.
CPLSTool is developed for users who has some programming experience. Once the setting files (BIN_module.txt and pipeline_ config.txt) and pipelines are generated, they can be used many times until the pipeline is going to be updated. It should be aware that the parameters in the setting files can be modified even when the pipeline is generated. This flexibility gives more options to analyze the data.
CPLSTool builds bioinformatics pipelines using public available applications. Compared to step-by-step analysis, CPLSTool saves a lot of waiting time and is a use-friendly program that is adaptive to any bioinformatics software. We tested the CPLSTool to build a pipeline based on QIIME for 16S rRNA data analysis. The produced pipeline can analyze 16s rRNA data in terms of identifying OTUs, species analysis, alpha and beta diversity analyses. Also, the produced pipeline can draw plots to visualize the results. In addition to less time consuming, CPLSTool has other features. For example, the generated pipeline is re-usable once it is built. Small modifications can be applied to the setting files. However, CPLSTools requires the users to have some programming experience. Probably in the next version we can compress some basic bioinformatics tools or common software to the CPLSTool, in order to satisfy users without any bioinformatics experience.


