Impact Factor : 0.548
- NLM ID: 101723284
- OCoLC: 999826537
- LCCN: 2017202541
Richard M Fleming*1, Matthew R Fleming BS1, Tapan K Chaudhuri2, William C Dooley3 and Andrew McKusick1,4
Received: November 18, 2018; Published: November 28, 2018
*Corresponding author: Richard M Fleming, FHHI-OmnificImaging-Camelot Los Angeles, CA, USA
DOI: 10.26717/BJSTR.2018.11.002111
Keywords: FMTVDM©℗; B.E.S.T. Imaging©℗; Breast Cancer; Breast Inflammation; Theranostics; Quantification; AI
Abbrevations: BEST: Brest Enhanced Scintigraphy Test; RBFD: Regional Blood Flow Differences
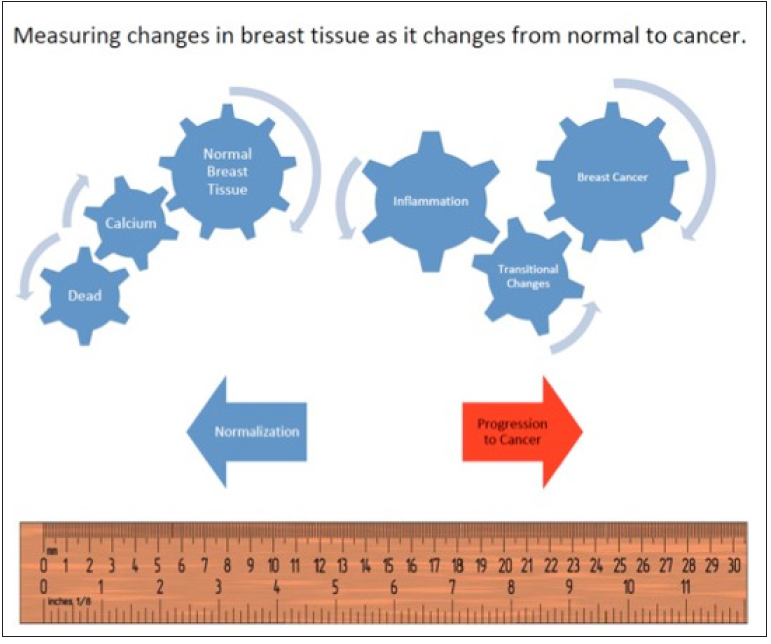
Until quite recently, diagnostic imaging has relied upon “qualitative” imaging methods limited by “inattention blindness”, reader expectation bias and the ability to define disease as either present or absent. The first marker that you are using a “qualitative” test is a discussion of sensitivity, the ability to find disease when present and specificity, the ability to exclude disease when absent [1-9]. This yes/no approach to medicine reflects the limitations qualitatively imposed upon us despite the understanding that tissues don’t simply exist in either a “normal” or “diseased” state but rather a transition occurs as the genetic and environmental factors influencing tissues results in changes; transitional changes, which can now be fully appreciated and measured [1-9]. The quantitative ability to measure Breast Health, using Breast Enhanced Scintigraphy Test [FMTVDM©℗; B.E.S.T.©℗] Imaging by measuring regional blood flow differences (RBFDs) and tissue metabolism [1-9] makes it possible to differentiate several changes in tissue type; recognizing a “Health-Spectrum” defined by Figure 1.
While the concept of treating patients based upon their individual response has been discussed for some time, the ability to implement such treatment based upon imaging studies has been limited due to the use of “qualitative” imaging. With the introduction of FMTVDM©℗; B.E.S.T.©℗ Imaging [1-9], absolute true “quantification” of both cardiac and oncologic imaging and treatment response now exists [1-9]. A direct consequence and benefit of the ability to “measure” these transitional changes in tissue, is the ability to measure treatment outcomes over a spectrum of tissue health as demonstrated in the following example.
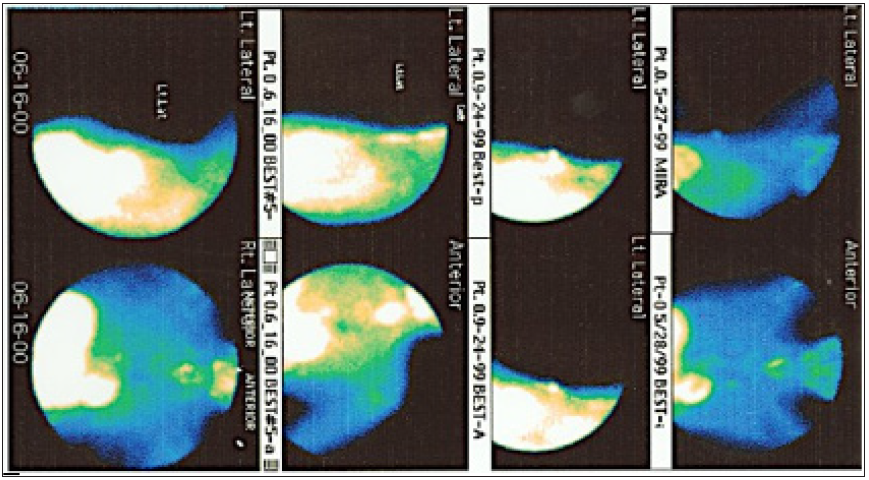
Presented here is a 58-year old Caucasian woman who underwent evaluation by her primary physician for a lump in her left breast. Prior to the mastectomy, her B.E.S.T.©℗ Imaging study revealed a quantitative value of 480. Her tissue biopsy revealed an infiltrating ductal carcinoma. She initially underwent mastectomy and treatment of a primary left sided Stage 2 Breast [T1, N2, M0, E2+, PR+, Her2-] Cancer. Following mastectomy she underwent chemotherapy and radiation therapy. Four months after her initial diagnosis, she had a follow-up B.E.S.T.©℗ Imaging study, which demonstrated a recurrence of her breast cancer with a quantitative value of 294. She underwent further mastectomy (resection) and was placed on hormonal therapy, with instructions to make dietary and lifestyle changes. Serial B.E.S.T.©℗ Imaging showed continued improvement, with her last study showing continued improvement with a B.E.S.T. ©℗ Imaging value of 149 and no evidence of further recurrence (Figure 2).
Figure 1:Health-Spectrum.
The interaction between cellular genetics and environmental factors consequently influence changes in tissue resulting in transitional changes including regional blood flow differences and metabolism. At one end of the spectrum is the absence of life, which may or may not be associated with a significant accumulation of cellular debris, inter alia, intercellular calcium, which may occur prior to the actual loss of cellular “life”. In order of increasing regional blood flow and cellular metabolism are what is considered to be the “normal” state of a given tissue; resulting changes occurring due to an increased signaling and consequential accumulation of an inflammatory state; sequentially followed by further changes in tissue transitioning through increasingly metabolically active tissue with increased metabolic activity and demands for increased regional blood flow, until arriving at a tissue state where the expected controls and functionality of tissue no longer exist; what has classically been defined as “cancer.” Implicit in this understanding is the appreciation that this continuum across transitional states reflects the interrelationship between these various “Health-Spectrum” states, which
a) are not defined by some arbitrary absolute cutoffs between tissue states,
b) demonstrate the ability of tissues to transition in either direction towards “normalization” or towards “cancer” and
c) allow for the absolute measurement of the affect of treatment upon any of these tissue states across the “Health-Spectrum” providing the ability to direct care at the “patient-specific” level, improving outcomes across these transitional states; saving time, money and most importantly lives.

Figure 2: Sequential follow-up of a woman’s primary breast cancer.
Breast Enhanced Scintigraphy Test (B.E.S.T.©℗) Imaging demonstrated a primary cancer in the left breast of a woman following referral by her primary care physician. She underwent initial treatment followed by a follow-up B.E.S.T.©℗ Imaging study, which showed recurrence of her cancer with a measurement of 294. She underwent further treatment and monitoring, which showed serial improvements. The final B.E.S.T.©℗ Imaging study revealed no evidence of breast cancer with a value of 149.

While there was no reason to expect such a rapid recurrence of breast cancer following the first mastectomy, chemotherapy and radiation therapy, fortunately the ability to quantitatively measure and look for recurrence of Breast Cancer using B.E.S.T.©℗ Imaging made it possible to find the cancer early in its recurrence. Clinicians now [1-9] have the ability to quantitatively measure the patientspecific impact of treatment upon Breast Cancer, allowing them the opportunity to provide better outcomes, be it through inter alia diet and lifestyle changes, medical management, hormonal, immunotherapy, radiation therapy or surgical treatments and physicians will now be held accountable for quantitative clinical decision making given the availability of B.E.S.T.©℗ Imaging to measure where the patient is on the “Health-Spectrum” and their treatment response be that to cancer or transitional changes in tissue which are a prelude to cancer.
In our upcoming published studies, we will continue to review the quantitative measurements made to show the outcomes of hormonal therapy, smoking and other treatments not only in Oncology patients but Cardiac patients as well. We will also be discussing cases which reveal B.E.S.T.©℗ Imaging’s ability to find secondary cancers being inhibited by the larger primary cancers.


