Impact Factor : 0.548
- NLM ID: 101723284
- OCoLC: 999826537
- LCCN: 2017202541
Jinxiang Xi1* and Xiuhua April Si2
Received: November 17, 2018; Published: November 26, 2018
*Corresponding author: Jinxiang Xi, Department of Biomedical Engineering, USA
DOI: 10.26717/BJSTR.2018.11.002097
Previous studies indicated that the patterns of the exhaled aerosol distributions, even though seemingly chaotic, are indeed unique with respect to the airway geometry. These patterns will differ whenever there is a change to the airway geometry. It is hypothesized that each lung structure has a unique Aerosol Fingerprint (AFP). As such, any difference from the normal AFP indicates an anomaly in the lung structure. However, these exhaled aerosol profiles exhibit highly complex patterns and should be quantified as feature vectors before they can be used for classification. This paper reviews the feature extraction algorithms to characterize the aerosol fingerprints from different airway geometries. These include local deposition fraction, fractal dimension, multifractal dimension, spatial-temporal dynamics and unsupervised feature extraction (deep learning).
Keywords: Lung Diagnosis; Obstructive Lung Diseases; Breath Test; Exhaled Aerosol Fingerprint
Symptomless development of lung cancer leads to high mortality rates of lung cancer patients. It is expected that the mortality rate can be dramatically reduced if cancer can be detected and treated at its early stage. However, effective methods for early cancer detection are lacking despite years of research [1]. Bronchoscope and percutaneous lung needle biopsy have the capacity of detecting and diagnosing lung cancers but are not used for of screening because of their invasive nature. In recent years, Low-Dose (LD) CT scanning gain popularity in screening lung cancers in senior populations who are or have been heavy smokers and are considered to have a high lung cancer risk. However, the reliability and cost-to-benefit ratio still need to be improved. A large-scale two-year trial (2002-2004) with 53,454 participants demonstrated that LDCT could increase the survival rate of lung cancer by 20% [2]. Moreover, LDCT was known to have a high false positive rate, overdiagnosis, and potential risk from long-term radiation exposure [2].
Serval studies have investigated the feasibility of employing aerosols to diagnose respiratory diseases. One example is the method of Aerosol Bolus Dispersion (ABD) [3,4], which measures the temporal concentrations of exhaled aerosols to gauge the lung health. It is noted that the ABD method provides no extra information in comparison to current lung function tests [4]. Recently, we proposed an exhalation breath test that is promising to detect lung diseases as well as their locations. This method was based on persistent exhaled aerosol patterns from a given lung geometry [5-9]. In other words, each lung has a unique exhaled aerosol distribution, which is called the signature “Aerosol Fingerprint (AFP)”, to differentiate from the “gas fingerprint” used in VOC-based breath tests [10]. It is hypothesized that a deviation from the normal AFP pattern will be indicative of lung geometry remodeling or tumorigenesis.
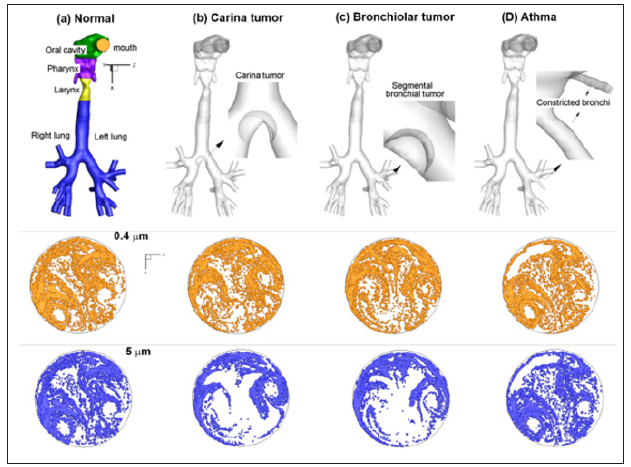
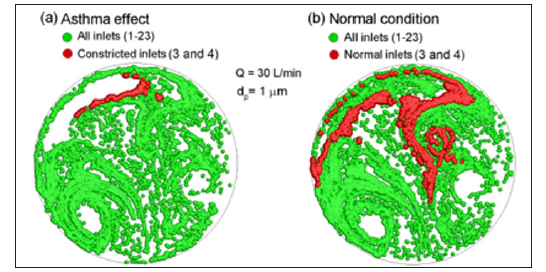
The AFP pattern, which resembles an actual human fingerprint, collectively result from the aerosol motions through the lungs. In order to predict lung structure remodeling via exhaled aerosol breath tests, the AFPs should be adequately sensitive to variations in lung geometries. Figure 1 shows the expiratory aerosol patterns at the mouth in the four models that represent one healthy and three diseased airways (carinal tumor, left bronchial tumor, and asthma) [9]. The aerosol sizes were 0.4 μm and 5 μm under a steady breathing condition of 30 L/min. There are large differences in particle distributions between health and disease, as well as among diseases with different sites and level of severity. As the particle size increases from 0.4 μm to 5 μm, such differences become even more pronounced. Figure 2a shows the exhaled aerosol distributions (red) when aerosols were released only from the two constricted bronchi (red particles) of Model D and were superimposed onto the asthma case [9]. The red particles had a clear pattern and could be viewed as a biomarker for that diseased condition. In this sense, these tagged trace particles can be employed to detect the position of the disease and estimate the severity of structural remolding. To compare, the superimposed plot in the normal case (Model A) was shown in Figure 2b, with red particles released from corresponding bronchioles.
Although the particle profiles in Figures 1 & 2 are visually distinctive between models, particle overlapping may prevent an accurate quantification of particle concentration. Figure 3 displays the ratio of local aerosol accumulations over the averaged concentration, with blue representing zero and red representing high concentrations [5]. For a given airway model, the exhaled aerosol profile and local relative concentrations appear similar. However, the concentration map can readily pinpoint the sites of peak aerosol localization (red color), which should also be the most susceptible sites for tumorigenesis.
Figure 1: Healthy and diseased airway models and their exhaled aerosol fingerprints: (a) Normal condition, (b) Carina tumor, (c) Left bronchial tumor and (d) Asthma.

Figure 2: Exhaled aerosol profiles at the mouth for airways with asthma in comparison to normal condition.

Figure 3: Local concentration: (a) Normal condition, (b) Carina tumor, (c) Left bronchial tumor and (d) Asthma.

Fractal dimension quantifies the complexity of an image by measuring the space occupied by the particles, while the multifractal spectrum quantifies both the heterogeneity (space vs. particles) and complexity [11-18], as shown in Figure 4 [5]. Human lungs resemble an upside-down tree and can be considered as a fractal structure [19-26] with a fractal dimension of approximately 1.57 [27,28]. Considering that aerosols constantly fill and empty the lung trees, it is expected that exhaled particles also show fractal features and therefore, are suitable for fractal analyses. In contrast to the fractal dimension, a multifractal spectrum captures more features associated with the space-filling nature of the lungs at varying scales and is more suitable to describe the expiratory AFPs [29].
Figure 4: Fractal dimension and multifractal spectrum: (a) Box-counting method, (b) Fractal dimension and (c) Multifractal spectrum.

Instead of using FD (global or local) of the image which may suffer information loss [11], aerosol patterns formed by exhaled airflows, together with their temporal dynamic processes, should better capture the progression of airway structural remodeling in deep lungs. To avoid possible information loss, features, or eigenmodes, should be extracted directly from the images (i.e., pixel values). By projecting the aerosol images onto low-dimensional eigenmodes, the underlying physics (fluid-particle transport equations) can be approximated by a dynamical system with fewer degrees of freedom, which can be used for the detection, monitoring, and when combined with targeted pulmonary drug delivery, treatment of the lung diseases.
Great advances were made in extracting temporal-spatial features from numerical simulations and experimental visualizations. Proper Orthogonal Decomposition (POD) [12], Principal Component Analysis (PCA) [13], global eigenmodes [14], balanced modes [15] and Dynamic Mode Decomposition (DMD) [16] have given useful insights on the dynamics of fluid flows. POD decomposes the dynamics into orthogonal modes. It provides a lowrank basis and a hierarchy of features that are most predominant in the system. In recent years, DMD has attracted attention in various fields as an approach for the above purpose that works without explicit knowledge of the governing equations. Although DMD is a data-driven decomposition technique like POD and PCA, it generates modes that are directly linked with the transient dynamics of the data. In this sense, DMD is inherently suitable for studying time-evolution observables that evolve on an attractor (i.e., healthy lungs) with transient oscillators (i.e., diseases of varying severities). Besides analysis of fluid flow and vortex dynamics, successful applications of DMD and its variants have been made in power systems [17], robotic control [18], neuroscience [19], image processing [20], epidemiology [21], financial market [22], and weather broadcasting [23].
In recent years, deep learning algorithms have become the mainstream with increasing evidence of superiority over traditional machine learning algorithms, such as SVM and random forest, in image classification [24,25]. One particularly appealing feature in deep learning is that feature extraction and classification can be executed at the same time. The ability of Convolutional Neural Network (CNN) model to learn rich features at multiple levels has led to a variety of successful application in medical image analysis [26]. On the other hand, unique challenges present in applying CNN models. It generally requires large datasets for effective model training, while quality medical images are often limited. For instance, a database of 405 images was adequate in SVM and random forest classifications but appeared insufficient for a meaningful deep learning test. Evaluations of the performance of CNN models in analyzing exhaled aerosol images are needed when more image data become available.
The use of multiple feature extraction algorithms is becoming increasingly pertinent when categorizing complex images. Considering the exhaled aerosol fingerprints, the most distinctive deviations presumably arise from the diseased sites, where perturbation in airflow is also the strongest. In this study, we reviewed different methods to quantify the exhaled aerosol images in order to distinguish between healthy and diseased lung models, including concentration disparity, fractal dimension, multifractal analysis, and temporal features. These methods collectively formed a feature vector for the AFP and were promising to disclose the hidden order veiled by the seemingly chaotic aerosol distributions. Future studies that used unsupervised feature extractions, such as deep learning, are needed.


