Impact Factor : 0.548
- NLM ID: 101723284
- OCoLC: 999826537
- LCCN: 2017202541
Ghasem Rezanejad Bardajee*, Alireza Adl and Samaneh Sadat Hosseini
Received: November 08, 2018; Published: November 26, 2018
*Corresponding author: Ghasem Rezanejad Bardajee, Department of Chemistry, Tehran, Iran
DOI: 10.26717/BJSTR.2018.11.002086
This project aims to improve the efficiency of solar cells doped by CdS quantum dot and Ho+3 ion. Successive Ionic Layer Absorption and Reaction (SILAR) and Chemical Bath Deposition method (CBD), were used to deposit a CdS/CdSe layer on TiO2 film. According to J-V diagram, it is concluded that adding holmium ions (Ho3+) will enhance the efficiency of quantum dot sensitized solar cells up to 2.53%.
Keywords: Solar Cells; Quantum Dots; Holmium
Abbrevations: QD: Quantum Dots; SILAR: Successive Ionic Layer Absorption and Reaction; CBD: Chemical Bath Deposition Method; MEG: Multiple Excitation Generation; EIS: Electrochemical Impedance Spectroscopy; XRD: X-ray Diffraction; FTO: Fluorine Doped Tin Oxide
Nowadays, energy issues have been challenged as the most important human necessities. In the meantime solar or photovoltaic cells have been attended in order to transferring of solar energy to electricity in which solar energy has been used as a clean, unexpansive and available energy source [1-3]. Solar cells are divided into different types such as dye sensitized, silicone solar cells, molecular, GaAs and quantum dots (QD) [4, 5]. Recently, QD solar cells have attracted great attention because of their low cost, high surface area and more quantum yield [6-8]. In QDs, Multiple excitation generation properties (MEG) cause a few electron transfers from valance band to conductive band by incident of just one photon which increases absorption in solar cell and finely leads to high performance of solar cell [9]. Some QDs are used in preparation of solar cells such as: InAs, CdTe, PbS, InPO4, CdS, CdSe, etc. Using CdS and CdSe simultaneously has a good effect on emission of light because of increasing of band gap via a synergic effect [10-12]. There are some methods for deposition of QDs onto TiO2 like chemical bath deposition (CBD), SILAR and hot injection growth method. In cathode electrode, Pt or Cu2S is used which because of high cost of Pt using the Cu2S is more popular and common [13,14]. In order to increase electron injection from QD to TiO2, coating a layer of ZnS has a great effect via omitting surface-nods made on TiO2 that this layer improves quality and efficiency of solar cells. In many inves tigations, I-/I3- solution is used as electrolyte. However, because of corrosion of solar cells by this redox complex solution, polysulfide solution S2-/Sx2- is used as a substitute electrolyte.
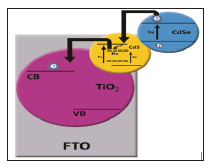
A new method for improving the solar cell performance is introducing some metals such as Mn, Ni, Ag, Cd etc to cells [15-18]. In this work existence of Ho3+ ion in QDSCS cells was used for the first time in order to improvement in photovoltaic performance of QDSCS (Figure 1).
Figure 1: Schematic of the FTO TiO2/CdS: Ho/CdSe electronic structure. Direct arrows indicate the electron hole photogeneration. Dashed arrow indicates the electron transfer from CdS CB to the midgap electronic states and direct curved arrows are related to electron transfer from CdSe to CdS QDs and from CdS trap states to TiO2 CB.

Apparatus: SEM-EDX model Irost was applied for. Solar simulator model SIM800. Bath-Ultrasonic model (Sonica). Water purification system model No. F3JN94307E. Electrochemical Impedance Spectroscopy (EIS) was performed on IM6ex Electrochemical Workstation (ZAHNER) over a frequency range of (1×10⁵–1×10⁻¹) Hz with 10 mV ac amplitude under forward bias of (-0.6) V in the dark. Formation of cells by ion-doped quantum points CdS holmium were analyzed by means of a Philips X-ray diffraction (XRD) equipfped. The XRD data were collected in the scale of 2Ɵ = 10–80˚ a scanning speed of 3˚ min-1.
Materials: Cadmium nitrate tetrahydrate (Cd(NO3)2.4H2O, Alfa Aesar, 98.5%), Sodium sulfide nonahydrate (Na2S.9H2O, aladdin, ≥98.0%), Nitriloacetic acid (N(CH2COO)3, sigmaaldrich, ≥99.0%), Copper(II) sulfate pentahydrate (CuSO4.5H2O, sigmaaldrich, 99.99%), Holmium (III) hexahydrate (HoCl3.6H2O, sigmaaldrich, 99.9%), Sodium hydroxide (NaOH, Merck, 99.0%), Sodium sulphite (Na2SO3, sigmaaldrich, ≥98.0%), Zinc acetate (Zn (CH3COO)2.2H2O, Merck, 99.5%), Selenium powder (Se, Acros, 99.5%), Copper (II) nitrate (Cu(NO3)2.3H2O) and Sulphur powder (S, VWR Chemicals, 99.5%), Fluorine doped tin oxide (FTO) glass, TiO2 nanoparticle. All reagents and solvents were purchased from commercial sources and were used without further purification.
Preparation of CdS/CdSe/Ho3+ Solar Cells: First, we deposited a thin film of TiO2 on FTO transparent conductive layer According to doctor blade method. Secondly, the electrode was heated up to 125 °C for 6 minutes and then cool down to 25 °C. This process was repeated until a desired thickness was achieved. To prepare X electrode, TiO2 photoanodes were placed in a 10mL of cadmium nitrate solution (1.17g in water) for 5 minutes and then were washed with distilled water. Then, TiO2 photoanodes were immersed in a 10mL solution containing 2.14g sodium sulfide for 5 minutes. This cycle was repeated for three times. The resulting electrode was used as the control electrode. To prepare Y photoanode, plunge a photoanode was immersed in a 10mL of solution with 1.17g of dissolved cadmium nitrate and 0.284g Ho3+ for 5 minutes, and then the sample was dried. The sample is added to the solution of 2.4g of Na2S per 10mL H2O. This cycle was repeated for 3 times. The electrodes were dried at room temperature. Based on reported synthesis by Samadpour et al. [19]. In order to prepare CdSe, 1.26g of sodium sulfite and 0.315g of selenium powder was refluxed in 50mL of distilled water under nitrogen gas for 5 hours at a temperature of 80-85 °C at 400-500rpm.
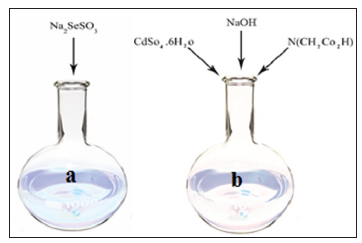
The result is the formation of sodium selenosulphate (Solution of a). According to Figure 2, different solutions with different volumes were prepared. 1.2g of cadmium sulphate were dissolved in 50mL of distilled water. Separately, 1.40g of sodium hydroxide was dissolved in 10mm of distilled water. Moreover, 1.65g nitriloacetic acid was dissolved in 40mL of distilled water in a round-bottom flask and then three samples were mixed and finally added to the b solution (Figure 2). The final products of a and b was placed in a beaker of 200mL. The synthesized electrodes were kept away from sunlight for 15 to 18 hours at 2 to 3 °C, Ultimatelly, the electrodes were washed with distilled water (Figure 3). The electrode immersed in a solution consist of 0.219g of zinc acetate, 10mL of distilled water and 0.24g sodium sulfide Na2S. This cycle was repeated three times. FTO glass was immersed in an aqueous solution of 1.2g copper nitrate in 10mL of distilled water for 30 seconds and then was washed with ethanol. This cycle was repeated for 5 times. Finally a black thin layer of CuS appeared on FTO. Three aqueous solutions containing 1.2g Na2S, 0.16g S, 0.2g NaOH were prepared separately and 5mL of each solution was mixed in a round-bottom flask for 90 minutes at the room temperature.
Figure 2: Preparation of a solution (sodium sulfite+ selenium powder) and b solution (cadmium sulphate+ sodium hydroxide+ nitriloacetic acid).

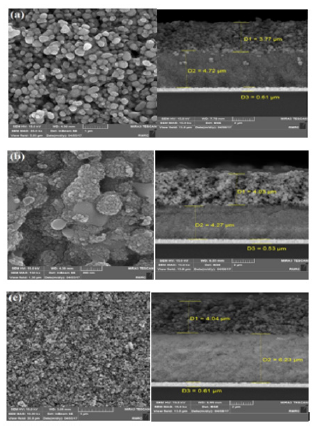
To determine the particle sizes in anodic sub-layer coated by a layer of TiO2 (20-40nm) and to measure the thikness of the layer’s SEM-EDX analysis was performed. (Figure 4a) shows SEM image of TiO2 layers (20 to 400nm) that indicates a porous surface and uniform particle size. The diameters of first and second layers are estimated to be 3.77μm (TiO2-400nm) and 4.72μm (TiO2-200 nm) respectively. SEM images in Figure 4b shows that surface morphology has been changed in the presence of CdS/CdSe quantum dotes and shiny dots with 500nm size is appeared that can be related to CdS/CdSe quantum dotes. The diameter of first and second layers have changed to 4.03μm and 4.27μm, respectively. Finally, the thicknesses of TiO2 layers are shown to be 4.04μm and 6.32μm for first and second layers in Figure 4c, respectively.
Figure 4: SEM image.
Note:
a) TiO2 film (20 to 400 nm) and cross-sectional view,
b) TiO2 film CdS/CdSe QDs and cross-sectional view,
andc) TiO2 film CdS/CdSe/Ho3+ and cross-sectional view.

EDX analysis determined the amount of element such as Se=8.82, S=2.4 and Cd=14.57. MAP cleared that Cd spread uniformly on the surface of TiO2. Amount of Ho+3 existent (0.46 μm) confirms the SEM images even though it’s less than amount of Cd (Figure 5).
Undoped and Ho3+ doped samples with different concentrations (50, 75 and 150mM) were radiated by solar simulator (AM 1.5). Results are shown in Table 1. Results demonstrate that Ho3+ doped samples show higher efficiency than undoped samples, consequently the experiment in 150mM concentration has been repeated for two times and concluded that the better efficiency was related to Ho3+ 150mM concentration (Figures 6 & 7) and (Table 2).
Figure 6:(a) Related to the optimum Ho3+ concentration in comparison with blank. (b) related to the optimum prepared cells efficiency in comparison with blank.

Figure 7 shows the electrochemical impedance spectra (EIS) of the CdS/CdSe and CdS/CdSe/Ho. Nyquist curves obtained from EIS measurements were fitted with equivalent circuit model as shown in Figure 7. Recombination resistance (Rre) of CdS/CdSe and CdS/ CdSe/Ho samples are 263.30Ω and 628.23Ω, respectively, which means the electrons and holes recombination in the Ho-doped CdS/CdSe solar cells are less than that of CdS devices. Thus, the less charge recombination can be observed in CdS/CdSe/Ho.
Doping of few amounts of Ho3+ ions improves electronic and photo-physical properties of quantum dots and creates an electronic level at the middle gap area. This electronic state changes charge separation and reduces electron-hole recombination. Changing in the type and amount of impurity causes different electronic and photonic properties of nanocrystal semiconductors. In this work, quantum dot solar cells were fabricated, and some investigations were performed on their structure and it was indicated that quantum yield increased from 0.87% to 2.53% by adding Ho3+ metal ion. Using Ho3+ for surface modification leads to increase in yield of solar cells which it can be concluded that adding lanthanides ions increase the performance of quantum dots because of electron transportation properties and these cases may increase quantum yield of nanoparticle solar cells.
We are grateful to the PNU for funding this work.


