info@biomedres.us
+1 (502) 904-2126
One Westbrook Corporate Center, Suite 300, Westchester, IL 60154, USA
Site Map
Received: August 30, 2018; Published: September 06, 2018;
*Corresponding author: Ali S Saad, Department of Biomedical Technology, College of Applied Medical Sciences, King Saud University, P. O. Box 10219, Riyadh 11433, Saudi Arabia
DOI: 10.26717/BJSTR.2018.08.001702
Patients with long term dry eye (DE) could suffer cornea damage. To date, there is no universal diagnostic test to detect eye dryness. Recently, an automated diagnostic method of DE using thermographic images provided a good binary classification between normal and DE subjects. The present work focuses on the automatic diagnosis of DE patients using tear ferning (TF) images. The TF images for 100 subjects were used to classify their degree of dryness automatically (without human interaction) using a five-point grading scale. First, from each TF image a vector characteristic (VC) was computed to represent each patient during the automatic classification. Then, it was compared to the VC references representing the five points grading scale. Next, each subject's TF image was assigned to the closest reference. The classification of each patient's degree of dryness using the vector characteristic is based on a decision tree approach using "See5”: tools for data mining that generates decision trees for classification purpose. The fully automatic classification (diagnosis) provides a promising result compared to the manual classification by two experts. It was found that 81% of the automatic classification perfectly matched the manual ones. 12% of the automatic grades were misclassified to the next grade (i.e. one grade difference between the automatic and manual grading). Only 7% were completely misclassified. Future work on the VC and the algorithm of classification using synthetic TF images could further improve the automatic classification of dry eye patients.
The healthy tear film is important to keep the eye lubricated, healthy and optically [1]. The main components in tears are electrolytes (e.g. cations such as Na+ and K+), water, proteins (e.g. lysozyme and lactoferrin), lipids, mucins and others [2]. Tear film contains three layers, aqueous, lipid and mucin, and its stability affects vision quality and eye health [3]. Dry eye (DE) leads to a disturbance in both tear volume and quality because of the changes in the ocular surface [4]. The most common dry eye symptoms include itchiness, grittiness, blurriness and photophobia [5]. Diagnosis of dry eye is very challenging since multiple tests need to be used to detect the dryness [6,7]. Various tests can be used to assess the ocular tear film and tear quality and quantity, such as the tear ferning (TF) test [8-10], tear osmolarity measurement [11-13], tear break-up time [14-15], tear meniscus height [16], and Schirmer's test [17-18].
TF test is one of the most reliable and repeatable tests to measure the quality of the tears during the day [19-21]. Tears, when dried, produce ferns that can be seen using a light microscope. Such ferns represent the interactions between tears components, such as proteins, large molecules and electrolytes [22]. TF images are very characteristics and specific to the state of the tears. Rolando classifies TF images into four categories in which normal eyes represent by ferns of types I and II and dry eyes represent by types III and IV [9]. Type I pattern shows ferns that are highly packed, while, type IV shows poor or no patterns at all [9]. Such grading scale has good repeatability and utility [23-24]. But, it is difficult to differentiate between TF of types I and II. A new TF grading scale that consists of five grades, 0, 1, 2, 3 and 4 has been recently developed [8] that can easily differentiate between different types of ferns.
Recently, we reported the first step towards the automatic diagnosis of dry eye, based on the five-point grading scale, using computer-based image analysis of tears ferning features [25]. Its objective was to characterize each reference image by a vector of characteristics. It proposed 5 vectors (of 8 components each), characteristic of each reference image and significantly different from the others. The selection of characteristics of the images was based on 3 different spaces known as texture analysis, power frequency and linear features. Noise reduction and contrast enhancement were performed for each image as a preprocessing step. A scale that has the same order of magnitude, in one characteristic vector and weights that assigned to each component was chosen according to the importance of each component. The current work is directed towards the establishment of a computer aided automatic classification of DE using the vector characteristic of TF images. Recently an automated identification of normal and dry eye using infrared thermography images has been developed [26], which provides only 2 classes of grading as normal and DE. In our proposed method 5 classes of DE are provided.
Ethical approval was obtained from the College of Applied Medical Sciences Ethics Committee, King Saud University. The TF images for 100 subjects (20-26 years old) were used as a sample to test the proposed computer-based classification method. A tear sample (1μl) was collected from the lower meniscus from either the right or left eye using a glass capillary tube (10μl, Sigma-Aldrich Chemical Company, UK). The tear was dried on a glass slide at room temperature (23°C; humidity <45%). The tear ferns formed were seen using a digital microscope (Olympus DP72, Tokyo, Japan; 10* magnification) and were graded by two experts using the five-point TF grading scale [8]. TF grades higher than 2 were considered as a dry eye [8]. The processing of TF images was carried out using MATLAB R2016a Image Processing Toolbox (MathWorks Company, Natick, Massachusetts 01760 USA) and "See5" tools for the data mining (Data Mining Tools See5 and C5.0).
A preprocessing step is first performed to filter the images, enhance their contrast and normalize the gray levels by a histogram equalization method. Then, a vector characteristic is extracted from each image to represent it in the classification process. The vector characteristic used in this project combines features from texture analysis, linear structure analysis in time domain and power spectrum analysis in Fourie space, developed in detail earlier [25]. Co-occurrence matrix-based parameters [26,27], including angular second moment, contrast, correlation, entropy. The vector characteristic is represented in Eq. (1) [25].
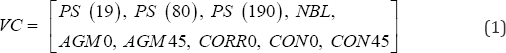
Where, PS(19) is the power spectrum at the low frequency (19Hz) in the radial plot, PS(80) is the power spectrum at the medium frequency (80Hz) in the radial plot, PS(190) is the power spectrum at the high frequency at pixel 190 in the radial plot, NBL is the number of line detected in the image, AGM0 is the angular moment at direction 0°, AGM45 is the angular moment at direction 45°, C0RR0 is the correlation at direction 0°, C0N0 is the contrast at direction 0° and CON45 is the contrast at direction 45°. Analysis of feature relevance was made among all the textural features, and only 4 statistical measures out of the 14 co-occurrence features defined by Haralick has been proven to be relevant to the classification TF images [25]. The vector characteristic was split into three parts to provide different weights for components obtained from different sources [Eq. (2)].

Where, VCPS is the first three components related to the normalized power spectrum, VCL includes the normalized number of lines and VCTA includes the last five components related to the texture analysis. α, β and γare weights that were given to each of the three sub-vectors to balance their contributions. After the experimental testing, the optimal values ofthe weights were α = 35%, β = 15% and γ= 50%. The details about the vector characteristics development and normalization were previously discussed [25]. As described before, the classification is based on a combination of several types of characteristics (co-occurrence matrix-based features, power spectrum features and linear components) in the images. Five VCs were calculated first for the reference TF images of the five-point grading scale [8]. Those VCs are considered as references for each of the five points grading scale. For each the 100 TF images a VC was first constructed than compared to the 5 references VCs using cluster analysis and decision tree methods.
The classification of subjects' TF images, using the proposed vector characteristic was based on a decision tree approach and K-mean classifier. The use of decision tree approach for the classification was chosen for several reasons. The tree can be easily accessible and interpreted and it is computationally efficient. Also, it provides a good classification of satellite images having analogous features to TF images [28-30]. The data mining tools See5/C5 are sophisticated for discovering patterns that delineate categories, assembling them into classifiers, and using them to make predictions. See5 generates decision trees and allow different weight to VC components. It was used to classify and automatically grade the TF images, a comparison with K-mean classifier using Euclidian distance has been established on the 100 TF images.
Table 1: The automatic grading vs the manual grading (N = 100)a-c

One hundred TF images were used in this study (Figures 1 & 2) show TF images for some normal and dry eye subjects, respectively. Five characteristics vectors were constructed as references of the 5 grades. Each vector represents one grade of the five-point grading scale [8]. Each new TF image was entered to the software. First, a vector characteristic was constructed to each TF image of the 100 test images used in our experiment. Then, a decision tree classifier procedure was run using the by See5 software. At the end of the execution, each TF image was assigned automatically to one of the five grades (0-4). To check the accuracy of the result, two experts established a manual classification of the 100 TF images, and each image was assigned manually to one of the five grades (0-4). The results of the automatic and manual grading of TF images are represented in Table 1.
Figure 1: TF images for some normal eye subjects.

Figure 2: TF images for some dry eye subjects.

The percentage of the perfect matching between the manual and the automatic grading was 81%. The mismatching by one grade difference between the automatic and the manual grading was 12%. The mismatching by at least two grades differences was found to be 7% (Table 1). The K-mean classifier was excluded due to the poor results obtained (only 61% match the manual classification).
a) The dark grey boxes represent the automatic classification that exactly match the manual ones.
b) The light grey boxes represent the misclassification by one grade difference between the automatic and the manual grading.
c) The white boxes represent a complete misclassification in which the difference between the automatic and manual grading was a least two grades difference.
The natural tear ferning images are not limited to the 5-grade point, most TF images are located between grades and could be closer to one grade than the other. A real classification of TF images could be finer than the 5 points Masmali grading scale, but here we used a normal approximation ofthe TF images. For example, ifthe TF image is between grade 2 and 3 and it has a real grading of 2.6 it was assigned to grade 3. Clearly, a high degree of classification overlap (12%) was observed in the case of neighbor grades (differences by one grade). However, the proposed vector characteristic combined with the decision tree method of classification cannot perfectly distinguish between the neighbor classes. This is due to two issues, the first one is the TF images used are for real patient tear (not synthetic) and the grading is not exactly an integer number from 0 to 4 but, could be a real number, for example 1.2. The second issue is related to the vector characteristic itself since it has a limited capacity to perfectly distinguish between very similar TF images. Future work is still needed to improve the accuracy of the classification. Further development of the VC by introducing more features is also needed. Moreover, the development of database of synthetic tears TF images with known grading is primordial for calibrating the classification result.
The proposed computer based automatic classification for dry eye using tear ferning images is the first of its kind up-to- date, it provides a pretty good classification result, an overall accuracy of 81% without any human intervention. The result was compared to the manual grading of two experts. The percentage of misclassification between the manual and automatic grades was found to be 7% (at least two grades difference) and 12% (one grade difference). An improvement of the vector characteristic is still needed to increase the accuracy of the automatic grading of TF images. Future research should also involve a database of synthetic tears TF grades, to be used in the automatic DE classification.
The authors extend their appreciation to the College of Applied Medical Sciences Research Centre and the Deanship of Scientific Research at King Saud University for funding this research, and to thank Dr. Gamal El-Hiti for beneficial comments and fruitful discussions.


