info@biomedres.us
+1 (502) 904-2126
One Westbrook Corporate Center, Suite 300, Westchester, IL 60154, USA
Site Map
Received: August 23, 2018; Published: September 06, 2018;
*Corresponding author: VK Khanna, Senior Professor, Plant Biotechnology, School of Crop Improvement, College of Post Graduate Studies, Central Agricultural University, Meghalaya
DOI: 10.26717/BJSTR.2018.08.001700
Identification of superior parents has been always pre-requisite in the hybridization for the crop improvement. The present work was taken up to study the crossability behaviour of various accessions of pea on the basis of their pod set and the genetic diversity was studied using RAPD markers. There was non-significant correlation between pod set and viability of pollen. Pollen germination and pollen tube growth increased from 8 hour to 24 hour and these were positively related with the pod set. A total of 45 RAPD primers were selected to assess genetic diversity of 40 accessions of pea. Scoring of 45 primers gave 345 bands out of which 306 bands were found to be polymorphic. The PIC value ranged from 0.73 to 0.99, with an average of 0.86 based upon four primers (OPC 11, GM 100, V 03 and N 20) which were found to be highly informative. Euclidean distance was used to construct cluster dendrogram based on Ward's D method Ward [1]. Dendrogram shows that Makochabi 1 and Debgiri were more distinct then Bankim and Pant-5. S-10 and imported varieties were found to be very less distinct from others. The knowledge of genetic diversity of pea accession is highly essential for pea breeders to produce new varieties or hybrids with higher yield and better quality.
Pulses are important food crops that can play a major role in addressing future global food security and environmental challenges, as well as contributing to healthy diets. In recognition of the contributions of pulses to human well-being and for the healthy environment, the UN general assembly in the 68th session of United Nations (UN, 2013) declared 2016 as the International year of pulses. Legumes are economically significant crops and rich source of nourishing diet for growing population, feed for livestock, and raw materials for industries. Dry plants are used as fuel as well as cattle feed. Pea contains all the essential amino acids such as lysine, methionine, tryptophan, threonine, valine, phenylalanine, leucine and isoleucine (Sutcliffe and Pate, Matthews and Arthur. Nutritional value of pea for raw and dried pulses as per 100 g edible portion on fresh weight basis are: energy 308 kcal, protein 18.44 g, fat 1.4 g, fibre 26 g, carbohydrate 42.4 g, iron 3.5 mg, magnesium 116 mg, phosphorus 295 mg, potassium 1010 mg, zinc 2.39 g, and vitamin B9/folate 138 ng/100 g (FAO, 2016). In India, the area and production of peas was 459,000 ha and 4329,000 tonnes (201415) respectively, which was 2.5% of total vegetable production (Horticulture Statistics at a Glance, 2015).
For an effective breeding programme, information concerning the extent and nature of genetic diversity within a crop species is essential. It is particularly useful for characterizing individual accession and cultivar and as a general guide in the selection of the parents for the hybridization. Molecular markers have enormous potential to explore genetic diversity by detecting polymorphisms to improve the efficiency and precision of conventional plant breeding. The purpose of this study was also to evaluate the genetic diversity within a diverse collection of pea (Pisum sativum) accessions. The RAPD technique has advantages over isozyme and other DNA fingerprinting technologies in the speed of data- acquisition possible, the low cost of reactions, the small amounts of plant material required and the ability to perform analyses without the need for prior sequencing of the genome Huff [2].
The present investigation was carried at the Research Farm of the College and the molecular and cytogenetic studies were performed in the laboratory of the School of Crop Improvement in the College of Post Graduate Studies, CAU, Barapani, Meghalaya, India in the year of2016-2017. A total of 40 different pea accessions were used in the experiment out of which 22 accessions of pea were kindly provided by Dr. Major Singh, Project Coordinator and the Principal Scientist, Indian Institute of Vegetable Research, Varanasi, and the remaining 18 pea varieties were collected from the different Northern and North Eastern Parts of India (Table 1). Seeds were sown in a staggered manner with three different dates of sowing.
Table 1: List of pea accessions.

Crosses were made between seven different randomly selected accessions which were grown in pots as well in the field, respectively A total of 28 crosses (Table 2) were made between seven parents from whom suitable flowers were selected for emasculation. Emasculation and pollination were carried out on the same day. In order to avoid unnecessary pollination by the undesirable pollen, these pollinated flowers were bagged with a butter paper bag and stapled securely. Pollination was performed from December to January 2017 and care was taken to avoid any damage to the stigma. For each cross, thirty to thirty-five flowers were selected randomly. Three flowers each were used for pollen viability, pollen germination, pollen tube growth and pod set studies with three replications.
Table 2: List of crosses of randomly selected parents.

Genomic DNA was isolated from the young leaves of pea plant using modified CTAB method of Doyle and Doyle [3] and the molecular characterization was done using PCR based RAPD markers.
The data obtained from RAPD primers were subjected to generate Euclidean distance and cluster dendrogram was constructed based on Ward's D method Ward [4] by the help of R software and the PIC (Polymorphism Information Content) of markers is used to know the in-formative ness of markers. Markers with different (bands) alleles are highly polymorphic and tend to be highly informative.In-formativeness of marker can be quantitatively measured by a statistic called polymorphism information content, or PIC (Table 3). PIC is a modification of heterozygosity measure that subtracts from the heterozygosity of locus value an additional probability that an individual in a linkage analysis does not contribute information to the study Speer [5].
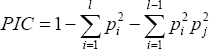
where,
Pi = Frequency for the ith allele among a total of l alleles.
Pi and Pj = Population frequency of the ith and jth allele.
Table 3: PCR master mixture contents.

Figure 1: Pollen tube growth in VRP- 318 X TS-10 after 24 hours of pollination (40 X).

In this study, seven random accessions were selected for the crossability studies. The pollen fertility of all the accessions under this study revealed that the maximum fertile stained pollen was recorded in Pusa pragati (98.78 ± 0.71) whereas the lowest percentage of fertile pollen was recorded in VRP- 07 (96.22 %) followed by VRP- 65 (96.78 ± 0.92) (Figure 1). However, the average percent of pollen fertility did not show too much difference among the accessions. There was very less variation in the size of pollen even though some abnormal pollen was also observed (Pusa pragati).
The data obtained from RAPD primers were subjected to generate Euclidean distance and cluster dendrogram was constructed based on Ward's D method Ward [6] by the help of R software and the PIC (Polymorphism Information Content) of markers is used to know the in-formativeness of markers. Markers with different (bands) alleles are highly polymorphic and tend to be highly informative. In-formativeness of marker can be quantitatively measured by a statistic called polymorphism information content, or PIC (Table 4). PIC is a modification of heterozygosity measure that subtracts from the heterozygosity of locus value an additional probability that an individual in a linkage analysis does not contribute information to the study Speer [7]
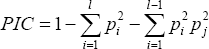
where,
Pi = Frequency for the ith allele among a total of l alleles.
Pi and P. = Population frequency of the ith and jth allele.
Table 4: Details on polymorphism obtained by RAPD markers with 40 genotypes and 44 primers.

After pollination, pollen grain sticks on the hairy stigma where it begins to germinate and produce a pollen tube and finally reaches the ovary through style. The length of pollen tube was measured (μm) at three different time intervals on selfing as well as in crosses. Pollen fall on the stigma of each individual flower was variable because the amount of pollen grain differs during the hand pollination and also due to irregularity in the pollen grain germination. Length of pollen tube was recorded after staining with 1% aniline blue stain. Pollen germination and the growth of pollen tubes are necessary for fertilization and seed formation in flowering plants Buyukkartal [8]. Studies of in vitro pollen germination and pollen tube growth are very useful for explaining the lack of fertility Pfahler [9]. Heat stress reduced percentage of pollen germination, pollen tube length, pod length, seed number per pod, and seed- ovule ratio Jaingetet During selfing the longest pollen tube was recorded after 24 hours of pollination in Pusa pragati (997.99 μm) and the shortest in VRP- 65 (802.61 μm) (Table 5). During crossing of different parents, the longest pollen tube after 24 hours of pollination were observed in TS- 10 X Pusa pragati (1154.51 μm) and the smallest in VRP- 03 X VRP- 65 (722.82 μm) (Table 6) and (Figure 2).
Figure 2: Abnormal pollen tubes of different crosses between accessions.

Table 5: Pollen germination at different time intervals and percentage pod set on selfing and in crosses.

Table 6: Pollen tube growth at different time intervals and percent pod set on selfing and in crosses.

There was some abnormal pollen shape observed in Pusa pragati (Figures 3 & 4) and abnormal pollen tube growth (Figure 5) in different crosses of VRP 07 X Azad P- 1, VRP- 03 X VRP- 07, VRP- 318 X VRP- 65, VRP- 03 X VRP- 318 and TS- 10 X VRP- 07. Pollen grain which showed more than one pollen tube coming out from the same germ pore or pollen tubes which grew in the wrong direction or those which had swollen tips or whose tips had burst or which got twisted were considered as abnormal and the percentage of abnormal pollen tubes was calculated as Wang [10] reported that lack of boron inhibited pollen tube elongation and caused morphological abnormalities, especially swelling of the tip regions of the pollen tubes. Similar findings were reported by Dickinson [11] and Yang [12].
Figure 3: Gel image showing RAPD profile obtained by OPA- 19 primer and OPB- 12. Lane 1-40 represents the genotypes (Genotype names are given in Table 1. L indicates 1 kb plus ladder).

Figure 4: Dendrogram generated using Ward�s D method showing relationship between 40 accessions of pea.

Figure 5: Pollen fertility percentage.

The correlation of different parameters like pollen germination and pollen tube growth showed non-significant relationship with pod set but they were found to be positively correlated (Table 7).
Table 7: Correlation studies in different characters in crosses of Pisum sativum.

Forty-five RAPD primers were selected to assess genetic diversity of 40 accessions of pea. A total of 345 bands were scored out of which 306 bands were found to be polymorphic (Figure 6).The data obtained from RAPD analysis were subjected to Eucledean distance to find out the relationship among the accessions. The value of Eucledean distance ranged from 4.37 (S-10 and Imported) to 10.96 (Pusa pragati and VRP- 21) with an average value of 8. Dendrogram generated using Ward's D method grouped the genotypes into two major clusters (Figure 7). The first cluster was divided into two sub clusters, I A and I B and the second cluster was divided into two sub clusters II A and II B. Sub cluster I A was further divided into 2 sub clusters which consisted of eight accessions.Makochabi 1 and Debgiri appear to be most distinct from all others in this cluster. Cluster I B was also divided into sub cluster I B I and I B II which consisted of nineteen accessions. VRP- 163 and VRP- 03 appear to be more distinct in this cluster.
Figure 6: Pollen grains of Pusa pragati.

Figure 7: Pollen tube growth in VRP- 03 X Pusa pragati after 24 hours of pollination (40 X).

Table 8: PCR reaction cycle steps.

Cluster II A, divided into two sub clusters, II A I and II A II, consists of six accessions. From these, Azad P- 1 and MS 1100 appear to be more distinct. II B cluster, which was further divided into two sub clusters, consisted of seven accessions, in which Pusa pragati and Bankim appear to be more distinct. PIC values ranged from 0.73 to 0.99, with an average of 0.86. Based on the PIC values four primers (OPC 11, GM 100, V 03 and N 20) were found to be highly informative (Table 8). The data obtained from RAPD primers were subjected to generate Euclidean distance (Table 8) and cluster dendrogram was constructed based on Ward's D method Ward [13]. The dendrogram (Figure 7) constructed based on Euclidean distance revealed two major clusters, Cluster I and Cluster II comprising of 27 and 13 accessions, respectively. The cultivars Makochabi 1 and Debgiri occupied more distinct place from that of Bankim and Pant-5. S-10 and Imported accessions were found to be very less distinct from others but similar to each other. Knowledge of genetic diversity of pea accession is highly essential for pea breeders to produce new varieties with higher yield and better quality. Determination of genetic diversity based on morphological characters becomes limited in pea cultivars. This necessitates the assessment of genetic diversity present in pea using the modern molecular approaches.
From all the crosses maximum pollen fertility was observed in Pusa Pragati (98.78%) and minimum was observed in VRP- 07 (96.22%). reduction of pollen fertility Higher temperature may reduce pollen fertility Porch and Jahn [14]. The maximum pod set, and pollen tube growth were obtained on selfing than in crossing. Nameirakpam and Khanna [15] reported that in Cowpea pollen fertility exhibited less significant correlation with fruit set and high significant correlaton was found in between the pollen germinability and pollen tube growth rate with the fruit set. Khanna [16] reported in rice that the pollen tube growth at 1 hour after pollination had a positive correlation with seed set. In general, selfing had more pollen germination and pollen tube growth as compared to inter-varietal crosses with respect to seed set. Rangkham and Khanna [17] reported in cowpea thatthere was a positive correlation between pollen tube growth and fruit set. There was a non-significant correlation between pollen tube growth and pod set. From all the 45 RAPD markers, PIC value ranged from 0.73 - 0.99. Four primers (OPC 11, GM 100, V 03 and N 20) were found to be highly informative.
The value of Euclidean distance ranged from 4.37 to 10.96 with an average of 8.22. Makochabi 1 and Debgiri were found to be more distinct from Bankim and Pant- 5 in the cluster dendrogram and the results were similar to those obtained by Ahmad [18]. Highly self- pollinating and cleistogamous nature of pea, limits development of new pea varieties by cross breeding so the knowledge of genetic diversity of pea accession is highly essential for pea breeders to produce new varieties with higher yield and better quality Van der Maesen [19]. Although only 40 pea accessions were studied, genetic variability estimated amidst accessions was high indicating that genetic diversity of pea germplasm is sufficient to create new favourable gene combinations. An effective germplasm assessment provides the scientific basis for selection of parent/ donors for recombination breeding or hybrid breeding, and to breed for specific agro-ecological conditions and situations Kumar [20]. Identification of genetic diversity based on morphological characters becomes limited in pea cultivars necessitating the assessment of genetic diversity present in pea using the molecular modern approaches Yang X [21].


