Impact Factor : 0.548
- NLM ID: 101723284
- OCoLC: 999826537
- LCCN: 2017202541
Otusanya MO*
Received: July 12, 2018; Published: July 30, 2018
*Corresponding author: Otusanya MO, Department of Crop protection, College of Plant Science and Crop production, Federal University of Agriculture Abeokuta, Nigeria
DOI: 10.26717/BJSTR.2018.07.001493
Three or more years fallow may not replenish enough for optimum quality of Dioscorea (food cultivars) tubers. This study indicated this because Calcium and Nitrogen of values 0.47cmol kg-1 and 0.2% respectively were still below the critical determined for optimum yam production (South West Nigeria) even after three years fallow followed by two consecutive years of calcium nitrate fertilization to Dioscorea on the field plot used in this study. The experiment was a 3 by 3 factorial, arranged in RCBD and 3 replicates. Ca (NO3)2 soil amendment at 0, 1, 2kg ha-1 of calcium was the main plot treatment applied at 3 MAP (months after planting) and one foliar spray only at the rates 0, 100 and 500mg l-1 Ca (NO3)2 applied at 5 MAP. Ca (NO3)2 soil amendment (1 and 2kg ha-1) and 100mg l-1 Ca (NO3)2 foliar spray all promoted more leaf phytoanticipins namely flavonoid, lignin and tannin over the control. Leaf minerals namely N, P, Fe and S increased in the soil amendment treatments over the control and N, P and Fe in turn correlated significantly with the three phytoanticipins with their antimicrobial activities.
The 2kg ha-1 x 0mg l-1, 0kg ha-1 x 100mg l-1 gave anthracnose severity score of 1 which is resistant level. The 1kg ha-1 x 500mg l-1, 1kg ha-1 x 100mg l-1 both gave anthracnose severity score of 2 which is moderately susceptible. Only the highest fertilizer interaction of 2kg ha-1 x 500mg l-1 gave susceptible severity score of 3.67. The remaining four interactions had the score of 3 (moderately susceptible). As Alakisa is an early susceptible variety the 3 MAP soil amendment plus monthly 100mg l-1 Ca (NO3)2 is recommended in further trials to establish optimum interaction for anthracnose control. Infection of 1.03% and 0% weight loss in tubers incubated with B. theobromae for 2 weeks is lower than any report of infection and weight loss reduction of B. theobromae by calcium fertilizer. Yield of 18.24tons ha-1 in this study is within the potential range of 16 to 25tons ha-1 with the recommended 8 bags (400kg) of NPK 15-15-15 per hectare under continuous yam monocropping in Niger.
Yam (Dioscorea species) is a climbing, vigorously twinning plant. They are perennial through root system but are grown as annual crops [1]. The food cultivars are staples with socio-economic importance in Africa, the Caribbean, Asia and Latin America [2]. West Africa grows over 90% of the worldwide production (40tonnes fresh tubers/year), followed by the West Indies where Jamaica is the leading producer [3]. The popular cultivated species in Nigeria are the white guinea yam (D. rotundata), water yam (D. alata), yellow guinea yam (D. cayenensis) and trifoliate yam (D. dumetorum). Yam is an important staple food crop second to cassava in terms of land area under cultivation in Nigeria (Chukwu and Ikwell, 2000). Most of the world production of yam is from West Africa (over 90%) with Nigeria alone accounting for nearly 75% of the total world production [4]. One of the major constraints to the production of yam is disease. Economic diseases occurring on yams from planting to harvest include Anthracnose (Colletotrichum gloeosporioides), seed tuber rot (Aspergillus spp, Botryodiplodia theobromae, Rhizopus spp, Penicillium spp., Fusarium oxysporum and F. solani), root rot (F. oxysporum and Phythium sp.), stem basal canker (F. oxysporum), vascular wilt (F. oxysporum), virus diseases (shoe string and mosaic viruses). Leaf spots (Curvularia eragrostidis, C. geniculate and Cercospara sp.) [5].
Anthracnose caused by the fungus Collectrotrichum gloesoporioides is the single largest constraint for yam production in the tropical and temperate regions [6]. Collectrotrichum gloesoporioides Penz. infects mainly leaves, although it causes anthracnose symptoms on all plant parts, which appear initially as small brown spots that extend and cause extensive blackening of the leaves as the disease progresses [7]. It reduces the photosynthesis efficiency of yam plants, which severely limits tuber production and results in heavy yield loss (80%, 85%) in susceptible genotypes [6-8]. Postharvest deterioration and rot caused by various microorganisms especially fungi are also seen as the single most important factor militating against commercial yam production in Nigeria. Yam storage rots account for loses of 7 million metric tonnes annually (Taiga, 2001). Botryodiplopodia theobromae is one of the four most important pathogens responsible for tuber deterioration in stored yams [9].
Resistance breeding in yam anthracnose control is continuous as varietal resistance breaks down with environment and anthracnose pathogenic strains may develop resistance [10]. Cultural practices and fungicides, where affordable are being used also to manage anthracnose disease. Management of yam storage rot pathogens has also been through usage of fungicides, avoidance of wounds/injuries that promote microbial attack, cultural practices such as improved storage methods and biological control [11]. Managing crop disease through mineral nutrition deemphasizes pesticide usage with their attendant hazards and is cost effective in sustainable agriculture [12]. Calcium fertilization or calcium foliar feeding has been reported to enhance resistance to disease [13]. Combination of soil application of Ca (NO3)2 and foliar spray of fertilizer containing Ca2+ and Mg2+ resulted in significant reductions in severity and incidence of Phytophthora infestans, Septoria lycopersici and Alternaia solani on Solanum lycopersicum (tomato) vars. Rio de Grenier and Rona in Cameroon [14]. Apple fruit quality and fruit N/Ca and K/Ca ratios were improved by soil application of calcium nitrate fertilizer [15]. Soft rots by Erwinia carotovora subsp. Atrospetica in potatoes, Solanum tuberosum have been reduced by calcium sulphate and calcium nitrate fertilizers [16]. Most recently CaCO3 and NPK reduced tuber rots by A. niger and B. theobromae in three varieties of Dioscorea species [17]. This study aimed at determining the effect of soil amendment and foliarsprayed Calcium nitrate on Anthracnose disease and tuber rot caused by Botryodiplodia theobromae in D. alata var. Alakisa.
The field plot has been monocropped to Dioscorea species for two previous consecutive years (2015 and 2016) with Ca (NO3)2 fertilizer. The experiment was a 3 by 3 factorial arranged in RCBD (randomized complete block design) with three replications. The plot size was 14m by 9.5m, with 1m by 1m mounds, 80cm high. A 2m bamboo stake was established per mound. Intra-row distance was 0.5m while inter-row and inter-replicate distance were 1m each. A field border 1m all round was maintained. Eighteen (18) plants occupied a replicate with a total of 54 plants.
Soil samples were collected by replicate with a soil auger before mound making. Twenty (20) core samples were collected per replicate lifted in the zig-zag pattern at 20cm depth in a slanting position (to include top and inner soil) into new labelled polythene bags (Page et al. 1982). They were transferred to the laboratory, airdried and sieved with a 2mm sieve, after which they were bulked together per replicate for analysis. Exchangeable cations were analyzed using standard methods, of the A.O.A.C. [18].
The three soil amendments rates were 0kg ha-1, 1kg ha-1 and 2kg ha-1 Ca (NO3)2 applied at 3 MAP (months after planting) in a groove of 25cm radius, about 20cm deep, around the plant on the mound [19]. The groove was covered well with soil after even sprinkling of the fertilizer in the groove. Foliar spray of Ca (NO3)2 dissolved in deionized water was administered once at 5 MAP, at the rates 0mg l-1, 100mg l-1 and 500mg l-1, with the surfactant polysorbate 20/Tween 20 (C58H14O26) at the rate of 0.01%.
Leaves were sampled along a diagonal transect across the field plot 4 weeks after the foliar spray. Four (4) leaves each from the top, middle and lower portion were collected into new large labelled paper envelopes in the early hours, 7:00 to 8:00am, and transferred to the laboratory. They were washed in 2 changes of deionized water, before spreading in new labelled food paper packs to dry, on raised wooden storage structures in the COLPLANT (College of Plant Science) screen house. The dried leaves were milled in a 4-speed Saisho blender and re-packed in new labelled paper envelopes for analysis in the Biological Sciences Laboratory and Biotechnology Centre, Federal University of Agriculture, Abeokuta. Three phytochemicals namely flavonoid, lignin and tannin and seven minerals namely Nitrogen, Magnesium, Potassium, Calcium, Iron, Phosphorus and Sulphur were analyzed using standard methods [18].
Anthracnose disease incidence was assessed at 3 MAP before soil amendment fertilization. It was also assessed four (4) weeks after foliar-spray fertilization of 5 MAP. Disease severity was determined on an Anthracnose severity scale of 1 (resistant) to 5 (susceptible) in Figures 1-3 [20] at 6 MAP.
Figure 1: Yam leaf anthracnose disease assessment diagram+lesions on petiole and stem.
No symptom/0 ≤ 2% severity/resistant/highly resistant
Necrotic spots 1.00mm–2.00mm/3-5% severity/ moderately resistant (tolerant)
Necrotic spots 2.01mm–3.00mm/6-10% severity/ moderately susceptible
Necrotic spots 3.01mm–4.00mm/11-25% severity/ susceptible
Necrotic spots >4.00mm/50% severity/very susceptible Modified from Green (1994)
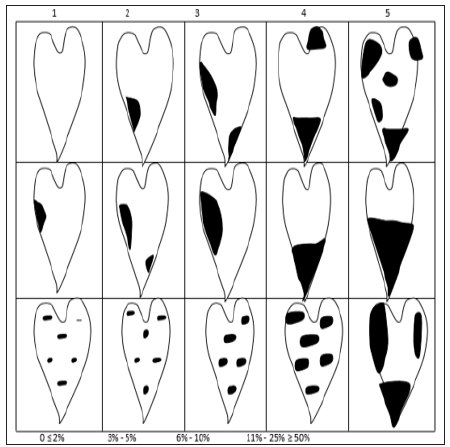
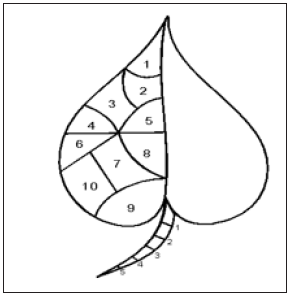
Figure 2: Leaf anthracnose assessment.
Petiole 1/5 x 100 = 20%
Leaf BLADE 1/10 = 5%, 2/10 = 10% ETC.
10 Leaves UPPER PORTION (young = tender/lighter texture)
10 Leaves MIDDLE PORTION (maturing = green/ expanded/big)
10 Leaves LOWER PORTION (fully expanded + wellformed Cuticle/texture leathery)
The 6 MAP tuber sampling for tissue analysis and the infection/ weight loss experiment was done one day before the 6 MAP harvest. Sampling was along the second diagonal transect (the first was that used in the leaf sampling) across the field plot in the early morning (7.00am-8.00am). Plants were labelled, and treatments were also randomized along the diagonal transect. Three unbruised tubers each were selected per treatment for tissue analysis and for the infection and weight experiment. Sampling in a mound was done by moving soil away carefully with the wooden spoon from the roots of the plant until at least six tubers/or more were exposed. Each tuber chosen, was then turned clockwise until it was free from the shoot. Tubers were freed from soil with a soft cloth.
Triplicate tubers set aside for the infection and weight loss experiment were labelled and weighed with a top-loading mettler balance, before inoculation. Inoculation of tubers was done inside the Inoculation Hood Structure of the Crop Protection Laboratory (COLPLANT Building), FUNAAB. Before inoculation, the point to be inoculated on each tuber (inoculation site) was surface-sterilized with cotton wool soaked in 80% ethanol. Two cork borers (6mm and 4mm diameter), scalpel and a pair of forceps were surfacesterilized, by dipping in 80% ethanol and flaming over a lighted spirit flame bottle until red-hot. They were then cooled, slanted against another cork borer. The sterile and cooled 6 mm cork borer was then used to make a 20mm to 25mm deep incision (based on the size of the tuber) through the inoculation site of each tuber. After this, the incised yam tissue was freed and lifted out with the sterilized scalpel and forceps. A 4mm agar (potato dextrose agar) disc of a 7-day old pure culture of Botryodiplodia theobromae growing inside a 9cm petri-dish, was then removed with the surface-sterilized 4mm cork borer and put in the hole inside the tuber. The incised tissue was then replaced, and the top of the inoculation site sealed with Vaseline (petroleum jelly). Inoculated tubers were labelled and transferred again to the yam storage structures in the COLPLANT Screenhouse for an incubation period of 2 weeks. After this, the tubers were transferred to the Crop Protection Laboratory. Each tuber was cleared of Vaseline with a spatula and cotton wool. Their weights were recorded again with a top loading mettler balance. Thereafter, each tuber was cut into two across the inoculation site with a steel knife. Infected tissue from each half was cut into a pre-weighed plastic Petri dish with a scalpel. Infected tissue weight was measured with an electronic balance.
Percent weight loss was determined with the formula:
% Weight loss (Y )=(A-B/A)100
where A and B are weight of the tuber at the beginning and at the end of the experiment respectively.
Percent infection was determined with the formula:
% infection=(C/A)100
where C and A are weight of infected tissue corrected for normal weight loss in the tuber and weight of the tuber at the beginning of the experiment respectively.
C was determined with the formula=100X/100-Y
where X and Y are, weight of infected tissue and percent weight loss respectively [21].
Harvest was early morning (7:00 to 8:00am) with smooth wooden spoons to avoid bruising of tubers. Tubers were freed from the yam shoots in each mound in the same manner as for the sampling for the infection and weight loss experiment (section 2.6). n the harvested tubers were left to dry for about 3 hours on the mounds, after which number of tubers per mound were counted and total weight of tubers per plant was then measured with a top loading mettler balance (field scale).
Data were subjected to analysis of variance (ANOVA). Percent data were transformed appropriately before analysis of variance. Means were separated with Tukey’s (HSD) test.
Results of the soil analysis is presented in Table 1. Soil pH was 7.33. Calcium and Nitrogen in the soil site of the values 0.47cmol kg-1 and 0.199% respectively, were both below the critical determined for optimum yam production in South West Nigeria [22]. Values for potassium, magnesium and phosphorus in the soil site were 0.66mol kg-1, 0.51cmol kg-1 and 46.52mg kg-1 respectively.
Main plot means for disease incidence (DI) at 6 MAP was in the range 61.11% to 77.78% as shown in Table 2, and subplot means was in the range 55.56% to 83.33%. There were no significant differences between the treatments. Interactions of treatment combinations M0T2 (0kg ha-1 x 500mg l-1), M1T0 (1kg ha-1 x 0mg l-1) and M2T2 (2kg ha-1 x 500mg l-1) gave significantly higher DI of 100% than other treatments. Treatment combination of significantly lower DI of 66.67% was recorded in M0T0, M0T1, M2T0 and M2T1 as shown in Table 2. The third lowest DI of 50% was recorded in the 1kg ha-1 x 500mg l-1 (M1T2) treatment and the lowest of 33.33% was recorded in the M1T1 (1kg ha-1 x 100mg l-1) treatment combination.
Mean main plot and subplot disease severity score was 2.41 (moderately resistant/tolerant) Table 2. Interaction treatments 0kg ha-1 x 100mg l-1 and 2kg ha-1 x 0mg l-1 had the score of 1 (resistant). The 1kg ha-1 x 100mg l-1 and 1kg ha-1 x 500mg l-1 had a score of 2 (tolerant/moderately resistant). 0kg ha-1 x 0mg l-1, 0kg ha-1 x 500mg l-1, 1kg ha-1 x 0mg l-1 and 2kg ha-1 x 100mg l-1 had the score of 2.67 to 3.33 (moderately susceptible). Lastly the highest soil amendment x foliar spray treatment, 2kg ha-1 x 500mg l-1 had the score of 3.67 (susceptible). There were significant differences in disease severity score in main plots, subplot or interaction treatments. Disease severity score correlated positively and significantly with disease incidence, leaf phosphorphosphorus and leaf potassium, r=0.4373, r=0.4350 and r=0.4054 Table 3.
Table 2: Disease incidence and severity in calcium-fertilized Dioscorea alata variety Alakisa at 6 months after planting.
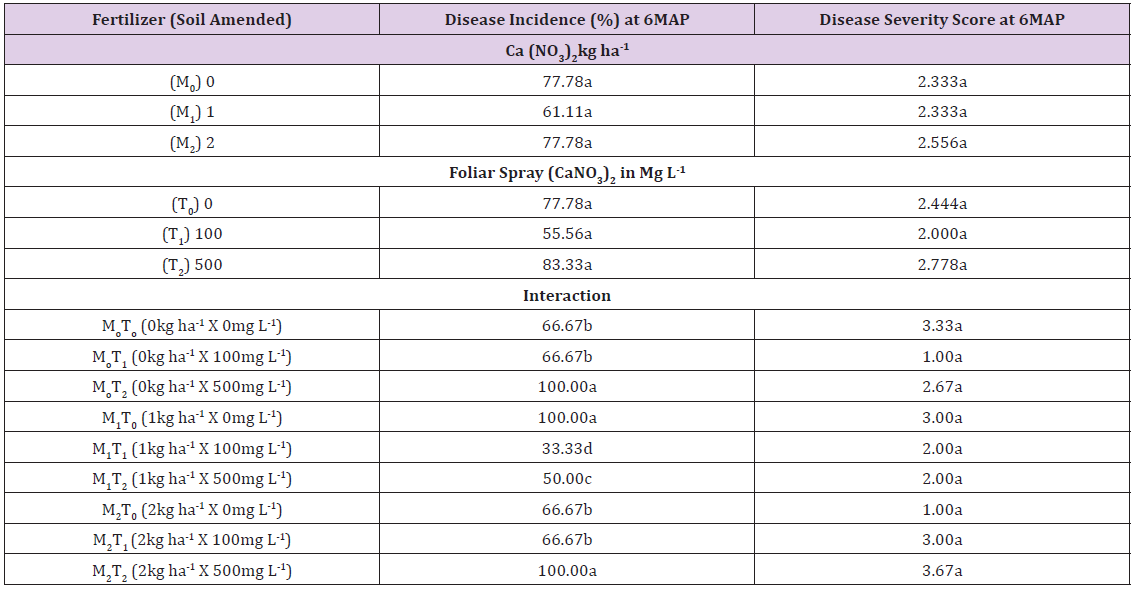
Means in any column followed by a common letter are not significantly different at P<0.05 (Tukey’s test).
Table 3: Three anticipins and mineral content (mg/100g dry matter) in leaves of calcium-fertilized Dioscorea alata variety Alakisa, at 6 MAP.
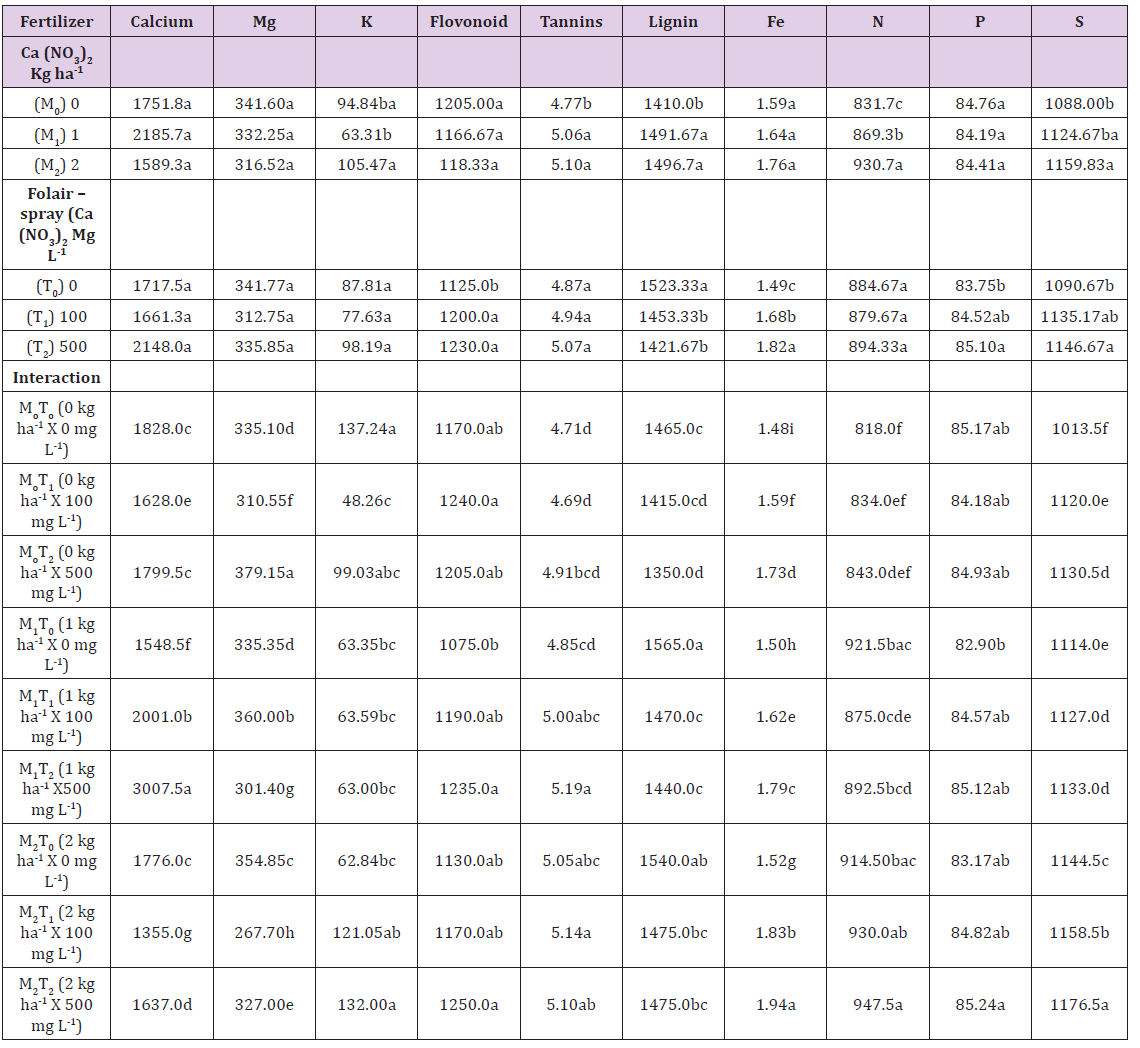
Means in any column followed by a common letter are not significantly different at P< 0.05 (Tukey’s test).
Leaf Tissue Analysis (Phytochemicals) at 6 MAP: Flavonoid content in the range 1166.67 to 1230mg/100gdm in the mainplot treatments were not significantly different from one another Table 3. It was significantly lower in the control subplot 1125mg/100gdm than the 100 and 500mg l-1 treatments, 1200 and 1230mg/100gdm respectively Table 3. Tannin content of 5.06 to 5.10mg/100gdm was significantly higher in the 1kg ha-1 and 2kg ha-1 main plots than the control 4.77mg/100gdm.
Tannin content in the 2kg ha-1 x 100mg l-1, 1kg ha-1 x 500mg l-1 treatments were significantly higher (5.14mg/100gdm and 5.19mg/100gdm), than four others, 0kg ha-1 x 0mg l-1, 0kg ha-1 x 100mg l-1, 0kg ha-1 x 500mg l-1 and 1kg ha-1 x 0mg l-1 which were in the range 4.69 to 4.91mg/100gdm. Leaf lignin content was significantly higher, 1491.67 and 1496.70mg/100gdm, in the Ca (NO3)2 soil-amendment treatments (2kg ha-1 and 1kg ha-1), than the control (0kg ha-1), 1410mg/100gdm. The control foliar-sprayed plants however had higher lignin content 1523.33mg/100gdm than the Ca (NO3)2 foliar-sprayed plants (100mg l-1, 500mg l-1) which were 1453.33mg/ 100gdm and 1421.67mg/ 100gdm.
Leaf Mineral Content: Leaf calcium was higher in the 1kg ha-1 x 500mg l-1 treatment (3007.5mg/100gdm) than other treatments, Table 3. The lowest leaf calcium content of 1355mg/ 100gdm was in the 2kg ha-1 x 100mg l-1 treatment, while the seven other treatments varied significantly from one another as shown in Table 3. Calcium was not significantly different in the main plot or subplot treatments. Leaf Mg was not different in main plot or subplot treatments, but eight of the nine treatments, but eight of the nine treatment interactions were significantly different from one another, in increasing order as follows: 379.15mg/100gdm (0kg ha-1 x 500mg l-1), <360mg/100gdm (1kg ha-1 x 100mg l-1), < 354.85mg/100gdm (2kg ha-1 x 0mg l-1), < over 335mg/100gdm (1kg ha-1 x 0mg l-1 and 0kg ha-1 x 0mg l-1), < 327mg/100gdm (2kg ha-1 x 500mg l-1) < 310.55mg/100gdm (0kg ha-1 x 100mg l-1) < 301.4mg/100gdm (1kg ha-1 x 500mg l-1) < 267.7mg/100gdm (2kg ha-1 x 100mg l-1). There were no articulate significant differences in K (potassium) in the treatments. Leaf iron (Fe) content was significantly higher, 1.82mg/100gdm in the 500mg l-1 treatment than the 100mg l-1 treatment which was 1.68mg/100gdm, and this was significantly higher, 1.49mg/100gdm than in the 0mg l-1.
Each of the nine interaction treatments were significantly different from one another also, in leaf iron as follows: 1.94mg/100gdm (2kg ha-1 x 500mg l-1) < 1.83mg/100gdm (2 kg ha-1 x 100mg l-1) < 1.79mg/100gdm (1kg ha-1 x 500mg l-1) < 1.73mg/100gdm (0kg ha-1 x 500mg l-1) < 1.62mg/100gdm (1kg ha-1 x 100mg l-1) <1.59mg/100gdm (0kg ha-1 x 100mg l-1) < 1.52mg/100gdm (2kg ha-1 x 0mg l-1) < 1.50mg/100gdm (1kg ha-1 x 0mg l-1) < 1.48mg/100gdm (0kg ha-1 x 0mg l-1). Nitrogen content was significantly higher 930.7mg/100gdm in the 2kg ha-1 treatment than the 1kg ha-1 treatment which was 896.3mg/100gdm, which was in turn higher than the control (0kg ha-1), 831.7mg/100gdm. Subplot treatments were not different in leaf Nitrogen content, but significant differences in the interactions are as shown in Table 3.
the 500mg l-1, Ca (NO3)2 treated plants than the control (0mg l-1) which was 83.75mg /100gdm Table 3. Interaction effects in leaf phosphorus content 85.24mg/100gdm was significantly higher in 2kg ha-1 x 500mg l-1 than in 1kg ha-1 x 0mg l-1 which was 82.90mg/ 100gdm. The remaining 7 interaction effects were similar Table 3. Sulphur content of 1159.83mg/ 100gdm in the 2kg ha-1 Ca (NO3)2 treated plants was significantly higher than in the control (0kg ha-1) which was 1088mg/100gdm. The higher foliar spray treatment, 500mg l-1 also had significantly higher sulphur content, 1146.67mg/100gdm than the control (0mg l-1), which was 1090.67mg/100gdm. All eight interaction effects were significantly higher than the control in sulphur content. The values are 1176.5mg/100gdm (2kg ha-1 x 500mg l-1) < 1158.5mg/100gdm (2kg ha-1 x 100mg l-1) < 1144.5mg/100gdm (2kg ha-1 x 0mg l-1) < 1127 to 1133mg/100gdm (1kg ha-1 x 500mg l-1, 0kg ha-1 x 500mg l-1, 1kg ha-1 x 100mg l-1) < 1120 to 1114mg/100gdm (0kg ha-1 x 100mg l-1, 1kg ha-1 x 0mg l-1) < 1013.5mg/100gdm (0kg ha-1 x 0mg l-1) Table 3.
Significant Correlations: Positive significant correlations between the leaf minerals are as shown also in Table 4. N significantly correlated with Fe and S, r=0.4662, 0.7043. P significantly correlated with Fe, r=0.4814. Fe with S, r=0.6841 and K with P, r=0.5794. The four minerals, N, Fe, S and P correlated positively and significantly with the phytochemicals Table 4, as follows:
Table 4: Significant Correlations of Disease incidence, severity, leaf anticipins, leaf minerals and yield in D. alata var. Alakisa.

*Significant Correlation at P=0.001 to 0.05, n=27.
N with lignin and tannin, r=0.5192 and 0.7487 respectively. Fe with flavonoid and tannin, r=0.4960 and 0.6534 respectively. P with tannin, r=0.1282; S with tannin, r=0.6681. Significant negative correlations were between Lignin and flavonoid, r=-0.6231; Iron (Fe) and lignin, r=-0.3425.
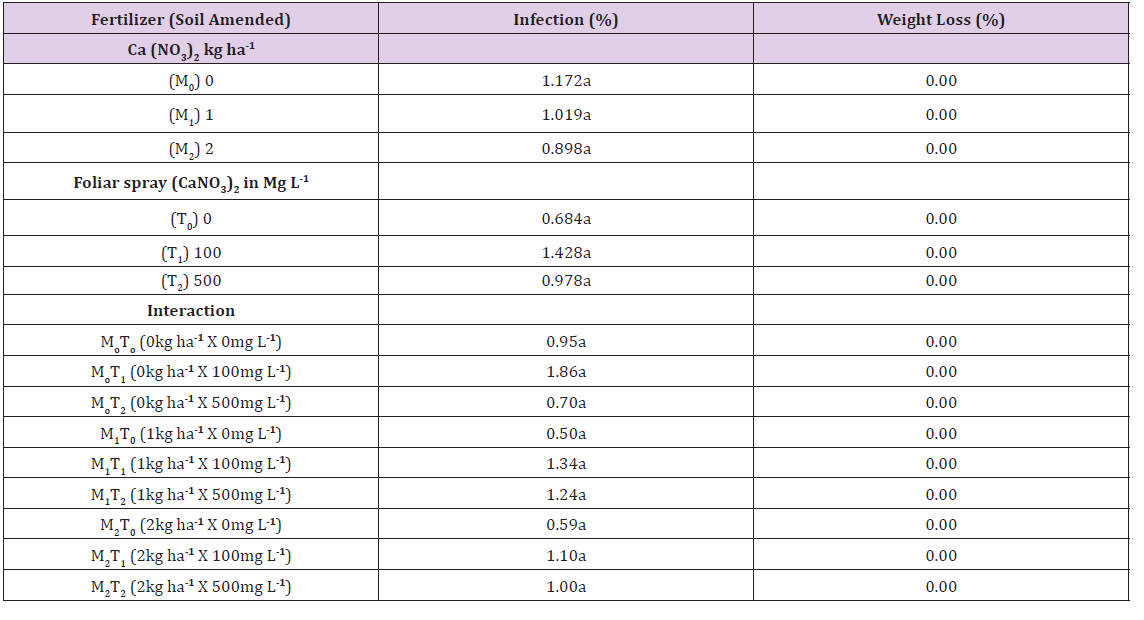
Tubers sampled at 6 MAP, inoculated and incubated with Botryodiplodia theobromae for 2 weeks had mean infection of 0.89% to 1.17% (main plot means) and 0.68% to 1.17% as shown in Table 5 for subplot means. They were not significantly different from one another. Interaction effects gave a range of 0.50% to 1.95% in infection and no significant differences between them Table 5. Weight loss was 0.00% for main plot and subplot means, as well as for interactions Table 5.
Table 5: Infection (%) and weight loss (%) in tubers of D. alata var. Alakisa after two weeks incubation with Botryodiplodia theobromae, yield at 6 months.
Means in any column followed by a common letter are not significantly different at P< 0.05 (Tukey’s test).
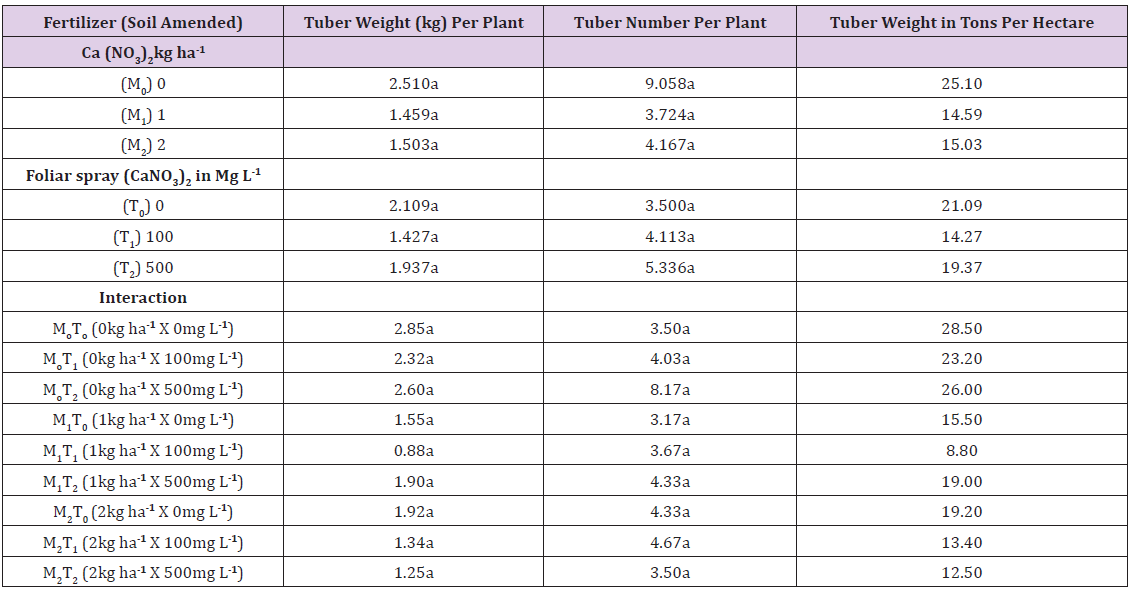
Tuber number per plant was 3.17 to 9.06, with no significant differences in main plots, subplots or interactions Table 6. Tuber weight per plant was 2.51kg in the control (main plots), 1.459kg in the 1kg ha-1 treatment and 1.50kg in the 2kg ha-1 treatment. It was 2.109kg, 1.427kg and 1.937kg in the 0mg l-1, 100mg l-1 and 500mg l-1 subplot treatments respectively. Tuber weight per plant was in the range 0.88 to 2.85kg in the treatment interactions. Tuber weight in tons per hectare is given in the last column in Table 6. Means for main plot, subplot and interaction are 18.24tons per ha, 18.24tons per ha and 18.46tons per ha respectively Table 6.
Table 6: Infection (%) and weight loss (%) in tubers of D. alata var. Alakisa after two weeks incubation with Botryodiplodia theobromae, yield at 6 months.
Means in any column followed by a common letter are not significantly different at P< 0.05 (Tukey’s test).
From the soil analysis results, Nitrogen was below 2% and calcium was below 0.65cmol kg-1, which are critical levels determined for yam production in South West Nigeria [22]. Therefore, calcium nitrate soil amendment in this study was justified. The only reports in literature of soil amendment or foliar spray effect of calcium fertilizer in the control of any disease in Dioscorea species were with calcium carbonate plus NPK [17] and calcium nitrate foliar spray [20]. In the report of the effect of foliar application of Ca (NO3)2 on susceptibility to anthracnose, the two improved varieties namely D. alata TDa 92-2 and D. rotundata TDr 131 and local variety D. alata variety Iberekodo were all susceptible late in the growth cycle that is after week 20 [20]. In this study, susceptibility was observed before the Ca (NO3)2 soil amendment at 3 MAP or 12 weeks after planting. Disease symptoms then increased, for which reason the only foliar spray of Ca (NO3)2 was administered at 5 MAP. Leaf analysis at 6 MAP indicated leaf lignin and tannin was higher in the calcium nitrate soil-amended plants, than the control. Leaf flavonoid content was also higher in the Ca (NO3)2 foliar-sprayed plants than in the control. Preformed secondary metabolites or phytoanticipins such as lignin, flavonoid and tannin, which are formed on leaf surface cell layers or within leaf cells, have antimicrobial properties as they provide a chemical barrier which resists pathogen enzymatic degradation, or release toxic substances within the cells, conferring chemical protection against pathogenic metabolites (Dube, 2014). The increase of these three phytochemicals in the leaves by fertilization is acceptable with reference to their antimicrobial potential. Among the eight minerals, N, Fe, P and S increased with Ca (NO3)2 fertilizer application.
The positive correlation of N with lignin and tannin, Fe with flavonoid and tannin, S with tannin and P with tannin, implies higher antimicrobial effects by the phytoanticipins on foliage diseases including anthracnose with Ca (NO3)2 fertilizer. Positive correlation between N and Fe, and N and S implies that iron and sulphur may increase as N supply increases from Ca (NO3)2 fertilizer. Treatment interactions gave disease severity scores from 1 (resistant) to 3.67 (susceptible). The 2kg ha-1 x 0mg l-1 and 0kg ha-1 x 100mg l-1 had a score of 1.00 (resistant). The 1kg ha-1 x 500mg l-1 and 1 kg ha-1 x 100mg l-1 had a score of 2 (moderately resistant/tolerant). The 2kg ha-1 x 100mg l-1, 1kg ha-1 x 0mg l-1, 0kg ha-1 x 500mg l-1 and 0kg ha-1 x 0mg l-1 had a score of 2.67 to 3.33 (moderately susceptible). The 2kg ha-1 x 500mg l-1 had a score of 3.67 (susceptible). Disease severity correlated positively with disease incidence implying that increase in incidence may result in increase in severity if anthracnose is not controlled. Variety Alakisa is susceptible early in the growth cycle and not late as for the three varieties in the cited report of Otusanya et al. [20]. The increase in susceptibility from 3 MAP suggests that apart from Ca (NO3)2 soil amendment at 3 MAP, Ca (NO3)2 foliar sprays may be appropriate in this variety from 1 MAP (one month after planting), in future trials. The varietal response to monthly foliar spray applications may then be monitored, for the best interaction effects (soil amendment x foliar spray) which may reduce anthracnose to resistant level (score 1).
Mean infection in the tubers incubated with B. theobromae for 2 weeks was 1.03%. This infection level (1.03%) is 44% and 60% of that recorded (in 2 weeks) for the first and second year respectively in the two improved varieties (D. alata TDa 92-2 and D. rotundata TDr 131) and the local variety D. alata variety Iberkodo, in the report of the effect of CaCO3 soil amendment to tuber infection by B. theobromae [17]. This is an improvement in infection probably due to better soil amendment fertilizer effect of Ca (NO3)2 than CaCO3. Weight loss in variety Alakisa tubers in this study was nil (0%), which is also an improvement over the 3.16% (Year 1) and 4.10% (Year 2) recorded for the three varieties fertilized with CaCO3 soil amendment in the cited report [17]. Mean tuber weight per plant at 6 MAP in this study is 18.24tons ha-1 (main plot and subplot means), within the range of the potential of 16 to 25tons per hectare for water yam under good management of 400kg (8 bags) of NPK 15- 15-15 per hectare (60kg N, 60kg P2O5 and 60kg K2O per hectare) under continuous cultivation in Nigeria [23].


