Impact Factor : 0.548
- NLM ID: 101723284
- OCoLC: 999826537
- LCCN: 2017202541
Farhan Javed Dar* and Ibrahim Mansoor
Received: June 26, 2018; Published: July 03, 2018
*Corresponding author: Farhan J Dar, Department of Pathology, Laboratory Medicine & Blood Bank, International Medical Center, Saudi Arabia
DOI: 10.26717/BJSTR.2018.06.001333
Background: This study was undertaken to determine the frequency and trend of testing and retesting of vitamin D in a private hospital.
Method:Longitudinal observational study is conducted in a Clinical laboratory from January 2010-November 2017. Number of vitamin D test and retest were counted. Results were classified into different vitamin D categories based on cut-offs from the National Osteoporosis Society and Institute of Medicine.
Results:A total number of requests received at laboratory for vitamin D tests were 97750. The total numbers of patient tested were 49934. Out of which 30039 (60.1%) were tested only once and rest had multiple retests (n=19895, 39.9%). The frequency of tests for each individual varied between 1 and 29 in that period. Mean age was 38.41 (±18.34) years. Vitamin D <30nmol/L was found in 42.8% which documented to 20.8% on retest. Most of the first retest (20.3%) was at interval between 1 to 3 months. Only for 11734 patients vitamin D status improved on first retest (p-value <0.001).
Conclusion: An eight fold increase in number of requests for vitamin D testing is seen during this period. Confirming the trend of testing worldwide, females were tested more and found more deficient than male.
Keywords: Vitamin D; Testing; Clinical Laboratory; Hospital
Abbreviations: NHANES III: Third National Health and Nutrition Examination Survey; NOS: National Osteoporosis Society; IRB: Institutional Review Board; 25OHD: Serum 25-Hydroxy Vitamin D; 25OHD3: Serum 25-Hydroxy Vitamin D3; IOM: Institute of Medicine; VD2: First Retest Vitamin D; VD1: Initial Vitamin D
Vitamin D testing has been significantly increased over the period of time [1]. Optimal vitamin D is required for proper maintenance of musculoskeletal health. It promotes calcium absorption from the bowel, enables mineralization of newly formed osteoid matrix in bone and plays an important role in muscle function. The main manifestations of vitamin D deficiency are rickets in children and osteomalacia in adults. Less severe vitamin D deficiency (low vitamin D levels; “hypovitaminosis D”) may lead to secondary hyperparathyroidism, bone loss, muscle weakness, falls and fragility fractures in older people. Other significant associations of vitamin D has also been made with increased risks for hypertension, type II diabetes, cardiac diseases, respiratory disorders and different cancers [2]. Thus testing for and treating low vitamin D levels have become a common practice as both workups for certain medical conditions and symptoms and as part of routine health maintenance. In US, data from the Third National Health and Nutrition Examination Survey (NHANES III) has revealed that the prevalence of vitamin D deficiency and insufficiency is >50% among children and young, middle-aged, and older adults [2,3].
Literature from other parts of world such as UK, Australia, and Middle East, etc has also shown increased vitamin D deficiency and thus increasing testing orders from different physicians [1,4,5]. The prevalence of vitamin D deficiency/insufficiency among Saudi population is also very high despite of ample sunlight all year round [6,7]. A recent study [8] from Saudi also addressed the knowledge about vitamin D supplementation but there is lack of data regarding Vitamin D testing and retesting from the country. Retesting after three to six months is recommended in guidelines. Thus this study using laboratory data of vitamin D helped us better understanding the current practices and identified pattern of vitamin D testing and retesting during last eight years in one of the renowned private hospital of Kingdom of Saudi Arabia. This study also assessed how the usefulness of vitamin D retesting has changed over time in identifying correctness of deficiency in tested population.
Longitudinal observational study is conducted in the clinical laboratory of International Medical Center, Jeddah, Saudi Arabia.The data of vitamin D tested in laboratory for last eight years from January 2010 to November 2017 was included in the study. Number of vitamin D (serum 25-hydroxy vitamin D; 25OHD) test and retest were counted. Frequency of patient tested by gender, marital status, age group and nationality were determined. Vitamin D analyzed on automated analyzer using electro chemiluminescence technique. From January 2010 to April 2011 25OHD3 was measured and then shifted to 25OHD total assay. Results were classified into different categories based on cut-offs from the NOS and Institute of Medicine (IOM) consensus guidelines [9].
These include vitamin D deficiency (<30 nmol/L), insufficiency (30–50 nmol/L), sufficiency (50.1–125 nmol/L). In addition 125.1– 200 nmol/L was categorized as vitamin D excess (Increase risk of hyper calciuria) and >200 nmol/L labeled as possible vitamin D toxicity. Mean vitamin D blood levels by gender, marital status, age group and nationality were also compared using Independent t-test and Anova, p-value <0.05 consider statistically significant. Changes in the relative proportions of these categories were summarized by month and year. Chi-squared test is used for difference in proportions. Repeat tests (retests) were likely to be performed after supplementation or treatment and therefore are analyzed separately from first tests. Changes in vitamin D levels between first test and first retest are analyzed using Wilcoxon’s signed rank test. P-value <0.05 consider statistically significant. Statistical analysis is performed using SPSS 19.0.
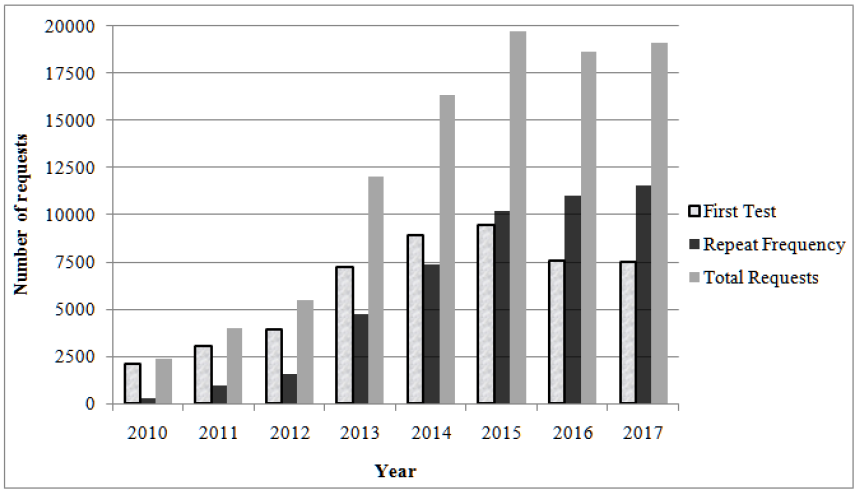
From January 2010 to November 2017, total number of requests received at laboratory for vitamin D tests were 97750 from outpatient (n=93615), inpatient (n=3564) and emergency (n=571) departments. Over this period of eight years, the total numbers of patient tested were 49934. Out of which 30039 (60.1%) were tested only once and rest had multiple retests (n=19895, 39.9%). The frequency of retests for each individual varied between 1 and 29 in that period, 19895 retested two times, 10601 retested three times, 6299 retested four times, 3967 retested five times, 2530 retested six times, 1607 retested seven times, 1049 retested eight times, 686 retested nine times, 444 retested ten times and 738 retested between eleven and twenty-nine times during this eight years. A total of 2397 tests (initial and repeat) were requested in year 2010 which rose up to 19087 in year 2017 (Figure 1). Two thousand one hundred and eighteen (4.2%) initial tests were requested in 2010, compared with 7534 (15%) in year 2017, a 3 fold increase. The number of requests for repeat tests also increased from 279 (0.6%) to 11553 (24.2%) during this period.
Figure 1: Total number of requests for vitamin D tests each year, from January 2010 – November 2017.

Flip pattern was seen in year 2015 onward for vitamin D retests frequency to initial vitamin D requests. The mean age of the population tested was 38.4 (±18.3) years. Age ranges from <1 month to 105 years. Initial (First) Test Vitamin D Results: During the study period 21388 (42.8%) of results from initial requests recognized vitamin D deficiency, 15053 (30.1%) were insufficient, 12841 (25.7%) were sufficient, 599(1.2%) were excess and 53 (0.1%) were toxic. Around 73% participant is below recommended vitamin D blood levels. The mean vitamin D blood level for all participants was 40.5 (±27.0) nmol/L and median vitamin D was 33.7 nmol/L with interquartile range of 30.4 nmol/L. (Table 1) shows general and demographic characteristics of the study population. Females were tested more frequently than male (F:M =3:1). The majority of participants were nationals of Saudi Arabia (n=35104; 70.3%). Mean blood levels of vitamin D differs significantly among different nations (p-value <0.001).
Table 1: General & demographic characteristics of population tested with comparison of mean blood levels of vitamin D (n= 49934).

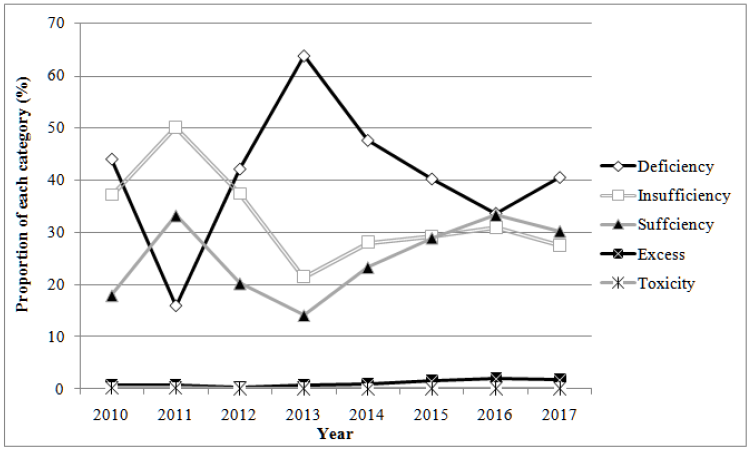
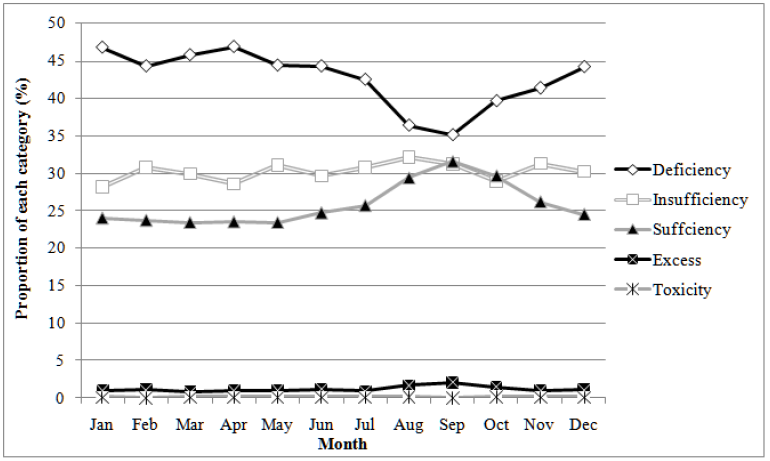
The proportion of results identified as vitamin D deficient in year 2010 improved from 44% to 16% in year 2011 but escalated next two years to 64% (Figure 2). Next following three years, vitamin D deficient proportion falls down to 34% in year 2016. In year 2017 again vitamin D deficiency found up to 41% in population tested. During eight years, the proportion of vitamin D sufficient level fluctuates between 18% and 33%. In year 2016 the proportion of deficiency and sufficiency share equal percent (33%). Vitamin D toxicity was found in <1% proportion. The proportion of vitamin D deficient is detected higher throughout the year than the sufficient, ranging 47% to 44 % from January to December (Figure 3). An improvement in vitamin D sufficient proportion is seen between August and October, 25% to 32%.
Figure 2: The proportion of each vitamin D category over eight years as defined by the National Osteoporosis Society (Chi-square p-value <0.001).

Figure 3: The proportion of each vitamin D category over months of the year as defined by the National Osteoporosis Society (Chi-square p-value <0.001).

Repeat Test Vitamin D Results (Follow-up)
During the study period 19895 patients retested for vitamin D. They had multiple retests ranging up to maximum of 29 times. Of the tests, 47816 were repeats. The absolute number of retests increased rapidly over the study period. The number of requests for repeat tests increased from 0.6% (279) to 24.2% (11553) in year 2017. Only the first retests (n= 19895) are analyzed below. At first vitamin D repeat, vitamin D blood levels were deficient in 2589 (13.0%) and insufficient in 4136 (20.8%). Vitamin D blood levels were found sufficient in 12086 (60.7%) of patients. Excess and toxic vitamin D blood levels were found in 1028 (5.2%) and 56 (0.3%) respectively. The mean vitamin D blood levels for first retest was 67.2 (±34.0) nmol/L and median was 63.8 nmol/L with interquartile range of 45.5 nmol/L. Mean and median vitamin D blood levels according to retesting interval for Vitamin D from first test are shown in (Table 2). Most of the first retest was at interval between 1 to 3 months (20.8%) followed by interval between 13 to 24 months (20.3%). The mean blood levels was found high for retests during interval 1 to 3 months (78.4 nmol/L) which gradually lowers down with increase in time interval. Vitamin D median levels were also lowered down over the course of time. When first retest vitamin D (VD2) was compared to initial vitamin D (VD1), 15863 was found increased from baseline, although for only 11734 vitamin D status improved (p-value <0.001).
A marked rise of eight fold in the number of requests for vitamin D analysis is seen in this private hospital over last eight years (Figure 1). This increase in vitamin D testing from physicians might be contributed due to importance of vitamin D in different health conditions. This has also been shown recently in publication related to vitamin D testing and prescription of vitamin D supplementation [8-10]. The other important reasons would be easily accessible vitamin D testing, public awareness and their demand [11]. In the US, different laboratories saw the volume of 25OHD testing increase 5–6-fold between 2004 and 2007 [12]. Vitamin D deficiency reported as global public health problem [2] is also prevalent in all age groups from different nationalities (Table 1) in this tested population. We have found 73% of total population tested below threshold of sufficiency (<50 nmol/L; vitamin D deficient and insufficient). Females (74.6% below <50 nmol/L) found to be have lower mean blood vitamin D blood levels compared to males (70.1% below <50 nmol/L; (Table 1). Similar vitamin D status was found in recent studies from Riyadh [13,14], Dammam [6,15] and other sunny regions of world [16,17].
During the National Health and Nutrition Examination Survey (NHANES) of US 2005 to 2006, the overall prevalence rate of vitamin D deficiency was reported 41.6%, using the same cut-off defined by Institute of Medicine [3]. Other large US hospital study also showed almost 50% of the tested population as being vitamin D deficient using the cut-off for vitamin D deficiency levels as proposed by Holick (75 nmol/L ) [12] . In our study we also found significant proportion of vitamin D deficiency in each year, varies between 41% - 64% (Figure 2). In our tested population, vitamin D deficiency remains consistently high compared to insufficiency and sufficiency throughout the year. An improvement of 7% in vitamin D sufficient proportion is seen between August and October, from 25% to 32% (Figure 3). This incidental finding could be due to seasonal variation and sun exposure. They have been demonstrated as an important determinant of vitamin D deficiency across the world. In contrary few studies also could not find the reason of high prevalence of vitamin D deficiency despite ample amount of sunlight.
In one study from Saudi Arabia, despite > 65% of participants having adequate exposure to sunlight and > 90% reporting adequate intake of dairy products found significant number of vitamin D deficient [6]. May be the time of exposure has to be taken in consideration here. As one of the recent study from Riyadh, Saudi Arabia have proposed different time for sun exposure in summer and winter [18,19]. Plenty of patients have retested for vitamin D during last eight years. Eighty percent (11734/19895) has shown improvement in vitamin D blood levels and 60% had improved vitamin D status. Only 20% of retests were requested during three to six months of recommended retesting interval (Table 2). It is assumed that retesting is done after vitamin D supplementation and other means to improve vitamin D blood levels. In our study, retesting within six months may be suitable to observe change of vitamin D blood levels as it allow sufficient time for blood levels to respond as also found in previous study [1]. Retesting vitamin D <1 month after initiating treatment may give false picture of under or over repletion.
The vitamin D status drawn from this study could not identify exact degree of vitamin D deficiency in general population due to the inherently biased hospital based sample. But the sample size analyzed gives interesting testing trends in private setup.
Request for vitamin D testing has been increased for past eight years in this private setup. Confirming the trend of testi worldwide, females were tested more and found more deficient than male in all age groups. Retesting within a month may not give the accurate picture of vitamin D status as 3 to 6 months interval found appropriate period to check repletion. To further confirm the retesting intervals prospective intervention study is further required along with defining the mode of treatment. As proposed, to reduce over utilization of vitamin D testing, only high risk population, disorders of calcium and parathyroid hormone, osteoporosis, osteomalacia, malabsorption, chronic renal disease, patients with darker pigmented skin or reduced sun exposure, those under 16 years of age and patients taking drugs known to reduce vitamin D levels should be tested [20].
We gratefully acknowledge IT support and special thanks to Mr. Ghulam Rabbani, Hospital Information System Manager International Medical Center Jeddah, Saudi Arabia for helping in laboratory data collection.


