Impact Factor : 0.548
- NLM ID: 101723284
- OCoLC: 999826537
- LCCN: 2017202541
Anita Kovač Kralj*
Received: June 14, 2018; Published: June 21, 2018
*Corresponding author: Anita Kovač Kralj, Faculty of Chemistry and Chemical Engineering, University of Maribor, Smetanova 17, Maribor, Slovenia
DOI: 10.26717/BJSTR.2018.06.001282
Determining chemical kinetics is the basis for reactor design, the determining of activated energy, energy efficiency, steam production, and integrating the reactor’s outlet stream with the inlet. The purpose of this article is to describe a sensitivity method for concentration and activated energy determination. This sensitivity method defines the sensitivity parameter for determining the characteristics of a reaction using strong electrolytes (for example sodium hydroxide - NaOH) as reactants. The sensitivity parameter is constant throughout this specific reaction. Concentrations of strong electrolytes can be determined by the sensitivity method, which is based on the measurement of conductivities. This method proposes continuous concentration determination of NaOH (or strong electrolyte) as a reactant or product. This sensitivity method was tested using titration.
Keywords: Sensitivity Method; Strong Electrolyte; Concentration; Activation Energy
The basis is presented for determining concentration and activated energies from the reactions of strong electrolytes. Determining these concentrations is basic for analytical chemistry, using different methods. Eldridge, Piret [1] obtained the pseudofirst- order reaction rate constant using a batch reactor. In order to determine the acetic anhydride concentration, samples from the reactor were withdrawn into tarred flasks containing 15-20 times the quantity of saturated aniline-water required to react with the sample. Since the anhydride rapidly acetylates the aniline, thus producing acetanilide and acetic acid, the samples were then titrated to determine the concentration of acetic acid. In another study, Shatyski and Hanesian [2] determined the kinetics of the above reaction by using temperature-time data obtained under adiabatic conditions within a batch reactor. The use of in-situ FTIR spectroscopy has already been demonstrated, when following the hydrolysis of acetic anhydride reaction [3]. An analysis of the batch reactor’s data showed that the hydrolysis of acetic anhydride is a pseudo-first order reaction. The rate constants were calculated from the batch data using both integral and differential methods of analysis.
Advances in electronics and computing over the past 30 years have revolutionized the analytical laboratory. Technological developments have allowed instruments to become smaller, faster, and cheaper, while continuing to increase accuracy, precision, and availability. Furthermore, software sold with many commercial instruments contains automatic data-processing algorithms. Advances in computing have allowed researchers to obtain increasing amounts of chemically-relevant information from their data; however, this is not always achieved using simple data-processing techniques. It is important to establish true mathematical models for utilization within the chemical industry [4].
Chemical kinetics, also known as reaction kinetics, is the study of chemical processes’ rates. Chemical kinetics includes investigations into how different experimental conditions can influence the speed of a chemical reaction and yield information about the reaction’s mechanism and transition states, as well as the construction of mathematical models that can describe the characteristics of a chemical reaction. In 1864, Peter Waage and Cato Guldberg pioneered the development of chemical kinetics by formulating the law of mass action, which states that the speed of a chemical reaction is proportional to the quantity of the reacting substances [5]. The different forms of energy include kinetic, potential, thermal, gravitational, sound, elastic, and electromagnetic energy. These forms of energy are often named after a related force. German physicist Hermann von Helmholtz established that all forms of energy are equivalent-energy in one form can disappear but the same amount of energy will reappear in another form. A restatement of this idea is that energy is subject to a conservation law over time [6]. This paper studies the concentration and activated energy determined by the reactant NaOH (strong electrolytes), using the sensitivity method.
The sensitivity method is an alternative method for accurately quantifying reactant or product concentrations during NaOH (strong electrolytes) determination. This method applies a sensitivity parameter for determining concentrations and activated energies for strong electrolytes (such as NaOH), by using conductivity. Specific characteristic-sensitivity parameter (s) can be found from the measurements for strong electrolytes. Concentrations of strong electrolytes ct can be determined by using the sensitivity method. This method proposes a continuous determination of reactant or product concentrations. Each reaction using NaOH as reactant has the specific characteristic sensitivity parameter (s), which can be determined using the sensitivity method by applying conductivity. Conductivity for a specific reaction has a specific characteristic, therefore certain sensitivity parameters can be determined -the sensitivity constant, which is constant during a specific reaction.
This sensitivity method is a very simple method for the determining concentrations of strong electrolytes (Figure 1):
ct = c0– Δκ0·s (2.1)
ct = c0– Δκ0·s (2.2)
ct = c0 – (κ0-κt)s (2.3)
The non-reactive reactant’s (such as NaOH), concentration depends on time ct which can be calculated by using equations 2.1 or 2.3 with a difference in conductivity (Δκ ; eq. 2.2).
The sensitivity constant (s) for a specific reaction can be calculated by equation 2.4:
s = (c0-ct)/ (κ0-κt) (2.4)
c0 is the known initial reactant’s concentration and 0 κ is the known initial conductivity of strong electrolytes (NaOH). We need only a few measurements of conductivity κt, depending on time, so that ct can be calculated using the Kohlrausch law (equations 2.5; [7]). The constant s is equal for all measurements. Friedrich Kohlrausch showed that, at low concentrations, the molar conductivities of strong electrolytes vary linearly with the square root of the concentration:
Λm = Λom − K √c (2 .5 )
Where Λm introduces the molar conductivity in Siemens metresquared per mole (S m2 mol−1), which is defined as:
Λm=k/c (2.6)
Where c is the molar concentration of the added electrolyte, and κ is the conductivity in siemens per metre (S m−1).
The constant o Λm is the limiting molar conductivity, the molar conductivity within the limit of zero concentration. The o Λm for sodium hydroxide at a temperature of around 25°C is [7]:
Λom= 5.01+19.91 =24.92 mS m2 mol−1 = 2492 mS (dm2) mol−1
Kohlrausch’s constant can be calculated by known values for the initial concentration (c0) and initial conductivity (κ0), using equations 2.5 and 2.6:
K=Λom/co0.5-Ko/co1.5
The essence of the strong electrolytes theory is that you can determine the concentration of a reactant or product. The reaction can be observed by using the concentration calculation. The two basic equations 2.5 and 2.6 are used:
oΛm − K √c=k/c (2.9)
The concentration is expressed by equation 2.9 for the numerical method:
c=k+c1.5K/Λom (2.10)
The concentration can be calculated by using a numerical method (eq. 2.10; for example successive substitution; addition A). The initial concentration (zc) and the allowed differences between the initial and target values (EPS) are needed. The determination of any concentration change by using a numerical method is very longterm, so it is only used at the beginning so that you can determine the sensitivity constant of the conductivity. The sensitivity method was tested for various real reactions by using NaOH as reactant (chapter 3) (Figure 1).
The sensitivity method was tested to synthesize sodium methoxide, sodium benzoate, and sodium acetate. Sodium hydroxide (NaOH) was, in all cases, the reactant and a strong electrolyte.
Sodium methoxide ((CH3)ONa) was produced from sodium hydroxide (NaOH) and methanol (MeOH) in a batch reactor:
The main application of sodium methoxide today is its use as a catalyst in the production of bio-diesel. During this process, vegetable oils or animal fats, which are chemically fatty acid triglycerides, are transesterified with methanol to produce fatty acid methyl esters (FAMEs).
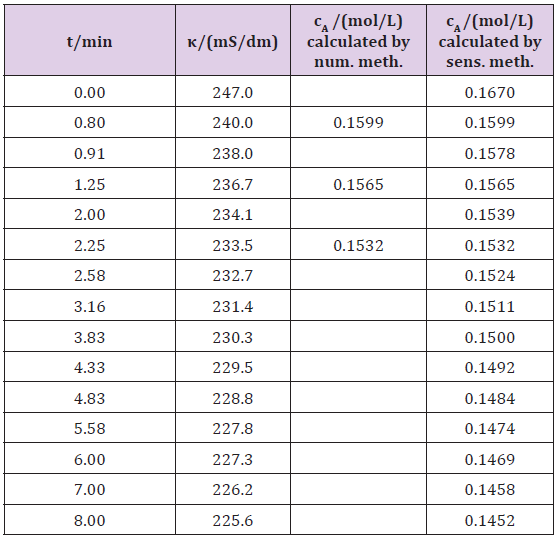
a) Determining the concentration using the sensitivity method: A schematic diagram of the laboratory apparatus is shown in (Figure 2). A batch reactor with a stirrer was used in the experiment. Methanol (0.12mL) was heated into a reactor at a temperature of 28 °C, and 3.34g pure NaOH was dissolved in 500mL of water. Both substances were mixed and the conductivity (κt) was measured depending on time, t (Table 1). The first conductivity of the sodium hydroxide (κ0) was 247mS/dm. The initial sodium hydroxide concentration, (cA0), was 0.167mol/L. The molar conductivity at infinite dilution ( oΛm ) of the sodium hydroxide was 2492mS (dm2) mol−1 [7] at a temperature of around 25°C (eq. 2.7). Kohlrausch’s constant can be calculated by known values of the initial concentration (cA0) and the initial conductivity (κ0), using equation 2.8, and was 2478.74 mS (dm2)/ ((mol L-1)1/2 mol). (Figure 2).
The some concentration for determining the sensitivity constant (s) was calculated by using equation 2.10 and a numerical method (for example successive substitution; addition A). The initial concentration (zc) and the allowed difference between the initial and target values (EPS) are needed (Table 1). After some determined concentrations can be used to calculate the constant s by using equation 2.4, s is 0.001. After the resulting value of s is easily calculated the concentration ct according to equation 2.3 at any measurement of conductivity (κt), because s is constant throughout the total reaction (Table 1).
ct = c0 – (κ0 –κt )·0.001 (3.1)
In equation 3.1 the constants are:
i. the initial conductivity of the sodium hydroxide (κ0)
ii. the initial sodium hydroxide concentration, (cA0),
iii. The sensitivity constant (s = 0.001).
Figure 3 illustrates the plot of sodium hydroxide concentration, cA, as a function of time at a temperature of 28ºC. (Table 1): (Figure 3).
Table 1: Experimental data and calculation for sodium methoxide synthesis, using numerical and sensitivity methods.

b) Calculating the concentration by using titration: Calculating the concentration was also checked using titration. The same experiment was carried out at 28 ºC by analysing a concentration, using titration (Table 2). 20mL 0.1mol/L HCl was added to the 10mL sample which stopped the reaction, and retitration with 0.1mol /L NaOH took place:
MolHCl = molNaOH+molsample
20 · 0.1 = 0.1 V NaOH + 10 ·cA (3.2)
Titration confirmed the measurement accuracy using conductivity.
c) Calculating the activated energy: It is necessary to identify the order of reaction, if ln ((cA0)/(cA)) depending on time t is linear, the reaction is of the first order; if (1/(cA)), depending on time t is linear, the reaction is of the second order. Function (1/cA), depending on time, was linear, so the second order of reaction was determined, therefore, the rate constant can be calculated under different temperatures, which is the basis for determining the activated energy (Table 3).
The specific reaction rate k, is a function of the reactive temperature, and is given by the Arrhenius equation:
k = k 0·e-Ea/R·T (3.3)
Where (k0) is the pre-exponential factor, Ea is the activated energy for the reaction, and T is the absolute temperature. Taking the logarithm of the Arrhenius equation (eq. 3.3):
ln k=ln k0- Ea/R·T (3.4)
The plotting of ln (k) and 1/T should produce a straight line and a slope proportional to the activated energy. The activated energy is 131.55 kJ/mol regarding sodium hydroxide (Figure 4). The slope of the graph is:
−Ea/ R =-15823 K(3.5)
Ea =15 823 K⋅8.314J / (mol K) =131.55 kJ / mol (3.6)
The activation energy is 131.55 kJ/mol regarding sodium hydroxide.
Sodium benzoate (NaC6(H5)CO2) is a preservative. It is bacteriostatic and fungi static under acidic conditions. Sodium benzoate is indicated on a product label as E211. Sodium benzoate is produced by the neutralization of benzoic acid ((C7)H6O2) with sodium hydroxide (NaOH):
a) Determining the concentration by using the sensitivity method
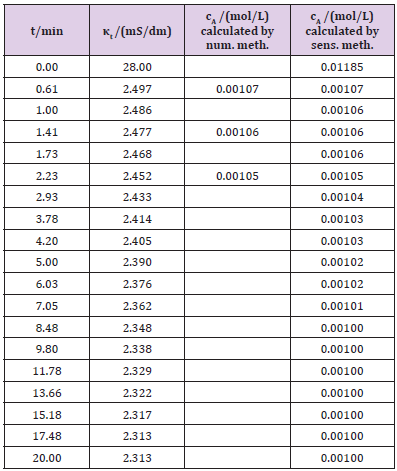
A schematic diagram of the laboratory apparatus is shown in (Figure 2). A batch reactor with a stirrer was used in the experiment. Sodium hydroxide (0.28546 g) was dissolved in water (0.1 L) and heated in a reactor at a temperature of 19 °C. Benzoic acid (0.800 g dissolved in 0.5 L of water) was added. Both substances were mixed and the conductivity (κt) depending on time, t (Table 4) was measured. First the conductivity of the sodium hydroxide (κ0) was 28.0 mS/dm. The initial sodium hydroxide concentration, (cA0), was 0.01185mol/L. The molar conductivity at infinite dilution ( oΛm ) of the sodium hydroxide was 2492mS (dm2) mol−1 [7] at a temperature of around 25°C (eq. 2.7). Kohlrausch’s constant can be calculated by known values for the initial concentration (cA0) and initial conductivity (κ0), using equation 2.8 and was 1186.23mS (dm2)/ ((mol L-1)1/2 mol). Some of the concentration for the sensitivity constant (s) determination was calculated by using the numerical method (eq. 2.10; Table 4), which is sufficient for determining constant s, s is 0.00045. After the resulting value of s, the concentration ct is easily calculated according to equation 2.3 at any measurement of the conductivity (κt), because s is constant throughout total reaction (Table 4) is:
ct =c0-(K0-kt)0.00045 (3.7)
Table 4: The experimental data and calculation for sodium benzoate synthesis, using numerical and sensitivity methods.

Figure 5 illustrates the plot of sodium hydroxide concentration, cA, as a function of time at a temperature of 19 ºC. For this reaction do not charge activated energy, since the reaction is too fast (Table 4) and (Figure 5).
Sodium acetate ((CH3)COONa) was produced from sodium hydroxide (NaOH) and ethyl acetate ((CH3)COO(C2)(H5)) in a batch reactor:
Sodium acetate is used in the textile industry to neutralize sulphuric acid waste streams. It is also a pickling agent in chrome tanning, and it helps to retard the vulcanization of chloroprene during synthetic rubber production.
a) Determining the concentration by using the sensitivity method
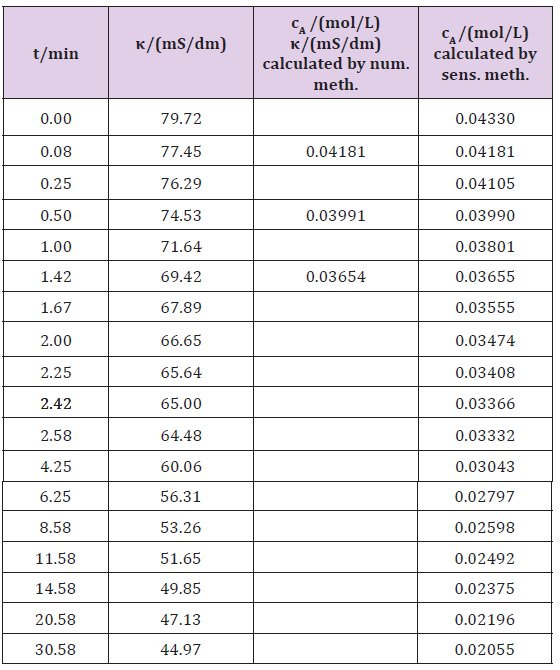
A schematic diagram of the laboratory apparatus is shown in (Figure 2). A batch reactor with a stirrer was used in the experiment. Ethyl acetate (3.5mL in 0.6L water) was heated into a reactor at a temperature of 22°C, and 1.92g pure NaOH was dissolved in 600mL of water. Both substances were mixed and the conductivity (κt) depending on time, t (Table 5) was measured. First the conductivity of the sodium hydroxide (κ0) was 79.72mS/dm. The initial sodium hydroxide concentration, (cA0), was 0.0433mol/L. The molar conductivity at infinite dilution ( oΛm ) of the sodium hydroxide was 2492 mS(dm2) mol−1 [7] at a temperature around 25°C (eq. 2.7). Kohlrausch’s constant can be calculated by known values of the initial concentration (cA0) and the initial conductivity (κ0), using equation 2.8, and was 3127.98 mS (dm2)/((mol L-1)1/2 mol).
The some concentration for the sensitivity constant (s) determination was calculated by using equation 2.10 and a numerical method. After determining the concentration the constant s can be calculated by using equation 2.4, s being 0.000654. After the resulting value for s the concentration ct is easily calculated according to equation 2.3 at any measurement of the conductivity (κt), because s is constant throughout the total reaction (Table 5):
ct =c0-(K0-kt)0.00654 (3.8)
Figure 6 illustrates the plot of sodium hydroxide concentration, cA, as a function of time at a temperature of 22ºC (Table 5) and (Figure 6).
Table 5: Experimental data and calculation for sodium acetate synthesis, using numerical and sensitivity methods.

b) Calculating the concentration by using titration
Calculating the concentration was also checked when using titration. The same experiment was carried out at 22 ºC by analysing a concentration, using titration (Table 6). 10mL 0.1mol/L HCl was added to the 10mL sample which stopped the reaction, and reiteration took place with 0.1mol/L NaOH:
molHCl = molNaOH + molsample
10 · 0.1= 0.1 V NaOH + 10 cA (3.9)
(Table 6) Titration confirmed the measurement accuracy using conductivity.
c) Calculating the activated energy
It is necessary identify the order of reaction, if ln((cA0)/(cA)) depending on time t is linear, the reaction is first order; if (1/ (cA)) depending on time t is linear, the reaction is second order. Function (1/(cA)) depending on time was linear, the second order of reaction was determined; therefore, the rate constant can be calculated under different temperatures, which is the basis for determining the activated energy (Table 7). The plotting of ln (k) and 1/T should produce a straight line and the slope is proportional to the activated energy. The activated energy is 43.3 kJ/mol regarding sodium hydroxide (Figure 7) and (Table 7).
The slope of the graph is:
-Ea/R=-2508.8 K (3.10)
Ea=5208.8K.8.314J/(mol K)=43.3 kJ/mol (3.11)
The activated energy is 43.3 kJ/mol regarding sodium hydroxide.
Determining concentration and activated energy plays an important role in chemical engineering, so it could represent both continuous and static methods for concentration determination. The continuous method, by using the sensitivity method, is very useful for uninterrupted concentration measurements. The sensitivity method applies a sensitivity constant for determining concentrations and activated energy for strong electrolytes (such as NaOH). The specific characteristic-sensitivity constant (s) can be found from the measurements for strong electrolytes by using conductivity. Each reaction using NaOH as reactant has the specific characteristic sensitivity constant (s), which is constant during a specific reaction. This method proposes a continuous determination of reactant or product concentrations.
For the three syntheses of sodium methoxide, sodium benzoate, and sodium acetate where, in all cases, the reactant was NaOH as a strong electrolyte, determined sensitivity constants s for each syntheses (ssm= 0.001, ssb= 0.00045 and ssa= 0.000654). Now that the sensitivity constants (s) for all syntheses were known, the concentration and activated energies could be easily calculated. The activated energies of sodium methoxide and sodium acetate syntheses were 131.55 and 43.3 kJ/mol regarding sodium hydroxide. The synthesis of sodium benzoate is too fast, therefore, the activated energy was not calculated.
c concentration, mol/L
Ea activated energy, J/mol
K constant in Kohlrausch equation, mS m2/ ((mol L-1)1/2 mol)
k reaction rate constant
(k0) pre-exponential factor
R gas law constant, J/ (mol · K)
s sensitivity constant
T temperature, K
t time of reaction, min
κ Conductivity, mS/dm
0 Λm Molar conductivity at infinite dilution, S m2 mol−1
Λm Molar conductivity, S m2 mol−1


