Impact Factor : 0.548
- NLM ID: 101723284
- OCoLC: 999826537
- LCCN: 2017202541
Wataru Ochiai*1, Ryosuke Miki2, Mari Fukuda1, Haruka Kato1, Yuya Nakajo1, Ryuki Iimura1, Jo Hatogai1, Shohei Harada1, Satoshi Kitaoka1, and Kiyoshi Sugiyama2
Received: June 03, 2018; Published: June 12, 2018
*Corresponding author: Wataru Ochiai, Department of Clinical Pharmacokinetics, Hoshi University, Japan
DOI: 10.26717/BJSTR.2018.05.001206
Pregnane X receptor (PXR) is a nuclear receptor that exists in forms such as PXR1 and PXR2. Activated PXR1 heterodimerizes with retinoid X receptor to increase the transcription of cytochrome P450 3A (CYP3A), a drug-metabolizing enzyme, by binding to the PXR biding site in nuclei. PXR2 is a splice variant of PXR1, which is localized to the nuclei and down regulates the transcription of CYP3A by PXR1. The present study investigated the roles of PXR1 and PXR2 in the regulation of CYP3A11 expression in adult mouse organs and primary cultured hepatocytes. In the liver and small intestine, which show high expression of CYP3A11 mRNA, PXR1 mRNA was highly expressed while PXR2 mRNA expression was low. In the lung, kidneys, heart, and stomach, which show low expression of CYP3A11 mRNA, both PXR1 and PXR2 mRNA were expressed at high levels. In the muscle and spleen, which express little CYP3A11 mRNA, both PXR1 and PXR2 mRNA were expressed at low levels. In primary-cultured hepatocytes, PXR1 mRNA was expressed at high levels on day 0 of culture, and markedly decreased beginning on day 1. PXR2 mRNA was expressed at low levels on day 0, and gradually increased until day 5. CYP3A11 mRNA exhibited a different expression pattern from that of PXR1 or PXR2; expression peaked on day 0 and then gradually decreased. These results suggest that CYP3A11 expression is upregulated by PXR1 and downregulated by PXR2.
Keywords: PXR1, PXR2, CYP3A11, Hepatocyte, Liver
Abbreviations: VDR: Vitamin D receptor, PXR: Pregnane X Receptor, CAR: Constitutive Androstane Receptor, RXR: Retinoid X Receptor
Nuclear receptors are ligand-dependent transcription factors that regulate the expression of target genes in response to various stimuli, including physiological factors and environmental factors Evans [1]. The results of genome sequencing have identified 48 nuclear receptors in humans and 49 nuclear receptors in mice Zhang [2]. The identified nuclear receptors include steroid hormone receptors that bind to biological substances such as glucocorticoid and estrogen, and nuclear receptors for which the ligands and physiological functions are unknown Glass [3]. Most of these nuclear receptors interact with lipid-soluble low molecular weight compounds and to contribute to drug metabolism, metabolic disorders such as diabetes and dyslipidemia, cancer cell proliferation, sex differentiation, and regeneration; therefore, nuclear receptors have gained attention as drug targets [4-12,14]. The expression of drug-metabolizing enzymes is regulated by nuclear receptors Sueyoshi & Negishi [13]. Cytochrome P450 (CYP3A), an important drug metabolizing enzyme, is involved in the metabolism of more than 50% of currently available pharmaceutical preparations.
Changes in the expression level of CYP3A can alter the effects of many pharmaceutical preparations, affecting drug therapy. The expression level of CYP3A is regulated by nuclear receptors, including pregnane X receptor (PXR) [14-18], Constitutive Androstane Receptor (CAR) [19-21], and Vitamin D receptor (VDR) [22,23]. PXR is known to be highly expressed in the liver [24,25] and small intestine Cheng & Klaassen [26]. This nuclear receptor is typically localized in the cytoplasm in the absence of ligands; however, once activated by ligand binding, it is transferred to the nucleus Glass [3], where it heterodimerizes with retinoid X receptor α (RXR) and activates the transcription of target genes [27,28], by binding to the PXR response elements [16,29,30]. The other main target genes of PXR in addition to CYP3A include uridine diphosphate-glucuronosyltransferase, which has also been implicated in drug metabolism Buckley & Klaassen [31].
PXR has recently been shown to exist as five different subtypes Gardner-Stephen et al. [32] in humans and two subtypes, PXR1 and PXR2, in mice Matic et al. [33]. PXR2 is a splice variant lacking a part of the amino acid sequence (exon 5) from PXR1. PXR1 is considered to have similar functions as PXR, which have been previously reported. PXR2 localizes to the nucleus but inhibits the activated transcription of target genes by PXR1 Matic et al. [33]. PXR1 is transferred from the cytoplasm to the nucleus in a ligand-dependent manner and activates the transcription of target genes, whereas PXR2 is localized to the nucleus and inhibits the activated transcription of target genes by PXR1. A luciferase assay using a CYP3A promoter demonstrated that the activated transcription of CYP3A11 mRNA by PXR1 was dose-dependently inhibited by PXR2 Matic et al. [33]. In most studies to date, however, drug-metabolizing enzymes were analyzed without considering the existence of PXR2, a splice variant of PXR1; thus, the functions of PXR in regulating drug-metabolizing enzymes remain unclear. In fact, it was reported that CYP3A was highly expressed in PXR knockout mice [28,34], suggesting that PXR1 and PXR2 should be analyzed separately. The present study differentiated between PXR1 and PXR2 and investigated the roles of each nuclear receptor in CYP3A expression.
Mice received an intraperitoneal injection of pentobarbital sodium salt (50mg/kg) and were laparotomized under anesthesia. Preperfusion was flushed through the hepatic portal vein for 10min using Micro Tube Pump(MP-1000, EYELA, Tokyo Rikakikai Co. Ltd., Tokyo, Japan), followed by a collagenase solution for 15 min in the same manner as the preperfusion. The liver was then isolated and homogenized in D-MEM to prepare a hepatocyte solution. The hepatocyte solution was filtered through the Cell Strainer (70μm Nylon, BD Biosciences, Franklin Lakes, NJ, USA) and centrifuged (H-18F, Kokusan Co. Ltd., Saitama, Japan) at 500g for 3min at room temperature. After removing the supernatant, the cells were suspended in 30ml of 1:10 diluted HBSS and centrifuged at 500 g for 3min at room temperature.
This washing process was repeated three times. After removing the supernatant, the cells were suspended in 10 ml of D-MEM to prepare a hepatocyte suspension. A 10μl aliquot of the hepatocyte suspension was mixed with 10 μl of Trypan blue (Logos Biology, Annandale, VA, USA) to determine the cell count and cell viability using a cell counter (Logos Biology). In subsequent experiments, a hepatocyte suspension with a cell viability of ≥ 90% was used. The hepatocyte suspension was diluted with D-MEM (Sigma-Aldrich, St. Louis, MO, USA) to 1.0 105 cell/ml, seeded into a 10cm collagen- coated dish (10ml/dish), and incubated for 1hr to enhance cell viability before the medium was replaced.
To each organ, weighing approximately 30mg, in a 2ml tube, 1ml of the TRIⓇ reagent was added, and the sample was homogenized for 10s using a homogenizer (Physcotron NS-51, Microtec Co., Ltd., Chiba, Japan). The homogenate was vortexed (G-560, Scientific Industries, Bohemia, NY, USA) and allowed to stand at room temperature for 10min, and then 200μl of chloroform was added. The sample was vortexed and then allowed to stand at room temperature for 2min. The resultant solution was centrifuged (CF16RX, Hitachi Koki Co., Ltd., Tokyo, Japan) at 12,000 g at 4°C for 15 min and a 400μl aliquot of the supernatant was placed in a 1.5mL microtube. To this sample, 400μl of 2-propanol was added, and the mixture was vortexed, allowed to stand at room temperature for 10min, and then centrifuged at 12,000 g at 4°C for 10min. After removing the supernatant, the precipitate was suspended in 1ml of 70% ethanol (7: 3 ethanol: ultrapure water) and vortexed, followed by centrifugation at 7500 g at 4°C for 5min. The supernatant was discarded and the remaining ethanol was evaporated. To the precipitate, 300 μL of ultrapure water was added to dissolve the RNA. Using an aliquot of the resultant solution, absorption spectra at 260nm and 280nm were measured using the Nano Drop Lite (NDL, Thermo Fisher Scientific, Waltham, MA, USA) to determine the RNA concentration (μg/ml) and RNA purity.
From 1.0μg of the total purified RNA, cDNA was synthesized using a high-capacity cDNA synthesis kit. For each sample, 2.0μl of 10X reverse transcription (RT) buffer, 0.8μL of 25X dNTP mix, 2.0μL of 10X RT random primer, 1.0μl of Multi Scribe TM reverse transcriptase, 1.0μL of RNase inhibitor, and 3.2μl ultrapure water, which were all included in the high-capacity cDNA synthesis kit, were mixed on ice to prepare the 2X RT master mix. On a PCR plate, 10μl of 2X RT master mix and 1.0μg of purified RNA were added and mixed. The mixture was incubated in an iQTM Thermal Cycler (582BR, Bio-Rad, Hercules, CA, USA) at 25°C for 10min (Step 1), at 37°C for 120min (Step 2), and at 85°C for 10min (Step 3) for the reverse transcription reaction. The reaction mixture was diluted with TE buffer at a ratio of 1: 20 to prepare the cDNA solution.
In each of the PCR 8-strip tubes, 0.1 μl of TaKaRa Ex TaqTM (Shiga, Japan), 2.5μl of 10X buffer, 2.0 μl of Dntp mixture, 1.25μl of DMSO, 1.0 μl of cDNA solution, 2.5 μl of forward primer (20 X M) of the target gene, 2.5 μl of reverse primer (20 X M) of the target gene, and 13.15 μl of ultrapure water were added. DNA amplification was performed by repeating 30–45 cycles of denaturation at 94°C for 2min, followed by 98°C for 10s, annealing at 55–58°C for 30s, and elongation at 72°C for 30s, and elongation at 72°C for 90s, using the iQTM Thermal Cycler. The sequences of PXR1, PXR2, CYP3A11, and glyceraldehyde-3-phosphate dehydrogenase (GAPDH) used as the housekeeping gene were as follows: PXR1 and PXR2 forward, 5’-GAA AAG ATT GAG GCT CCA CC-3’; PXR1 and PXR2 reverse, 5’- GCG TCA ACT TCG CCA AA-3’; CYP3A11 forward, CGC CTC TCC TTG CTG TCA CA-3’; CYP3A11 reverse, 5’-CTT TGC CTT CTG CCT CAA GT; GAPDH forward, 5’-GGC AAA TTC AAC GGC ACA GT; GAPDH reverse, AGA TGG TGA TGG GCT TCC C-3’.
A mixture of the PCR product and 1.0μl of loading buffer was electrophoresed (10μl per lane) on a 2.0% agarose gel containing ethidium bromide and TBE buffer at 100V for 25min at room temperature under light-shielded conditions. After electrophoresis, the agarose gel was imaged using a cooled CCD camera (LAS-3000 mini, Fuji Photo Film Co, Ltd., Tokyo, Japan) and the obtained image was analyzed using Multi Gauge V3.0 (Fuji Photo Film Co. Ltd.).
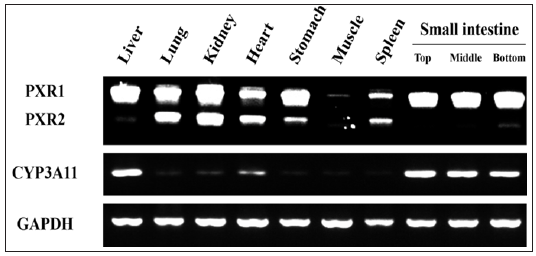
The expression levels of PXR1, PXR2, and CYP3A11 mRNA in adult mice organs were measured by RT-PCR (Figure1). In the liver and small intestine, PXR1 mRNA was expressed at markedly high levels and PXR2 mRNA at markedly low levels. The expression levels of CYP3A11 mRNA in the liver and small intestine were much higher than in other organs. In the lung, kidney, heart, and stomach, PXR2 and PXR1 mRNA were highly expressed, while the expression levels of CYP3A11 mRNA were much lower than in the liver. In the skeletal muscle and spleen, PXR1 and PXR2 mRNA expression was low and similar, and CYP3A11 mRNA was minimally expressed.
Figure 1: Expression patterns of PXR1, PXR2 and CYP3A11 mRNA in adult mouse organs.
Note: Organs were isolated from adult mice, and total RNA in the organs was purified and reverse transcripted. The expression levels of PXR1, PXR2 and CYP3A11 mRNA were measured by PCR.

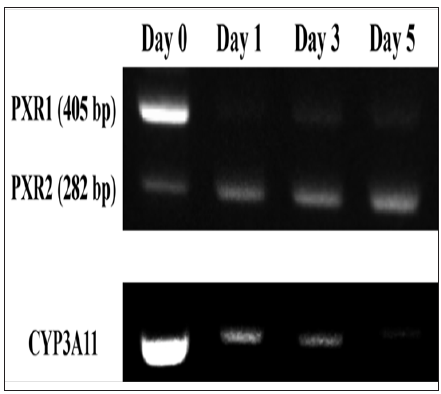
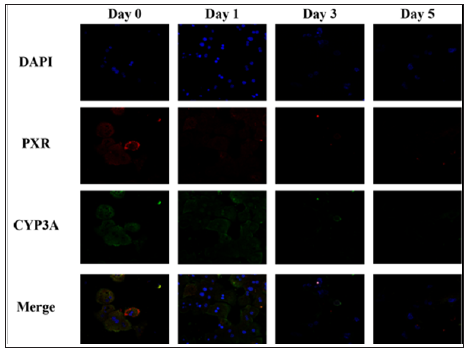
The expression level of PXR1 mRNA was several-fold higher than that of PXR2 mRNA at the beginning of culture (day 0). On day 1, the expression level of PXR1 mRNA decreased to less than 10% of that at the beginning of culture and it remained low thereafter. The expression level of PXR2 mRNA, however, exhibited an approximately two-fold increase on day 1 compared with that at the beginning of culture, and further increased by approximately 3-fold on day 5. The expression level of CYP3A11 mRNA was extremely high on day 0, but markedly decreased on day 1, which continuously declined to approximately 20% of that at the beginning of culture by day 5 (Figure 2) . The expression levels of PXR and CYP3A on days 0, 1, 3, and 5 were analyzed by immuno staining (Figure 3). Although we wished to differentiate between PXR1 and PXR2, there are no available antibodies to enable the individual recognition of PXR1 and PXR2; therefore PXR was analyzed using an antibody that recognizes both PXR1 and PXR2. The expression levels of both PXR and CYP3A in primary-culture hepatocytes were high on day 0, but rapidly decreased on day 1, with minimal signals observed on day 3 (Figure 3).
Figure 2: Changes over time in the expression levels of PXR1, PXR2 and CYP3A11 mRNA in primary cultured hepatocytes.
Note: From the primary cultured hepatocytes on day 0, 1, 3 and 5 of culture, mRNA was extracted to measure the expression levels of PXR1, PXR2 and CYP3A11 by RTPCR. The expression levels of PXR1 and PXR2 mRNA were determined assuming expression levels of PXR1 mRNA at the beginning of culture (day 0) to be 100%. The expression level of CYP3A11 mRNA was determined assuming the expression level at the beginning of culture to be 100.

Figure 3: Changes over time in PXR and CYP3A in primary-cultured hepatocytes.
Note: The primary-cultured hepatocytes on days 0, 1, 3 and 5 of culture were fixed and stained using an anti- PXR antibody and anti-CYP3A antibody, to analyze the expression patterns of PXR and CYP3A.

CYP3A is a drug-metabolizing enzyme involved in the pharmacokinetics and appropriate use of drugs. Since PXR is an important nuclear receptor regulating the transcription of CYP3A, it has been extensively studied; it was recently revealed that the nuclear receptor PXR has different isoforms (Matic et al., 2010), and no studies have identified the individual PXR isoforms. Thus, the roles of PXR in the regulation of CYP3A expression remain unclear. In the present study, we determined the expression levels of PXR1, PXR2, and CYP3A mRNA in adult mice organs to conducted detailed examination of the roles of PXR in the regulation of CYP3A expression. In addition, endogenous PXR1 and PXR2 mRNA in primary-cultured hepatocytes were separately analyzed to evaluate the impact of changes in the expression of PXR1 and PXR2 mRNA on CYP3A11 expression. Our results revealed significantly higher expression of PXR1 mRNA and significantly lower expression of PXR2 mRNA in the liver and small intestine, with high expression of CYP3A11 mRNA. In comparison, the lung, kidneys, heart, and stomach, which showed low expression of CYP3A11 mRNA, showed high expression of both PXR1 and PXR2 mRNA (Figure 1). These findings indicate that the expression level of CYP3A11 was not only regulated by PXR1, which activates the transcription of CYP3A11 in a ligand-dependent manner, but also by PXR2, in differentiated cells (organs) with minimal proliferation. Unlike tissue cells, primary cultured hepatocytes show mitotic activity. In such hepatocytes, the expression pattern of CYP3A11 mRNA was not completely consistent with that of PXR1 mRNA and was not similar to that of PXR2 mRNA (Figure 2). These results suggest that the expression level of CYP3A11 is regulated by both PXR1 and PXR2 in primary cultured hepatocytes.
The expression levels of PXR1 and PXR2 were also analyzed on the protein level. Since there are no antibodies that can differentiate between PXR1 and PXR2, an existing anti-PXR antibody was employed. It has been reported that PXR1 is localized to the cytoplasm and nucleus and that PXR2 is localized only to the nucleus; thus, the signals observed in the cytoplasm by immunostaining of primary cultured hepatocytes can be attributed to PXR1 and the intensity of fluorescence signals in the nucleus was produced by a combination of activated PXR1 and PXR2 (Figure 3). Although a definite conclusion cannot be derived only from the results of the present study, the expression of CYP3A is considered to be regulated by the interaction between PXR1 and PXR2. If an antibody that recognizes the 41 amino acid residues present only in PXR1 can be produced, it may be possible to obtain more in-depth information.
To determine the expression level of CYP3A11, it is necessary to accurately determine the expression level of PXR, a transcription factor of CYP3A11. However, the results of the present study indicate that the exact expression level of CYP3A11 cannot be derived from the total PXR expression level without distinguishing between PXR1 and PXR2, which is commonly used to evaluate the expression level of CYP3A11. Our results also suggest that PXR1 and PXR2 have different functions in CYP3A11 expression; PXR1 activates the expression of CYP3A11, whereas PXR2 suppresses its expression. Therefore, PXR1 and PXR2 should be individually analyzed to evaluate the function of PXR.
We thank Ms. Misa Iizuka, Ms. Konomi Oba, Mr. Osamu Kosaka, Ms. Saori Tomita, Ms. Mami Nakai, Mr. Hiroyuki Yoshida, and Ms. Tomoka Yasukawa for their technical assistance. We would like to thank Editage (www.editage.jp) for English language editing.


