Impact Factor : 0.548
- NLM ID: 101723284
- OCoLC: 999826537
- LCCN: 2017202541
Wojciech Kwasniewski1, Anna GozdzickaJozefiak2, Grzegorz Polak1, Witold Nowak3, Anna Kwasniewska4, Jan Kotarski1 and Maria WolunCholewa*5
Received: April 23, 2018; Published: May 09, 2018
*Corresponding author: Maria Wolun Cholewa, Department of Cell Biology, Poznan University of Medical Sciences, Rokietnicka 5D, 60-806 Poznan, Poland
DOI: 10.26717/BJSTR.2018.04.001051
Results of recent studies showed that the insulin growth factor (IGF) pathway might be implicated in the development of epithelial ovarian cancer (EOC). Moreover, it was demonstrated that EOC cells with high microsatellite instability (MSI-H; non19/non19) accumulate mutations in the IGF-1 gene. The aim of our study was to analyses the (CA)n repeats polymorphism in the P1 promoter region of the IGF-1 gene in EOC and healthy volunteers.For identification of (CA)n repeats PCR and DNA sequencing were utilised. Serum blood concentrations of IGF-1, IGFBP-1, IGFBP-3 were determined with ELISA. IGF-1 expression was assessed by immunohistochemical analysis. According to the obtained results biological samples were classified as microsatellite instability-high (MSI-H), MSI low (MSI-L) and microsatellite stable (MSS).
The results of the study showed that the most frequent genotype in the control group was MSS and in the EOC group - MSI-H. The IGF-1 level was positively correlated with IGFBP-3 in the MSS and MSI-H genotypes, only. The number of IGF-1-immunopositive cells did not differ between histopathological tissue types. Taking into consideration the genetic instability, the number of IGF-1-immunopositive cells in control group was significantly higher in MSS than in MSI-L and MSI-H genotypes. Between MSI-L and MSI-H genotypes, there was no difference in the number of IGF-1-immunopositive cells. In cancer cells, the number of IGF-1-immunopositive cells did not differ significantly depending on the type of instability observed. Regarding the histopathological diagnosis, low, as well as high instability profiles, were characterized by significantly higher number of IGF-1-immunopositive cells in cancer group. No significant differences were found in MSS profile in the number of IGF-1-immunopositive cells between the control and cancer groups.Present study suggests that IGF-1 (CA)19 gene polymorphisms are associated with occurrence EOC in Caucasian females.
Keywords: CA (19)n P1IGF-I Repeats, IGF-1, IGFBP-1, IGFBP-3, Epithelial Invasive Ovarian Cancer
Abbrevations: EOC: Epithelial Invasive Ovarian Cancer, CA: Cytosine Adenosine, FIGO: International Federation of Gynecology and Obstetrics, ELISA: Enzyme-Linked Immunosorbent Assay, t-SNPs: Tag Single- Nucleotide Polymorphisms
Epithelial invasive ovarian cancer (EOC) is the second most common gynecological malignancy [1] and one of the ten types of cancers with the highest incidence and mortality rates [2]. It is considered to be a challenge of 21st century medicine because approximately 77-78% of the cases are still diagnosed in advanced stages III or IV [3]. In 2011, the results of PLCO trial (Prostate, Lung, Colorectal, Ovarian Cancer Screening) have concluded that all screening tests have no contribution in a decrease of mortality due to ovarian cancer and in 2017 the results of a collaborative re-analysis from Ovarian Cancer Cohort Consortium suggested that IGF-1 concentrations are inversely associated with EOC risk independent of histological phenotype [4-5].The role of IGF system components in carcinogenesis of ovarian cancer was based on investigative epidemiological results, experiments in vivo and in vitro and on attempts of application of drugs affecting the IGF axis [6]. Investigative hypotheses in original studies were based on biological functions manifested by the entire family of IGF (ligands, receptors, binding proteins, adaptor molecules) [6].
Such functions of IGF family as intensification of proliferation, inhibition of cell apoptosis as well as influence on cell transformation through synthesis of several regulatory proteins may play a role in the process of carcinogenesis. Interactions of IGF axis components were described to be of a direct or indirect nature. The direct effects are related to activation of PI3K/Akt signaling pathway, in which the initiating role is played by, first, IGF-1 and its receptor IGF-1R. Activity of this signaling pathway leads to increased processes zof mutagenesis and cell cycle progression, as well as protection against different apoptotic stresses. Indirect effects of IGF axis are linked with interactions between IGFs and other molecules important for cancer aetiology, such as sex hormones, products if suppressor genes, viruses, other growth factors, and the style of life (e.g. nutrition or physical activity). In oncogenesis of many cancers also age of the patient remains of crucial importance, which is also reflected by dysregulation in IGF axis [4-6].
From the clinical point of view, components of IGF system are considered as diagnostic blood and/or tissue markers of cancer, prognostic factors and attractive target of anti-tumours therapies. Several mechanisms in which IGF system components act in the process of carcinogenesis await clarification, mainly due to multifactorial aetiology of the diseases (lung, skin, breast, prostate, cervix, colorectal, gastric, pancreatic, liver cancers). Pinpointing of the role played in the cancer pathogenesis by any single signaling pathway remains to be particularly difficult [6-7]. Gene encoding human protein IGF-1, which is located in the long arm of chromosome 12 (12q22-24.1), covers an area of approximately 90kbp and contains 6 exons separated by very long (1.9-50kbp) introns. The sequence of the IGF-1 gene is very conservative and its transcription was found to be regulated by two promoters: P1 and P2. Approximately 90% of IGF-1 transcripts remain under the control of P1. The P1 promoter region of the human genome consists of 322 nucleotides placed in the region of 5’UTR and exon 1 of the regulatory region in 1630.
The most conservative is a 322-nucleotide stretch of 5’UTR. The P1 promoter lacks typical sequences of other genes, such as TATA or CCAAT elements, and the rest of the area is rich in GC. The P1 promoter has five sections protected from DNase digestion: HS3A, HS3B, HS3C, HS3D and HS3E. The HS3D place is thought to be responsible for the regulation of IGF-1 gene expression by estrogens [8-9]. 5’(CA)n repeats in the P1 promoter region of the IGF-1 gene, 1kb upstream from the transcription site, are a highly polymorphic microsatellite, comprising a variable length of a cytosine-adenosine (CA) repeat sequences. The number of (CA)n repeats ranges between 10 to 24 with the most common allele containing 19 (CA) (192 bp) repeats, characteristic for Caucasians [8-9]. Many studies suggest that the number of (CA)n repeats in the promoter region may be inversely correlated with the transcriptional activity. In the literature, the involvement of the polymorphism of CA promoter dinucleotide repeats is still controversial in clinical disorders such as cancer, diabetes mellitus and cardiovascular diseases [10-12].
To verify the hypothesis that IGF-1 (CA)n gene polymorphisms are associated with occurrence epithelial ovary cancer in Caucasian females, we identified (CA)n repeats in the P1 region of IGF- 1 gene, IGF-1, IGFBP-1, IGFBP-3 blood serum levels as well as IGF-1 expression in healthy and EOC tissues. It is worth noting that, hitherto no studies related to ovarian cancer stages and the microsatellite polymorphism in the P1 promoter region of the IGF-1 gene were reported.
The study was accepted by the Ethics Committee of the Medical University of Lublin (Lublin, Poland; Resolution of the Bioethics Committee no. 0254/263/2011). The research was conducted in accordance with the principles of the Helsinki Declaration, and written informed consent was gained from all subjects included.
Patient samples used for CA repeat analysis of the P1 promoter region of the IGF1 gene, as well as used for the assessment of IGF1 levels, comprised: I) peripheral blood obtained from the antecubital vein prior to surgery from patients enrolled in the present study and II) tissue sections embedded in paraffin (Sigma-Aldrich, St. Louis, MO, USA) from patients who underwent surgery at the Department of Gynecological Oncology and Gynecology, Medical University of Lublin (Lublin, Poland) from November 2010 to December 2016. 33 tissue samples were taken in total from postmenopausal women with epithelial ovarian cancer (EOC). All patients with EOC underwent radical surgery. For staging of ovarian cancer, the FIGO (International Federation of Gynecology and Obstetrics) criteria from 2010 (7th edition) was used. The number of samples classified as FIGO stages I, II, III C and IV were 4 (12.1%), 6 (18.2%), 18 (54.5%) and 5 (15.2%), respectively.
Diagnosis and reclassification was performed histologically by two independent pathologists. Furthermore, tissue samples from postmenopausal women with were used. The control group consisted of 27 tissue samples from patients referred to the department for diagnostic procedures of tumorovarii in which histopathological examination found cystic simplex ovarii or cystic follicular is ovarii. Patients with the following complaints like: hormone replacement therapy, other types of cancer, systemic diseases, ischemic heart disease, peripheral vascular diseases, thyroid diseases and/or other endocrine diseases as well as liver and bile duct diseases were excluded from the research. The mean age of the patients with EOC group was 538 (range: 27-76) years. The average age in the control group was 497 (range: 20-71) (p=0.78).
Enzyme-linked immunosorbent assay (ELISA), DNA isolation from peripheral blood cells and from paraffin-embedded tissue sections and as well the immunohistochemical analysis of IGF 1 expression was performed as previously described [13-14].
For the evaluation of immunohistochemical staining, two independent pathologists using the Cell2 software, version 4.1 (Poznan University of Medical Sciences, Poznań, Poland) conducted an evaluation of immunohistochemical staining.The scoring method was based on the analysis of the distribution of colors and their diversification of the optical density. The software identifies cellswith an optical density greater than the background and classifies them as immune reactive based on the color ratio. To determine the percentage of positive cells in sections, they were divided by the total number of immune positive cells. At least 5000 cells were counted for each of the analyzed groups. The researcher, who was blinded in terms of the identity of the samples, did all the analysis.
Statistical analyses were performed using Statistica software version 8.0 (StatSoft, Krakow, Poland) using the following tests: the χ2 test, Shapiro Wilk test, the Mann Whitney U test, the Kruskal Wallis, test with Dunn’s post test and Spearman’s rank correlation coefficients. Analysis assumed a 5% error of inference and the associated significance level of P<0.05 was considered to indicate a statistically significant difference.
DNA from the blood and tissue of the study patients was isolated and the correlation between the CA repeats situated in the P1 promoter region of the IGF1 gene, blood serum and tissue level of IGF1 and risk of epithelial invasive ovarian cancer development was investigated. The IGF1 genotype distribution in the total cohort and subcategories is shown in Table 1. The length range of (CA)n repeats in the study DNA was 17 to 21. Depending on the single nucleotide CA polymorphism in the study group of women we distinguished three genotypes: MSS - carried a (CA)19 repeat alleles, MSI-L - carried only one CA 19 allele, and MSI-H with lacking (CA)19 repeat alleles. The most common genotype in the blood serum and tissues of the control group was homozygote CA19 repeat (genotype MSS, 20(27);74%). Among women with epithelial ovarian cancer (EOC), the genotype MSS was observed in the DNA from the serum and the tissue in 23.1% and 9.1% cases, respectively.
Table 1:Comparison of microsatellite instability evaluation (CA)n repeats in DNA isolated from peripheral blood cells and paraffin tissues of patients from the study (EOC) and the control group.

aComparison of CA repeats in DNA isolated from serum and tissue between control and epithelial ovariancancer; bcomparison of (CA)n repeats in DNA within control and epithelial ovarian cancer between serum and tissue. IGF, insulin like growth factor; MSS, microsatellite stable; MSI-L, microsatellite instability low; MSI-H, microsatellite instability high; N, number of subjects with the respective genotype
On the basis of statistical analyses, no significant association between serum and tissue genotype frequency was detected in either patient group (P valueb). However, the most frequent genotype in the control group was MSS (p<0.01) and in the ovarian cancer group – MSI-H (p<0.01). These results suggest that the risk of ovarian cancer is higher in women carrying alleles other than 19 (Table 1).
Table 2:Comparison of microsatellite instability evaluation (CA)n repeats in DNA isolated from peripheral blood cells and paraffin tissues of patients from the study (EOC) and the control group.

n – number, Me – median, SD – standard deviation, p – probability, Q1 – lower quartile, Q3 – upper quartile,Min-Max – minimummaximum range, EOC - epithelial ovarian cancer
The IGF-1, IGFBP-1 and IGFBP-3 blood serum levels for the study and reference groups of women are shown in Table 2. No statistically significant differences in IGF-1, IGFBP-1 and IGFBP-3 serum concentrations between the control and EOC were found.
To further evaluate whether blood serum IGF-1, IGFBP-1 and IGFBP-3 concentrations were linked to the genotype of IGF 1, we analyzed the association of IGF -1 genotypes (MSS, MSI-L and MSI-H) with IGFBP-1 and IGFBP-3 levels among the control and ovarian cancer group. The IGF-1 level was positively correlated with IGFBP-3 in the MSS and MSI-H types of the IGF 1 genotype (r=0.295, p=0.01 and r=0.4481, p=0.003), respectively (Tables 2 & 3).
Table 3:Spearman rank correlation coefficients for the correlation of blood serum levels of IGF 1 with IGFBP 1 and IGFBP 3 levels for the MSS, MSI-L and MSI-H genotypes among patients with EOC.

aP<0.05. IGF, insulin-like growth factor; MSS, microsatellite stable; MSI-L, microsatellite instability low; MSI-H, micro satellite instability high; EOC, epithelial ovarian cancer.
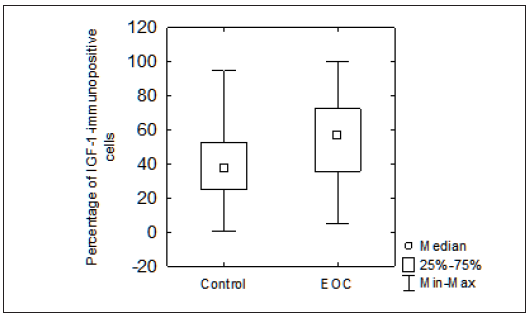
Taking into consideration the histopathology diagnosis type, the number of IGF-1-immunopositive cells did not differ significantly between control and epithelial ovary cancer group (p=0,318695, Figure 1). As shown in Figure 2, noteworthy is the observation, that if the analysis additionally takes into consideration the type of genetic instability, the number of IGF-1 immunopositive cells in control group was significantly higher in the MSS genotype than in instability of MSI-L and MSI-H genotype (p=0,000001 and p=0,000458, respectively). Moreover, between MSI-L and MSI-H genotype there was no difference in the number of IGF- 1-immunopositive cells (p=0,99, Figure 2). In cancer cells (EOC group) the number of IGF-1-immunopositive cells did not differ significantly depending on the type of instability (p=0,4659, Figure 3). Regarding the instability profiles and then histopathological diagnosis, MSI-H and MSI-L profiles were characterized by significantly higher number of IGF-1-immunopositive cells in EOC group compared to the control (p=0,0027, Figure 4 and p=0,000682, Figures 5 & 6 respectively). As shown in Figure 6, in stable microsatellite profile (MSS profile) there was no statistically significant difference in the number of IGF-1-immunopositive cells between reference and cancer group (EOC) (p=0,1158).
Figure 1: Analysis of the Number of IGF-1-Immunopositive Cells in Control and Epithelial Ovarian Cancer (EOC) Group. The Number of IGF-1-Immunopositive Cells does not Differ Significantly Depending on the Type of Histopathological Diagnosis: Reference or Cancer (EOC) (p=0,318695). Small Squares Indicated the Median Value, Boxes Indicate the 25-75% Range and Bars Indicate the Minimum-Maximum Range. IGF, Insulin like Growth Factor; EOC, Epithelial Ovarian Cancer.
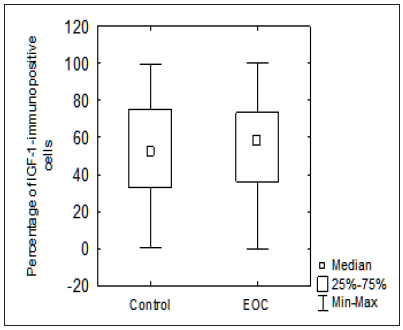
Figure 2: Analysis of the Number of IGF-1-Immunopositive Cells in Control Group Regarding MSS, MSI-L and MSI-H Genotypes. The Number of IGF-1-Expressing Cells in Control was Significantly Higher in the MSS Genotype Relative Instability of MSI-L and MSI-H Genotype (p=0,000001 and p=0,000458, respectively). Moreover, between MSI-L and MSI-H Genotype there was no Difference in the Number of IGF-1-Immunopositive Cells (p=0,99). Small Squares Indicated the Median Value, Boxes Indicate the 25-75% Range and Bars Indicate the Minimum-Maximum Range. IGF, Insulin Like Growth Factor; MSI-H, Microsatellite Instability-High, MSS, Microsatellite Stable; MSI-L, Microsatellite Instability-Low.
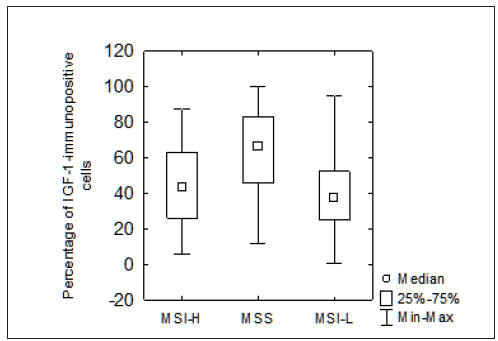
Figure 3: Analysis of the Number of IGF-1-Immunopositive Cells In Epithelial Ovarian Cancer Group (EOC) Regarding MSS, MSI-L and MSI-H Genotypes. The Number of IGF-1-Expressing Cells does not Differ Significantly Depending on the type of Instability (p=0,4659). Small Squares Indicated the Median Value, Boxes Indicate the 25-75% Range And Bars Indicate the Minimum-Maximum Range. IGF, Insulin Like Growth Factor; MSI-H, Microsatellite Instability-high, MSS, Microsatellite Stable; MSI-L, Microsatellite Instability-Low.

Figure 4: The number of IGF-1-Immunopositive Cells in MSI-H Profileof Instability Type Comparison between Control and Epithelial Ovarian Cancer Group (EOC). Significantly Higher Number of IGF-1-Immunopositive Cells in EOC group Compared to the Control was Observed (p=0,0027). Small Squares Indicated the Median Value, Boxes Indicate the 25-75% range and Bars Indicate the Minimum-Maximum Range. IGF, Insulin Like Growth Factor; Eoc, Epithelial Ovary Cancer.
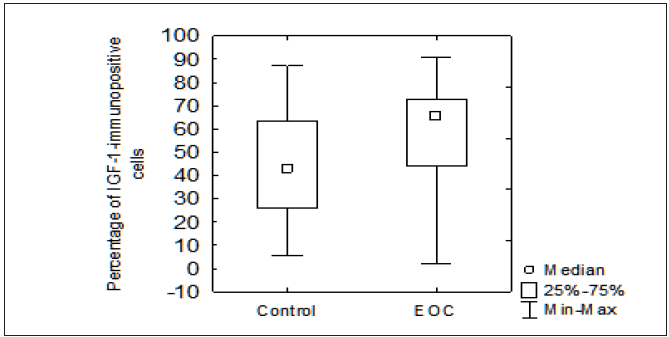
Figure 5: The Number of IGF-1-Immunopositive Cells in MSI-L Profileof Instability Type Comparison between Control and Epithelial Ovarian Cancer Group (EOC). In EOC Group Significantly Higher Number of IGF-1-Expressing Cells Compared to Control Was Determined (p=0,000682). Small Squares Indicated The Median Value, Boxes Indicate the 25-75% Range and Bars Indicate the Minimum-Maximum Range. IGF, Insulin Like Growth Factor; Eoc, Epithelial Ovary Cancer.
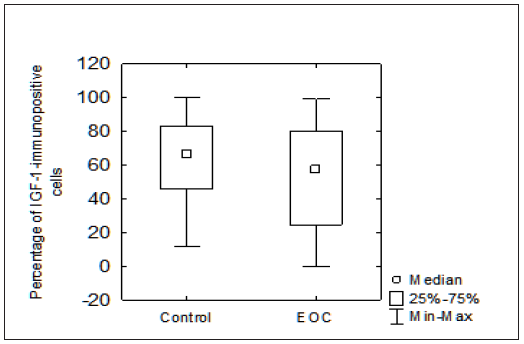
Figure 6: The Number of IGF-1-Immunopositive Cells in Microsatellite Stable Profile Type MSS Comparison Between Control and Epithelial Ovarian Cancer Group (EOC). In MSS Profile There Was No Statistically Significant Difference in the Number of IGF-1-Immunopositive Cells Between Control and Cancer Group (EOC) (p=0,1158). Small Squares Indicated the Median Value, Boxes Indicate the 25-75% Range and Bars Indicate the Minimum-Maximum Range. IGF, Insulin Like Growth Factor; Eoc, Epithelial Ovary Cancer.
The results of an epidemiological study show that higher IGF-1 concentrations are related with an elevated risk of gynecological cancers and ovarian tumours, particularly [6]. It was also found that tissue of ovarian cancer exhibits a high IGF-1 and low IGFBP expression. This finding has been reported in the 90s of 20th century by Kanethy et al. [16-17]. Similar data were obtained by Dursun, who demonstrated significantly higher IGF-1 and IGFBP-3 blood serum levels (p=0.01) in women under the age of 50 who underwent the surgery due to serous ovarian cancer [18]. A significant correlation between IGF-1 serum levels and ovarian cancer risk has been also reported in group of younger than 55 age women, by Lukanova et al. [19]. However, there are also studies demonstrating significantly lower IGF-1 serum concentrations in patients with malignant ovarian tumours that in the control groups [20]. Another large study involving a group of 222 cases and 5999 controls found no significant association between IGF-1, IGF-2, IGFBP-2 and -3 concentrations with ovarian cancer risk [21].
A meta-analysis of published studies concerning the relationship between circulating concentrations of IGF-1 and ovarian cancer risk was conducted by Li et al. [22]. Five eligible studies were included into the meta-analysis, which involved a total of 2,028 cases of women with ovarian cancer and 4,625 controls. Meta-analysis of 5 studies showed that high circulating IGF-1 concentration was significantly associated with a decreased risk of ovarian cancer (OR = 0.84, 95% CI 0.74-0.97, p= 0.013). High circulating levels of IGF-1 were associated with a decreased risk of ovarian cancer (OR = 0.83, 95%CI 0.72-0.95, p= 0.007) after adjusting for heterogeneity. An analysis by age revealed that circulating IGF-1 level was not related with ovarian cancer risk in women older than 55 years. However, after adjusting for heterogeneity, high circulating IGF-1 levels were connected with decreased ovarian cancer risk in women younger than 55 years old (OR = 0.82, 95%CI 0.72-0.94, P = 0.004). Ose et al. [4] hypothesized that circulating IGF-I would be differentially associated with ovarian cancer subtypes given the differential expression of IGF-I in low- and high-grade serous tumors [4].
Insulin-like growth factor I has been shown to be overexpressed in low-grade serous ovarian cancer cell lines (i.e., type I), which were more responsive to IGF-I stimulation and IGF- IR inhibition compared with high-grade serous ovarian cancer cell lines (i.e., type II) [23]. Ose et al. [4] did not observe the hypothesised associations; however, we had small sample size in some subgroups (i.e., low-grade serous tumours, n 1⁄4 35) [4]. In 2017 the results of a collaborative re-analysis from Ovarian Cancer Cohort Consortium have addressed the associationbetween doubling of IGF-I concentration and risk of EOC [ORlog2=0.82; CI 0.72-0.93]. Ose et al. [5] observed no heterogeneity by tumor characteristics (e.g., histology, p het=0.62), menopausal status at blood collection (p het=0.79), or age at diagnosis (p het=0.60) [5]. These authors suggested that IGF-1 concentrations are inversely associated with EOC risk independent of histological phenotype [5].
In the FP6 European Project “OVCAD”, 275 consecutive primary epithelial ovarian cancers were included from women after radical cytoreductive surgery and platinum-based chemotherapy [24]. The authors analyzed the predictive and prognostic role of circulatory IGF-1 levels in these patients and found that an increased plasma IGF-1 concentration was significantly more frequent in welldifferentiated epithelial OC. The weak correlation between IGF-1 and CA-125 levels was also demonstrated in women with serous epithelial OC. No association between IGF-1 expression and either clinicopathological data was observed [24].
Other alterations of IGF system components in ovarian cancers. In 2011 Pearce et al. [25] have published the results of multicenter study of white, non-Hispanic women [25]. The IGF implication in the pathogenesis of ovarian cancer has been analyzed. A control group and a study group included respectively, 1880 and 1456 patients. A study group consisted of 1135 patients with invasive epithelial ovarian carcinoma and 321 patients with borderline ovarian tumors.
The results have not confirmed the relationship between IGF- 1, IGFBP-1 and IGFBP-3 concentrations and the increased risk of epithelial ovarian cancer development. However, it has been demonstrated that the tag single- nucleotide polymorphisms (t-SNPs) in IGF-2 gene may significantly increase the development of epithelial ovarian cancer (p<0.05). Genotyping was performed in 3216 additional non-Hispanic white cases and 5382 additional controls. It has been also found that rs4320932 polymorphism is correlated with a 13% decreased risk of ovarian cancer (95% CI 0.81-0.93, p-trend=7.4x10⁻⁵).In turn, it has been demonstrated that the inactivating germ line mutation with BRCA1 and BRCA2 were found in a large proportion of families with ovarian cancer [26]. These mutation carriers have an increased life-time risk of developing ovarian cancer (16-64%) [23,27]. Brokaw have presented very interesting study [27-28]. They analyzed the IGF- 1 mRNA expression and IGFBP levels in patients with epithelial ovarian cancer and reported that high IGF1mRNA and IGFBP were associated with risk of disease progression.
Another study by Spentzos et al. [27] has reported that IGFBP-4 and IGF-2R gene expression were inversely associated with patient survival [27]. In turn, Tianusing a mass-action kinetic model- an immortalized ovarian cancer cell line- have proven that IGF-2R may play a role in the regulation of the activity of IGF-1R in different conditions and that due to their high expression levels, IGFBPs are dominant in regulating IGF network activation [29,30].
We have found an association of serum IGF- 1 levels and polymorphism in the CA repeat in the 5’ promoter region of IGF 1. IGF-1 was positively correlated with IGFBP-3 in the MSS and in the MSI-H groups. Circulating and tissue IGF-1 levels were lower in women who carried (CA)19 repeat alleles (MSS IGF-1 genotype) compared to those who did not (MSI-L and MSI-H genotypes). It indicates that lack of the (CA)19 allele is associated with a higher incidence of ovarian cancer. Cleveland reported that IGF-1 genotypes which include alleles with fewer than (CA)19 repeats appear to be associated with increased risk of breast cancer [31].
Other studies have also found an association between the number of IGF-1 CA repeat and breast cancer risk, while other have not [30- 32]. Zecevic suggested that IGF-1 variant genotypes may modify the risk of hereditary forms of cancer [33-35].
The immunohistochemical study indicated that in tissues with a genotype other than CA 19 the number of IGF-1 expressing cells was significantly higher. These findings confirm our previous results that IGF-1 genotypes other than (CA)19 are responsible for higher concentrations of IGF-1 in tissues and probably in autocrine stimulation of cancer development. However, ovarian cancer, like all cancers, is a multifactorial disease arising from multiple conditions that interact in complex ways.In conclusion, results of the present study suggest that genetic variations of IGF(CA)19 gene polymorphisms may influence ovarian cancer risk in Caucasian women. Ongoing studies will add to the long-term study group of women and give more strength to the present study. Further basic and clinical research studies, also at molecular levels, are needed to better clarify the functional role of this polymorphism and the complex relationships between the IGF-1 axis, IGF(CA)19 polymorphism and ovarian cancer risk.


