Impact Factor : 0.548
- NLM ID: 101723284
- OCoLC: 999826537
- LCCN: 2017202541
Walter R Schumm*
Received: February 28, 2018; Published: March 12, 2018
*Corresponding author: Walter R Schumm, School of Family Studies and Human Services, Kansas State University, 1700 Anderson Avenue, Manhattan, KS, USA
DOI: 10.26717/BJSTR.2018.03.000841
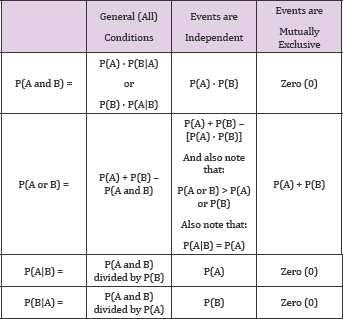
Many undergraduate and most graduate students will find it necessary, if not required, to take a basic course in probability and statistics. Since many academics use statistics more often than probability in performing data analyses for publication in scholarly journals, sections of such classes on probability may be slighted. Furthermore, many texts do not present a unified approach to probability formulas. Here a chart is presented that allows for an integration of formulas as a function of the key issue and the underlying conditions.
If you are teaching probability and statistics to undergraduate or graduate students, you may find that it is tempting to give greater emphasis to statistics because, as a faculty member, you may tend to use statistics more often in your academic research. Since you are trying to prepare students for real life, it may seem more logical to emphasize what they will use the most, which often will be statistics. However, probability is nevertheless important and in some cases very helpful. One approach that has been helpful in teaching statistics and probability has been to use historical examples Lee et al. [1]; Schumm et al. [2]. However, sometimes the way textbook material is presented is a problem by itself. One of the problems I have encountered in teaching probability and statistics for many years is that probability is often presented as a disconnected set of rules that leave students confused and alienated towards probability education.
I have found the following chart to be a helpful way to tie all the formulas together so that the student can easily determine which formulas will solve the given problem. For example, if you have a need to determine the joint probability of two events, P (A and B), the answer will depend on the conditions. If the events are independent, then P(A and B) will equal the product of P(A) times P(B), as you can find in the chart at the intersection of the row for P(A and B) and the column for independent events. However, if the events were mutually exclusive, then P (A and B) will be found to be zero, at the intersection of the row for P(A and B) and the column for mutually exclusive events.
However, keep in mind two things:
a) If the events are mutually exclusive, they are NOT independent [unless P (A) = 0 or P (B) = 0] If the events are independent, they are NOT mutually exclusive [unless P(A) = 0 or P(B) = 0].
b) The following chart may help:
The idea is that you match the row and columns to find the formula that works for any particular type of problem (Table 1).
Table 1: Note that events are either independent or mutually exclusive; unless P(A) = 0 or P(B) = 0, they cannot be both

There are other rules that can be provided to students:
a) 0 < P(A) < 1.0
b) 0 < P(B) < 1.0
c) 0 < P (A or B) < 1.0
d) 0 < P (A and B) < 1.0
e) 0 < P (A and B) < P (A or B)
f) P(A and B) < P(A)
g) P(A and B) < P(B)
h) P(A and Ac) = 0
i) P(A or Ac) = 1
j) P(A|Ac) = 0
k) P(B) • P(A|B) < P(A|B)
l) P(A|B) > P(A and B)
The goal of the above material is to summarize what may have taken an entire chapter in the average statistics book in a mere single sheet (both sides) of paper. This will greatly facilitate the average student's ability to work probability problems and to see how the different formulas are interconnected.


