info@biomedres.us
+1 (502) 904-2126
One Westbrook Corporate Center, Suite 300, Westchester, IL 60154, USA
Site Map
Received: December 04, 2017; Published: January 22, 2018
*Corresponding author: Joe Parcell, Department of Agricultural Economics, University of Missouri, Mumford Hall, MO 65211, Columbia
DOI: 10.26717/BJSTR.2018.02.000680
Globally, supply and demand factors have changed the edible vegetable oil industry. Agribusinesses have had to respond by reassessing their strategies – or their selected market positions and approach for successfully differentiating their businesses – and committing to a planning process that discovers and considers uncertainties and other factors that may change and challenge their businesses. This paper explains strategic planning in the global vegetable oil industry’s context and highlights factors that motivate U.S. and global agribusinesses to revise their oilseed business strategic plans: customer demands, economic conditions, policy and regulations, competitive product positioning and technical change.
Keywords: Vegetable Oils; Agribusiness; Strategy; Soybean
Globally, supply and demand factors have changed the edible vegetable oil industry. The Food and Agriculture Organization of the United Nations (FAOSTAT) reports that global edible vegetable oil allocated to food uses increased by about 48 percent from 1995 to 2011 (Figure 1) FAOSTAT [1]. Global income growth has spurred demand growth for oils used in food, fuel, and industrial applications. The same time, production technology advances have increased supply through yield improvements and productive land expansion. Shifts in competing oil uses have contributed to changes in availability and relative prices of different oil products, while more discriminating consumer preferences and regulations have altered supply and demand. To respond to market dynamics and identify a position for their operations, agribusinesses form strategic plans that account for projected market conditions and the firms’ response to them. The researchers’ objective is to summarize global edible oil consumption shifts, explain drivers that affect edible oil markets and illustrate the need for agribusinesses to revise their strategic plans in response to global edible oil market changes. The researcher’s shares worldwide data. However, the findings and discussion are particularly relevant for U.S. agribusinesses participating in an increasingly globalized food environment. Many points could inform strategies for firms located in other areas, but those strategies must adapt to local conditions.
Figure 1: World Vegetable Oil Food Supply Quantity.
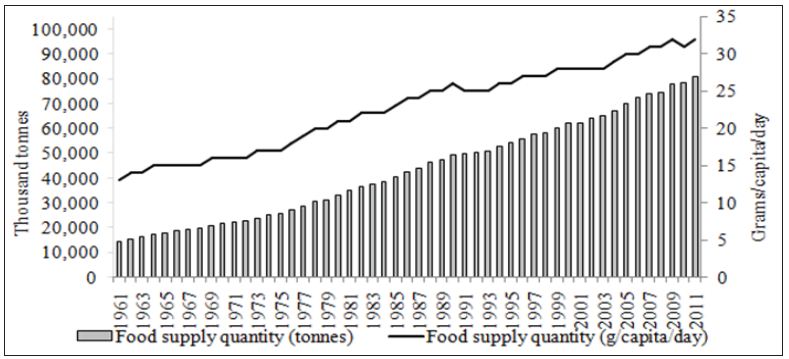
The paper also frames the discussion around soybean oil as structural change has especially affected this oil and reverberated to affect opportunities for other oils and innovation. Looking into the future, these global edible vegetable oil consumption trends will adjust based on structural change that arises. This would influence firms throughout the value chain from seed suppliers to retailers. For some firms–for example, those involved in the soybean oil value chain–prolonging the consumption trends indicated earlier would constrict their long-term marketing oil opportunities. To respond, firms would benefit from identifying the structural changes and strategic issues that contribute to these consumption patterns and account for these factors when planning their strategic outlooks. This research uses historical data analysis and environmental scanning as issue assessment tools. To evaluate customer demands, the paper uses economic models that consider World Bank income data and Food and Agriculture Organization of the United Nations population data as factors that cause a total consumption change.
The extent to which these factors motivate a total consumption change is known as the contribution rate. Preferences that consumers hold for oil products also influence customer demands. To estimate the effect of economic conditions on edible oil demand, the paper uses income to estimate the potential for purchasing oils or products made with oil. To assess policy and regulation effects, the paper tracks significant regulation and policy announcements and implementations, and correlates those events to demand shifts. The competitive product positioning component relies on analyzing fatty acid composition and summarizing industry positioning statements from trade associations that attempt to build demand for the given edible oils that they represent. Last, technological change considers the opportunity for innovation and its role in addressing strategic issues and opportunities.
Firms and industry stakeholders may use strategic planning to guide decision-making that allows them to respond to their external environments, leverage internal capabilities, serve customers, and successfully compete in the marketplace. Strategy is a firm’s ability to position its products or services differently from the positions held by competing products or services. Alternatively, a firm may be delivering a product or service similar to that provided by competitors but differ in the way it is conducting business Porter [2]. Strategy can also be defined as the process of selecting a market position that would allow a firm to successfully compete with its business rivals Martin [3]. Structural changes prompt firms and industries to evaluate and, if necessary, adopt their strategic directions. Boehlje et al. [4] identified that such uncertainties as business and operational factors, finances, market conditions, technological change, business relationships, and policy and regulations often drive strategic planning changes. Westgren categorized such uncertainties in the following groups - regulations and economic conditions; competitive factors, including customer demands and competitive product positioning; and internal factors, including finances. As uncertainties confronting agribusinesses have become more complex and time-sensitive over time, responding to them must be a dynamic process Boehlje [4].
Firms conduct strategic planning to discover and analyze relevant insights that could influence strategy Mintzberg [5]. Strategic planning relies on good information collected internally and externally. A firm controls its internal environment and can easily access internal data. A firm can’t control external factors, but such factors still influence performance. Managers may attend tradeshows, read industry publications, speak with colleagues, and analyze data to study the external environment Conley [6]. An external review allows a firm to evaluate its alignment with present and projected market conditions Westgren [7].
During strategic thinking phase, firms reference the insights collected, compiled, and analyzed, and they leverage those insights to brainstorm strategy and create a vision Mintzberg [5]. Although strategic planning relies on analyzing past and current conditions, it is a forward-looking process Conley [6]. A firm’s success depends on its capacity to successfully project future conditions and strategize opportunities in alignment with current and past conditions. Low-carbohydrate diets, as an example, gained popularity at one time, and carbohydrate related companies would have financially struggled if they hadn’t projected the trend and responded to it Gray [8].
Much literature concentrates on firm-level strategic processes and factors; however, industry stakeholders collectively may engage in strategic planning to become more competitive and improve its performance. Industry stakeholders may commit to strategic planning if regulations change, demand evolves, markets become more globalized, competitive forces strengthen, or customers elevate quality expectations Lyford [9].Strategic planning may take different forms. Conley [6] explains a balance sheet approach that analyzes historical commodity supply and disappearance data and evaluates prices. Other literature suggests that agribusinesses may use receipts data to compute indicator values that describe business environmental changes Lanyon & Abdalla [10]. At the industry level, a shift-share analysis is a tool that measures industry market share, market size, sales volume, and market segment values. A SWOT analysis that identifies strengths, weaknesses, opportunities, and threats is an alternative tool. Competitor analysis, which can consider substitutes and other competing products, and growth positioning, which assesses markets for future potential, are also tools Lyford. Boehlje [11] also include scorecarding, decision trees, and the real options theory to the set of tools used to inform strategy formation.
Firms that use strategic planning usually benefit from the process. A survey found that Michigan agribusinesses have dedicated more effort to formal strategic planning activities over time Lopes and Ross [12]. Furthermore, firms that set a mission and objectives, conducted an external industry analysis, and compiled annual operational and capital budgets with projected sales and cash flows – all of which are strategic planning activities – performed more positively than those that did not. Neve [13] describes a Chain Plan approach to strategic planning and management that takes a production system view. The method features processes that result in executing production system-wide strategic management. Hallmarks of the approach include creating a vertical organization that can implement strategies, developing a strategy for budgeting, committing administrative support, outlining incentives that would encourage good execution, facilitating a culture that emphasizes collective acceptance of the strategy, values, and ethics, and installing leadership that can manage the system well.
Fats have several roles in the body. They provide and store energy, form cell membranes, and facilitate fat-soluble vitamin absorption. Edible vegetable oils are versatile and may be a component of products including fried foods, mayonnaise, margarine, shortening, pharmaceuticals, and biofuels. Common edible oils include soybean, canola, palm, corn, coconut, cottonseed, olive, and sunflower oils, with soybean, canola and palm oils being the most widely consumed ones. The edible vegetable oil selected for a particular use depends on price and fatty acid profile, which indicates oil features and benefits. Oils are composed of saturated fats, which typically are stearic acid and palmitic acid; monounsaturated fat, which typically is oleic acid; and polyunsaturated fats, which typically are linolenic acid and linoleic acid. Each edible vegetable oil has a different fatty acid profile (Figure 2), POS Pilot Plant Corporation [14], ndb Malaysian Palm Oil Board [15] and Smith [16]. Fatty acid compositions may vary somewhat due to weather, geography, climate, planting date, and plant maturity (Shahidi 2005). Fatty acid levels make oil have certain characteristics (Table 1).
Figure 2: Fatty Acid Profiles of Common Edible Oils and Fats.
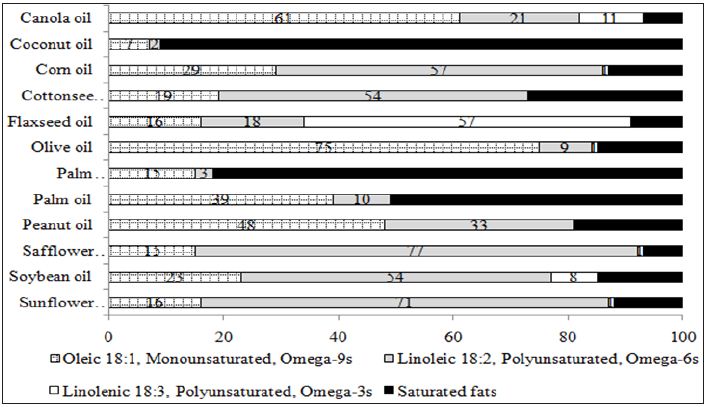
Table 1: Fatty Acid Attributes Summary.
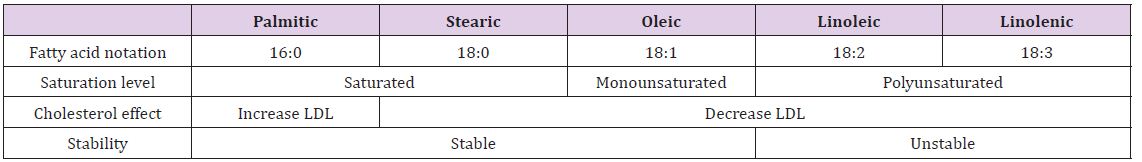
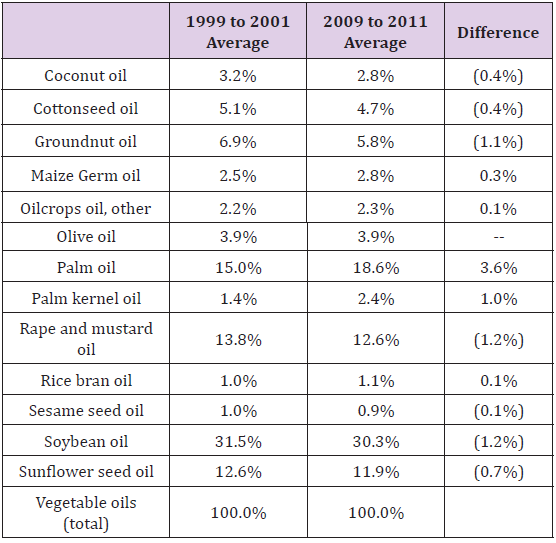
Oils with high oleic, linolenic and linoleic acid concentrations are liquid and may decrease LDL cholesterol levels, but those high in linolenic and linoleic acid are also unstable, meaning that they oxidize quickly and can become rancid. Unstable oils, including soybean oil, sunflower oil, and safflower oil, may not withstand high temperatures, and they may have limited shelf lives Advanta [17]. During the past decade, the global edible vegetable oils industry has experienced structural change that has heightened its need for firms and industry sectors to pursue strategic planning and consider re-evaluating their strategies. Between 1995 and 2011, world vegetable oil consumption increased by about 48 percent. The top 50 countries consuming edible vegetable oil represented about 90 percent of the world edible oil market. They have significantly contributed to total consumption growth by increasing population and/or expanding per capita intake. The largest consumers of edible oils in the world are Chin, India, Brazil, Nigeria, Indonesia and Pakistan. Within the edible oils business, new appreciation for health effects of fats’ consumption have altered consumers’ preferences. According to a share analysis of the 1999 to 2001 average share and 2009 to 2011 average share data for directly consumed vegetable oil, global soybean oil use decreased from 31.5 percent of total directly consumed vegetable oil to 30.3 percent (Table 2).
Table 2: Average Oil Market Shares of World Total Vegetable Oil Direct Consumption.
To meet the increasing demand needs, area under oilseeds has been increasing as well. Between 1995 and 2011, acreage grew 107.7 percent for palm, 65.7 percent for soybean, and 41.8 percent for rapeseed/canola FAOSTAT [12]. Some groups have warned that expanding palm acreage causes harm to the environment. Because palm production concentrates in tropical forest areas, converting forest land into palm plantations removes animal and plant habitats, and discards trees and peatlands that would capture carbon and manage greenhouse gas emissions Union of Concerned Scientists [18]. Vegetable oils also have use in biodiesel and other industrial products. For example, oleo chemical feeds tocks include palm, coconut, soybean, sunflower, and rapeseed oils. They have diverse possible uses: lubricants, mining, personal care products, paints, plastics, soaps, and rubbers The European Oleochemicals and Allied Product Groups n.d. [19]. In the U.S., soybean oil is used as major biodiesel feedstock. Kojima [20]. In a 2013 publication by the World Bank, de Gorter 21] show a close interdependence of oilseed and biodiesel markets. Any changes in either U.S. biodiesel policy or global biodiesel policy could shock oilseed prices depending on which policies change and by how much crude oil prices change.
Although this paper emphasizes edible oil products and markets, agribusinesses need to consider all co-products from the oilseed crush process when defining businesses strategies and operating their businesses. The crush process yields two products: oil and meal. The meal has applicability in feed and food. Soybean meal and canola meal are popular meal products. During 2014/2015, the world produced more than 200 million metric tons of soybean meal and 39.89 million metric tons of rapeseed meal (Foreign Agricultural Service [22]. Animal agriculture consumes 97 percent of U.S. soybean meal, and poultry and swine consume more meal than other species United Soybean Board [23]. Food represents just 2 percent of U.S. soybean meal use United Soybean Board [24]. Canola meal has an amino acid profile that complements other proteins such as soybean meal, and it has the greatest feed value in cattle and pig rations Newkirk [25].
China, India, the U.S., Brazil, Nigeria, Indonesia, and Pakistan are seven major countries that consume vegetable oils. Change in oil consumption in a given country could be attributed to a per capita consumption effect, population effect, or combined effect (Table 3). The contribution rate conveys the extent to which factors contribute to a total consumption change. For example, 45.4 percent of global vegetable oil consumption changes can be attributed to population changes, with China and India contributing the most. Their contribution rates totaled 15.1 percent and 13.2 percent between 1995 to 1999 period to 2007to 2011 period, respectively. In China, the per capita consumption effect (11.2 percent) significantly exceeded the population effect (3 percent). The per capita consumption effect was also strong in the U.S., Brazil, and Indonesia. Conversely, in India, the population effect (8.1 percent) exceeded the per capita consumption effect (4.3 percent). The population effect was also strong in Nigeria (2.8 percent), Pakistan (1.9 percent), the other top 49 countries (15.3 percent), and the other countries (7 percent).
Globally, per capita consumption increases have had a slightly stronger effect on vegetable oil consumption than population increases. Preferences also influence customer demands. Research indicates that consumers have a growing understanding of fat and its roles. In 2012, most U.S. consumers surveyed – both those overall and those trying to eat healthier–agreed that some fats and oils are important for health Sprinkle [26]. Consumers who recognize that some fats benefit health and desire to eat healthier may adopt products that contain healthier fats. These consumption patterns influence edible oil markets, and agribusinesses marketing oils perceived to be “unhealthy” may face a marketing challenge in geographies with consumers that emphasize healthy products. Consumer attitudes toward environmental sustainability also affect oil demand. In the U.S., the food service sector for the most part has already focused on using healthier oils, but some operators are now considering sustainability. For example, European consumers exhibit strong non-GMO preferences.
As a result, industry has responded by introducing non-GMO oils in the European market Hennessy [27]. Another example has to do with palm oil production expansion that has compromised forest area. Awareness of this threat prompted consumers to approach Unilever Corporation about sourcing sustainably raised palm oil. This contributed to Unilever’s commitment to purchasing 100 percent sustainable palm oil by 2015 (Sustainable Palm Oil Platform n.d. [28]. Cultural factors may influence oil customer demands as well. For example, India hosts many festivals from August to October that feature fried food. As a result, the country uses more edible oil during this time, and oil imports spike. India largely imports palm oil, but it also imports soybean and sunflower oils Bhardwaj and Jadhav [29].
The economic measure of per capita income indicates a country’s economic status and influences edible oil consumption. With a few exceptions, such as in some European countries, a positive relationship between per capita real GDP and per capita vegetable oil consumption existed in 2011 (Figure 3). Some European countries, such as Luxembourg and Iceland, had only moderate vegetable oil consumption despite high per capita real GDPs. Comparing per capita real GDP with vegetable oil consumption by country highlights cultural preferences because the correlation between the two variables is indeterminate FAOSTAT [1], Shane [30]. Among the top 50 countries consuming edible oils, a stronger positive relationship between per capita real GDP and per capita vegetable oil consumption existed in 2011 (Figure 4). The U.S. had the highest per capita income and the second-highest vegetable oil consumption of the top 50 countries. As per capita real GDP increases along the horizontal axis, per capita consumption ranges roughly from 5 kilograms per year to 30 kilograms per year FAOSTAT Shane [1,30] .
Figure 3: Per Capita Vegetable Oil Consumption Relative to Per Capita Real GDP, 2011 (170 Countries).
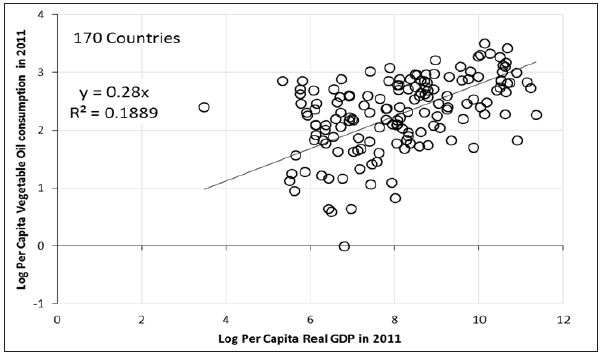
Figure 4: Per Capita Vegetable Oil Consumption in Relation to Per Capita Real GDP, 2011 (Top 50 Countries Consuming Edible Oils).
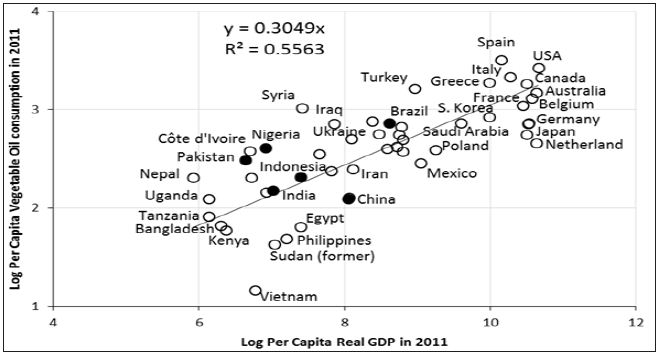
Focusing on the top 50 countries, a stronger positive relationship can be observed with the income elasticity of consumption of 0.3 (Figure 4). As explained earlier in Table 3, the population effect strongly influences oil consumption in India, Nigeria and Pakistan; however, the per capita consumption effect in India is not negligible compared to Nigeria and Pakistan. Total Chinese, Indian, Brazilian, and Indonesian vegetable oil consumption mainly depends on per capita consumption. These countries have great potential for increasing vegetable oil consumption if they grow per capita income. Particularly, per capita consumption in China, India, and Indonesia may double and reach roughly 17 to 18 kilograms. Given the estimated per capita consumption change, total vegetable oil consumption in those countries would roughly increase to 23 million metric tons, 20 million metric tons, and 4 million metric tons, respectively, and world consumption would reach roughly 100 million metric tons. If this consumption change unfolds and all other factors hold constant, then the three countries with about 40 percent of the world’s population would represent roughly half of the world’s total vegetable oil consumption.
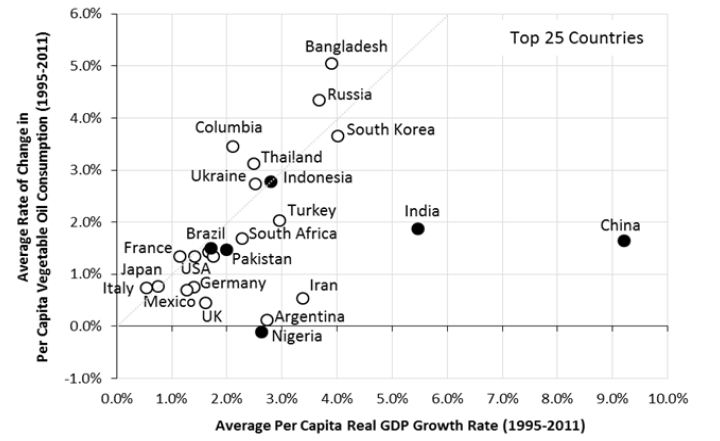
By comparing average annual vegetable oil consumption per capita growth and average annual GDP per capita growth, oil crop value chain stakeholders can identify possible global market opportunities. Given average annual values from 1995 to 2011, countries that had average per capita vegetable oil consumption growth greater than their per capita real GDP growth mainly included Bangladesh, Russia, Colombia, Thailand, Ukraine, and France (Figure 5). In Colombia, for example, annual vegetable oil consumption growth averaged more than 3 percent, and annual per capita GDP growth averaged about 2 percent. For other countries, however, average per capita vegetable oil consumption growth was less than average per capita GDP growth. Such countries include China, India, and Nigeria. In China, for example, average per capita GDP growth has exceeded 9 percent, but annual per capita vegetable oil consumption growth has averaged less than 2 percent. Even so, China and India, including Indonesia, have a higher average annual growth in per capita vegetable oil consumption than major developed countries with per capita consumption rates that exceed 15 kilograms per year.
Figure 5: Average Per Capita Consumption Growth Rate in Relation to Average Per Capita Real GDP Growth Rate, 2011 (Top 25 Countries Consuming Edible Oils).
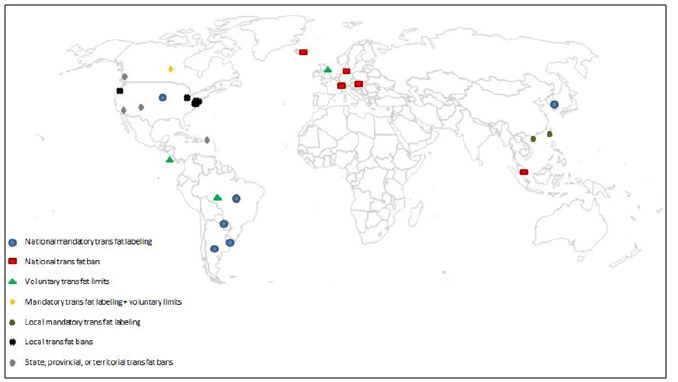
Policy, regulation, and legislation also influence consumer’s decision-making. Government changes in policies have altered edible oil buyer preferences around the world. Trans fats and concerns about their effect on health at least partially explain the recent edible vegetable oil market dynamics. Partially hydrogenating oils moderately saturates them and makes them more stable; however, the process also creates artificial Trans fat Office of Science Outreach [31]. Trans fat may increase bad cholesterol, decrease good cholesterol, stimulate inflammation, interrupt blood vessel cell responsiveness, and encourage insulin resistance. The transfat discussions and limitations have extended throughout the world. The World Health Organization has called for complete trans fat elimination in food Downs [32]. Globally, multiple countries have made Trans fat reduction commitments (Figure 6). A few European countries and one Southeast Asian country have adopted national trans fat bans. Countries in North America, South America, and Asia have implemented national labeling standards. The US Food and Drug Administration (FDA) announced in 2003 that product labels must list trans fat content. Products containing less than 0.49 grams of translate per serving may round down to 0 grams Food and Drug Administration [33].
Figure 6: Worldwide Trans Fat Policies, 2005 to 2012.
Some U.S. states and municipalities have adopted more extensive restrictions (National Conference of State Legislatures [34]. Also, in November 2013, FDA proposed to no longer classify partially hydrogenated oils as “generally recognized as safe” ingredients. The change would preclude food companies from using such oils unless they could prove their safety Tavernise [35], which could be a challenge given that most of the research claims trans fats to be unhealthy. In June 2015, the U.S. Food and Drug Administration finalized a decision to phase-out recognizing partially hydrogenated oils as “generally recognized as safe.” Bans would clearly limit partially hydrogenated oil use and reduce trans fat exposure. In many cases, mandated labeling also triggered product reformulation as food companies desired presenting “zero trans fat” claims on product labels. These forces have shocked edible oil market dynamics as minimizing trans fat exposure has occurred through eliminating ingredients that contain trans fat or blending products to reduce trans fat content. For example, in 2000, 52 percent of U.S. soybean oil used was hydrogenated. By 2020, as little as 4 percent of all soybean oil used in food will be hydrogenated Qualisoy [36].
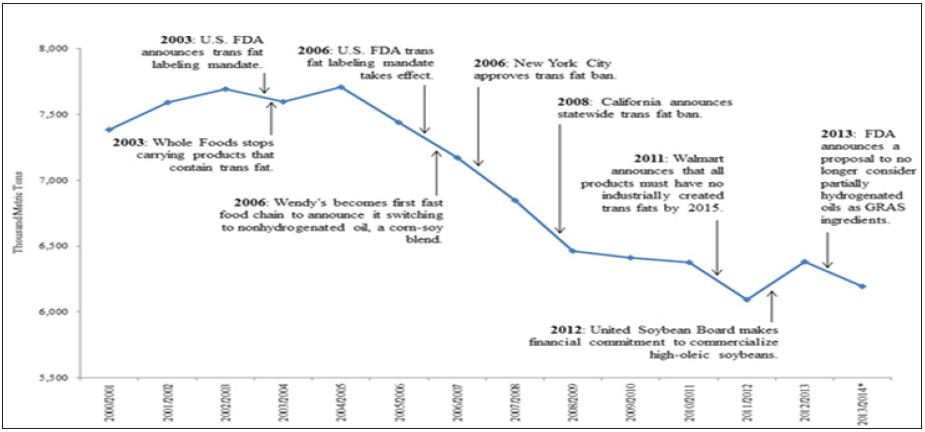
Exposure of trans fats health effects has also significantly influenced soybean oil consumption. In the U.S., soybean oil consumption shifts clearly correlate with major trans fat news events (Figure 7), Foreign Agricultural Service [37], Food and Drug Administration [33], Wittenberg [38], Horovitz [39], Lueck and Severson [40], Lawrence [41], Walmart [42], United Soybean Board [43], Tavernise [35]. The same time, palm oil, coconut oil, and canola oil consumption increased (Foreign Agricultural Service YEAR). Without undergoing partial hydrogenation, these oils naturally express fatty acid profiles that provide the features and benefits desired by buyers. The trans fat labeling mandate majorly contributed to the U.S. importing more palm oil since 2005. The change in oil sourcing influences domestic U.S. agribusinesses involved in the edible oils industry and the foreign suppliers needed to provide palm oil to meet the demand. Malaysia and Indonesia are the predominant global palm oil suppliers High Quest Partners [44]. In June 2015 the FDA announced a final rule three-year phase out plan.
Figure 7: U.S. Edible Soy Oil Use and Major U.S. Trans Fat Events.
Within the edible oils space, technological change and innovation can reinvent fatty acid profiles and, consequently, alter oil attributes and characteristics. The resulting oil products have improved applicability for some uses. For example, soybean industry stakeholders have used biotechnology and traditional breeding to alter fatty acid profiles and innovate products that fit user specifications. Low-linolenic soybeans were the soybean industry’s first attempt to address declining edible oil demand. They express linolenic acid, a highly reactive fatty acid, at 1 percent to 3 percent (The American Oil Chemists’ Society [45] relative to 8 percent in commodity soybean oil (POS Pilot Plant Corporation n.d.). Low-linolenic soybeans, however, didn’t have sufficient demand because they didn’t considerably improve performance, and costs were steep relative to the oil’s value The American Oil Chemists’ Society [45]. After introducing low-linolenic soybeans, high-oleic soybean innovation and commercialization became a priority to maintain soybean oil’s relevance as an edible oil. High-oleic soybean oil contains three times more oleic acid than commodity soybean oil, and it has improved stability without undergoing partial hydrogenation Kelly [46].
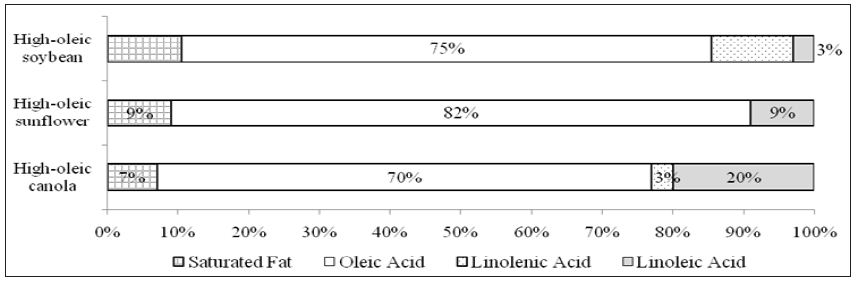
DuPont Pioneer and Monsanto developed high-oleic soybeans using biotechnology. To assist these companies in widely commercializing high-oleic varieties, the United Soybean Board made a $20 million funding commitment to both companies Gonzalez [47]. Other high-oleic soybean innovation at the University of Missouri and USDA Agricultural Research Service developed high-oleic lines without biotechnology Burden [48]. Most recently, research at Cellectis plant sciences and the University of Minnesota produced non-transgenic high-oleic soybeans by deleting portions of soybean coding sequences Haun et al. [49]. Industry sectors other than those linked to soybeans have also innovated higholeic alternatives to provide a high-stability oil that works well in applications requiring such stability. High-oleic canola and higholeic sunflower are two examples (Figure 8). These products have varying fatty acid profiles, but investment in them indicates that edible oil firms and industry groups have realigned their strategies to respond to food industry structural change (POS Pilot Plant Corporation n.d.a., National Sunflower Association n.d., Kelly [46].
Figure 8: High-Oleic Oil Fatty Acid Profiles.
All strategic issues described in this paper intersect and motivate edible vegetable oil firms and industry sectors to reassess their strategies for them to fit with their business environments and markets that they serve. The global edible vegetable oils complex is undergoing considerable change as firms and industries appeal to customer demands, respond to economic changes, comply with the appropriate policies and regulations, carve a market position based on product attributes and the positions held by competing products and leverage technological change to fit buyer needs. In application, these issues have led edible oil agribusinesses to address the health, sustainability and diet preferences that shape customer demands. To an extent, these factors vary geographically. For example, U.S. consumers who recognize that some fats benefit health and desire to eat healthier may adopt products that contain healthier fats. Conversely, access to energy-rich food, not necessarily a food’s fat composition, may more strongly motivate customer demand in developing countries. Policies and regulations have altered agribusiness purchasing decisions, and future mandates may further dictate buying preferences. The FDA’s proposal to no longer classify partially hydrogenated oils as “generally recognized as safe” ingredients is a chief regulatory consideration for agribusinesses serving the U.S. market. Sustainability is another factor that may drive demand for some consumers.
European consumers have indicated resistance toward genetically modified ingredients, so agribusinesses serving European consumers require strategies that accommodate these preferences. While developing products that satisfy customer demands, agribusinesses seek to balance those demand drivers with cost concerns. Generally, a positive relationship exists between per capita real GDP and per capita vegetable oil consumption, and global economic wealth gain is driving consumer demand toward foods that use edible oils as ingredients. As such, global edible oil demand has expanded rapidly, especially for oils that satisfy regulations and customer demands. These forces and high edible oil prices have led to environmental strife through clearing environmentally sensitive lands, which, in turn, creates another sustainability question.
Growing demand and evolving preferences also prompt product innovation, especially for applications with inferior options available at present. Highly demanded oils are those with natural stability and no requirement for partial hydrogenation. Making such edible oil improvements has enabled the food industry to comply with government policies and regulations and limit trans fat exposure. Industry associations have supported oil trait development to sustain markets for the oil crops that they represent.
Oil compositional innovations resonate with two agribusiness structural changes highlighted by Boehlje [50]. First, agribusinesses have shifted from delivering commodity products to creating biologically manufactured products with specific traits or attributes. Second, agribusinesses have adopted coordinated value chains to make genetics advancements. Coordination enables the value chain to quickly address demand changes, monitor quality, and manage risk [51-58]. High-oleic soybeans provide an example as they’re specifically developed for their improved fatty acid profile and offer a differentiated product option for buyers. Growing and supplying high-oleic soybeans and derivative products, including oil, requires a value chain approach to share information, offer incentives to market participants and introduce capabilities to respond to demand. Such coordinated value chains introduce costs, however. Although trait-enhanced products like high-oleic soybean oil present functional advantages compared with their commodity counterparts, the question remains about whether the differentiated product costs will further expand the cost gap between trait-enhanced oils and commodity oil alternatives, such as palm oil, and force increased production of those alternatives.


