info@biomedres.us
+1 (502) 904-2126
One Westbrook Corporate Center, Suite 300, Westchester, IL 60154, USA
Site Map
Received: January 16, 2018; Published: January 22, 2018
*Corresponding author: Faten Dhawi, Biotechnology Department, AlHofuf, AlAhsa King Faisal University, Saudi Arabia
DOI: 10.26717/BJSTR.2018.02.000678
Plant leaf analysis is one of the reliable methods for estimating plant’s need for fertilization [1,2], plant pigments and physiological association [3] plant shape and pigments and genetic variation [4]. Therefore, the analysis of plant leaves is complementary part of the soil analysis nutritional situation and shortfall in the economic crop prevention. In order to make the best use of plant analysis, we have to pay attention to the selection of the appropriate tissue or plant organs for analysis according to plant type and age. It is worth mentioning that concentrations of different substances in plant leaves are not constant but vary according to basic conditions and physiological age [5]. There are many methods for plant leaves analysis but recent trend is toward the non-destructive methods [6- 8]. For instance, leaves shape, pigmentation and area measurements can be scored from photo. In this century, images are no longer just picture they are data [9]. There is several studies used software for images data analysis. There are Gimp [10], Image J [11] and Adobe Photoshop CS5 [12].
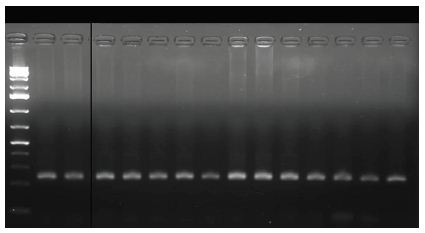
In one of our studies, to facilitate fieldwork we transferred leaves through scanned images to perform measurements from saved images. The same leaves labelled and saved at -80°C for genetic analysis. We performed leaves measurements recording per leaf area, width, length and number of teeth. The number of teeth recorded by direct counting from images for leaf both sides. Leaves length and width recorded from scanned images using Gimp free software [13] (Figure 1). The same scanned images were used to calculate leaf area using Adobe Photoshop CS6 (Figure 2), following method described by Jarou et al. [14]. On the other hand [15], we used Image J to estimate gene expression form DNA bands image using the method described by Manohar et al. [16] (Figure 3).
Figure 1: Leaf width and length estimated using the GIMP measure tool with centimeter.
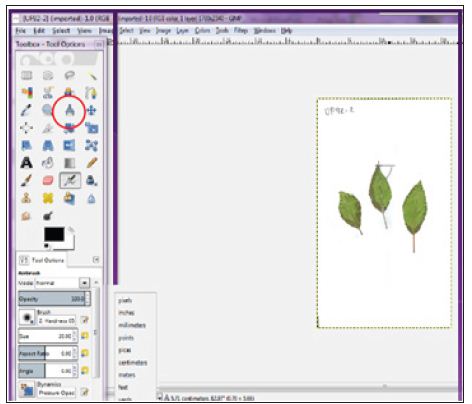
Figure 2: Leaf area estimated using Adobe Photoshop CS6 with pixel.
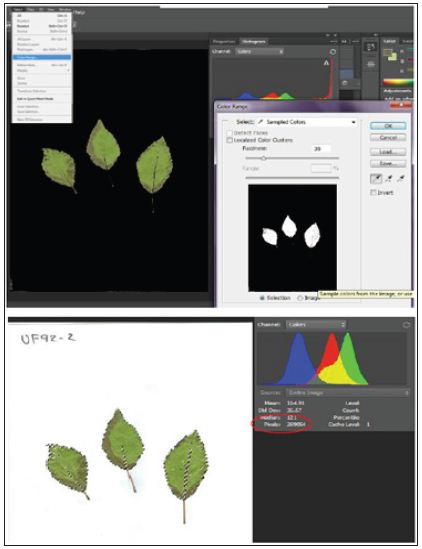
Figure 3: Gel picture processed by Image J to estimate gene expression using DNA bands image.
The use of different images processing software made it possible to correct color via automatic color correction or estimate plant area or leaf loss by scoring the preyed leaf area or studying gene expression from gel images. However, question remains what is the best tool to assess image data. Many factors might contribute for imaging tool preference. The main factor if it was free or offered at reasonable cost. The second most important factor is if it was user-friendly or accessible. The feasibility of the imaging data analysis correlated significantly with available research funds which will make the accessibility and software features is the main and he only factor affecting software use.


