info@biomedres.us
+1 (502) 904-2126
One Westbrook Corporate Center, Suite 300, Westchester, IL 60154, USA
Site Map
Received: December 12, 2017; Published: January 08, 2018
Corresponding author: A Nishant Bhanu, Department of Genetics and Plant Breeding, Institute of Agricultural Sciences, Banaras Hindu University, Varanasi, India
DOI: 10.26717/BJSTR.2018.02.000636
Twenty genotypes of wheat were undertaken for assessment of direct selection parameters (variability, heritability, and genetic advance), indirect selection parameter (correlation) and their relation with heat tolerance. This investigation was carried out at the Agriculture Research Farm of Institute of Agriculture Sciences, Banaras Hindu University, Varanasi during the Rabi season of 2011-12 and 2012-13 in randomized block design with 3 replications. Observations were recorded on grain yield and its related traits, viz., days to heading, days to anthesis, days to maturity, grains per spike, 1000 grain weight. Besides these, chlorophyll content at heading and at anthesis stages as well as canopy temperature depression (CTD) from vegetative stage to dough stages were studied. All the traits like days to heading, days to anthesis, days to maturity and 1000 grain weight exhibited high heritability, which was coupled with high genetic advance as per cent of mean was recorded for 1000 grain weight and yield per plot. That indicated effectiveness of selection for the improvement of these traits.
The 1000 grain weight, i.e., test weight, as the most important yield attribute was found positively and significantly associated with CTD at early and late milking stages suggesting that higher seed weight is possible in varieties which show high CTD, i.e., low canopy temperature in heat stress conditions. Among the component traits, days to heading had positive and significant correlation with days to anthesis, and days to maturity. Interestingly, this result suggests that for the selection of early heading genotypes, days to anthesis and days to maturity should be invariably considered for wheat improvement. Further, plot yield had non-significantly negative association with days to maturity indicating that the early genotypes in semi-arid condition are capable of escaping the terminal heat stress, which is the major yield reducing factor. The twenty genotypes studied, represented considerable and diverse variability for different traits evaluated and significant associations on yield which could be utilized in breeding programme for varietal improvement in wheat.
Keywords: Wheat; Canopy Temperature Deficit; 1000 Grain Weight; Days to Heading; Days to Anthesis
Abbreviations: CTD: Canopy Temperature Depression; PCV: Phenotypic Coefficient of Variation; GCV: Genotypic Coefficient of Variation
Wheat (Triticum aestivum L.), a cereal grass of Graminae (Poaceae) family and of the genus Triticum, is the world’s largest cereal crop. It has been described as the ‘King of Cereals’ because of the acreage it occupies, high productivity and the prominent position it holds in the food grain trade. It occupies an inimitable position in human life as it is the major source of food and energy with a large number of end use products like chapathi, bread, biscuits, pasta and is also a good source of fodder for animals. Wheat is grown on 215.9 million hectares throughout the world, which produces 725.91 million tons of grain [1]. It provides, on an average, one fifth of total calorific input to the world population (FAO, 2008). Wheat in India is grown over an area of 29.86 million ha producing 95.85 million tones [2].
With the enormous increase in the population, the demand for wheat is also increasing such that it is expected that by 2020 the country’s demand for wheat will be 88 million tonnes. Wheat production in recent years has reached a plateau where further increase in productivity and yield is somewhat difficult. The constraints of biotic and abiotic stresses are a greater challenge to the crop scientists and plant breeders. Heat stress is a key abiotic stress affecting crop and cereal production in all regions of the Indian wheat belt [3]. Field data suggests that yield losses can be in the order of 190 kg/ ha for every one degree rise in average temperature and in some situations having a more severe effect on yield loss than water [4,5]. Heat tolerance is a complex phenomenon and difficult to measure. Many selection criteria based on morpho-physiological traits were reported to be associated with performance under heat stress in wheat [6].
Heat tolerant metabolism reported to be indicated by longer leaf chlorophyll retention, canopy temperature depression, photosynthetic rate, leaf senescence. The other traits like biomass, 1000-grain weight and grain yield itself are also highly responsive to heat tolerance. Many investigators reported the traits like high tillering capacity, relatively higher grain weight, acceptable spike fertility, higher spike number, grains per spike, early ground cover etc. to be associated with yield under heat stress and tolerance. High temperature stress in the recent years has been major factor affecting the wheat productivity especially, in the arid and semi arid regions of the world [7]. The earth temperature is constantly increasing. The cultivation of wheat is limited by temperature at both ends of the cropping season. Since plant tolerance to temperature stress is heritable, selection and breeding can be used to improve this trait.
Breeding cultivars with improved tolerance to temperature, however, is a difficult task because of the limited understanding of the genetic and physiological basis of heat tolerance in plants; confounding effects of heat and drought stress; limited understanding of what stages of plant growth can be used as selection criteria and lack of efficient and accurate tests to select for the component physiological mechanisms that give heat tolerance. The relationship between the morpho-physiological traits associated with heat tolerance is very much important in selecting suitable selection criteria for heat tolerance. The association between the traits related to heat tolerance could be better understood through correlation study both at genotypic and phenotypic levels [8]. On the basis of nature and magnitude of genotypic and phenotypic correlations, breeding programs may measure such traits to assist in the selection of heat tolerant genotypes. Therefore, the present investigation was undertaken to examine the relationships between heat tolerant traits and yield.
Twenty genotypes were undertaken for assessment of direct selection parameters (variability, heritability, and genetic advance), indirect selection parameter (correlation) and their relation with heat tolerance. This investigation was carried out at the Agriculture Research Farm of Institute of Agricultural Sciences, Banaras Hindu University, Varanasi during the Rabi season of 2011-12 and 2012- 13 in randomized block design with 3 replications. Seeds of each genotype were sown in unit plot size of 3m long with 6 rows 23 cm apart. Standard agronomic practices were adopted for both experiments. Observations were recorded on grain yield and its related traits, viz., days to heading, days to anthesis, days to maturity, grains per spike, 1000-grain weight. Besides these, chlorophyll content at heading and at anthesis stages by Minolta SPAD-502 chlorophyll meter as well as canopy temperature depression (CTD) was measured by using a hand held infrared thermometer based equipment (Sixth Sense LT-300) from vegetative stage to dough stages were studied.
Data were recorded on five random plants from each entry per replication for all the above mentioned traits except CTD, where single reading itself gives the average of scores of leaves. The data were subjected to the analysis of variance [9] and further, biometrical procedures were followed to estimate genotypic and phenotypic coefficient of variation [10], heritability in broad sense [11], genetic advance [12] and correlation [13].
The analysis of variance for different characters is presented in Table 1. The results showed highly significant difference for most of the characters under study among twenty genotypes. This suggested that there is an inherent genetic difference among the genotypes. The estimates of range, mean, phenotypic coefficient of variation (PCV), genotypic coefficient of variation (GCV), heritability (broad sense) and genetic advance are presented in Table 2. The characters like 1000 grain weight and plot yield exhibited higher values of phenotypic variance while other traits also showed similar trend. This suggests that there is a good scope of selection for these factors [14-16]. The phenotypic coefficient of variation was higher than their respective genotypic coefficient of variation for all the traits [17-22]. The1000 grain weight and yield per plot showed maximum phenotypic coefficient of variation. This variation was minimum for days to [23].
Table 1: Analysis of variance (ANOVA) for all the characters under study in twenty lines of wheat.
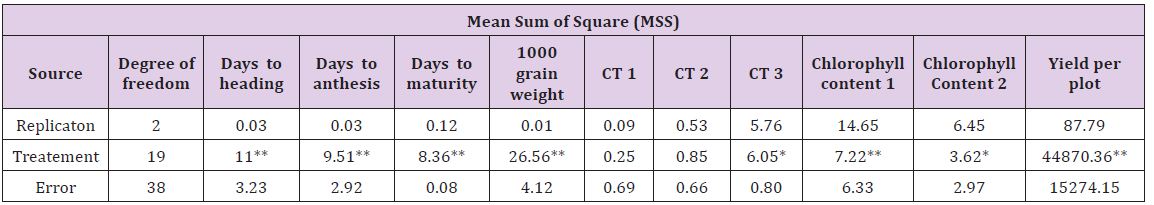
*Significant at P ≤ 0.05 level of significance
**Significant at P ≤ 0.01 level of significance
Estimates of phenotypic variance (σ2p) were higher than genotypic variance (σ2g) (Table 2). A wide range of (σ2p) was observed for days to heading, chlorophyll contents, days to anthesis, grain weight and plot yield while moderate range of variance showed by the traits days to maturity and canopy temperature at different physiological stages. The result of phenotypic coefficient of variation revealed that yield per plot exhibited highest phenotypic coefficient of variation (9.336) followed by 1000 grain weight (9.28). Also chlorophyll content, days to heading and CT at different stages showed wide phenotypic coefficient of variation while, the remaining characters showed moderate to low phenotypic coefficient of variation. Genotypic coefficient of variation was high for 1000 grain weight (7.45) followed by yield per plot (5.85). Also chlorophyll content and CTD at different stages showed wide genotypic coefficient of variation. And remaining characters showed moderate to low genotypic coefficient of variation [24- 26]. The minimum value of genotypic coefficient of variation was observed for days to anthesis, days to maturity and CT [14,27].
Table 2: Range, Mean, SEm (±), Phenotypic and genotypic variance, PCV, GCV, heritability, genetic advance as percentage of mean for all physiological and yield traits under study in wheat.
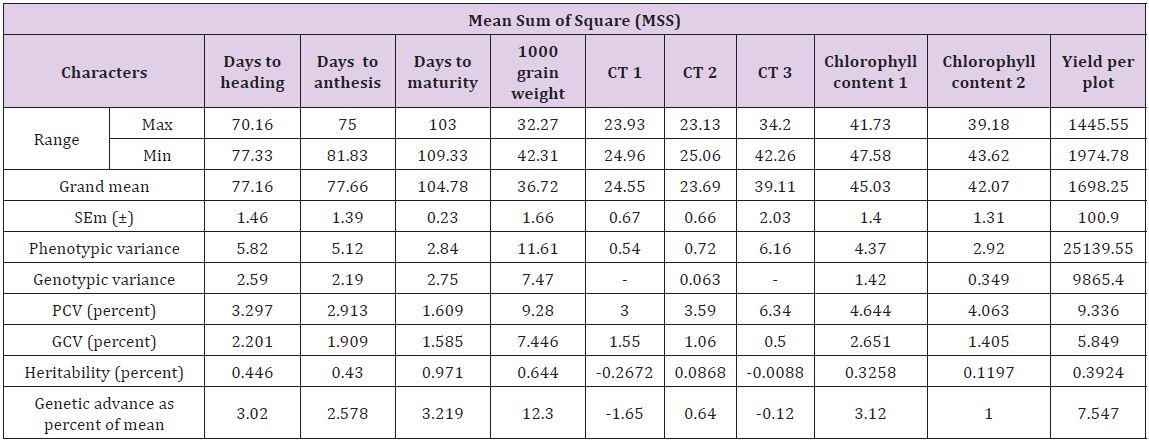
Thus, the traits with high GCV are to be considered during selection. The heritability ranged from 11.97 percent to 97.1 percent. High heritability estimate was exhibited by days to maturity (97.1), 1000 grain weight (64.4), days to heading (44.6) and days to anthesis (43). The remaining traits showed moderate levels of heritability. The estimate of genetic advance as percent of mean was highest for yield per plant 1000 grain weight (12.30) followed by yield per plot (7.55), and the traits like days to heading, days to anthesis, days to maturity and chlorophyll content showed moderate advance while the CT showed less genetic advance [15,28-30]. High heritability coupled with high genetic advance as percent of mean was recorded for 1000 grain weight and yield per plot indicating effectiveness of selection for the improvement of these traits [16,24,28,31,32]. Also CTD and chlorophyll content at different stages exhibited moderate heritability coupled with moderate genetic advance indicating their effectiveness for selection of genotypes tolerant to high temperature [8,33].
Genotypic and phenotypic correlation coefficients were worked out among all the characters under study and the results have been planted in Tables 3 & 4, respectively. The phenotypic correlation coefficient was highly significant and positive for yield per plant with 1000 grain weight and grains per spike. Also highly significant correlation for yield per plot was obtained with canopy temperature depression at anthesis and late milking stages and significant correlation for yield per plot per plot was observed with spike length and spikelet per spike though at 5 percent level of significance. Chlorophyll content at anthesis and CTD at heading and late milking also showed significant and positive correlation with yield. A significant but negative correlation for yield per plot with days to maturity was observed.
Table 3: Genotypic (rg) correlation coefficients of all the physiological and yield traits.
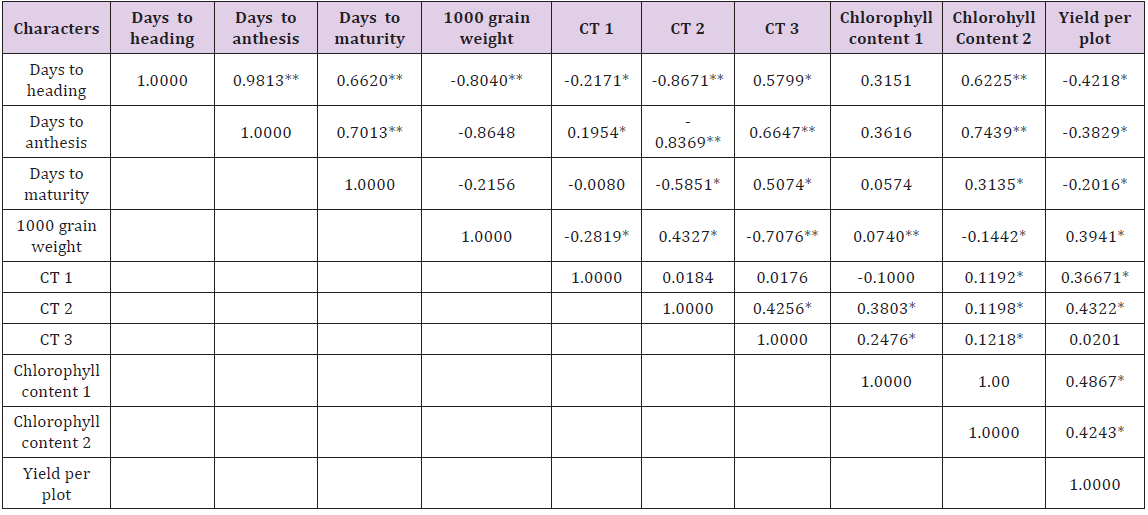
**Significant at P ≤ 0.01 level of significance
*Significant at P ≤ 0.05 level of significance
Table 4: Phenotypic (rp) correlation coefficients of all the physiological and yield traits.
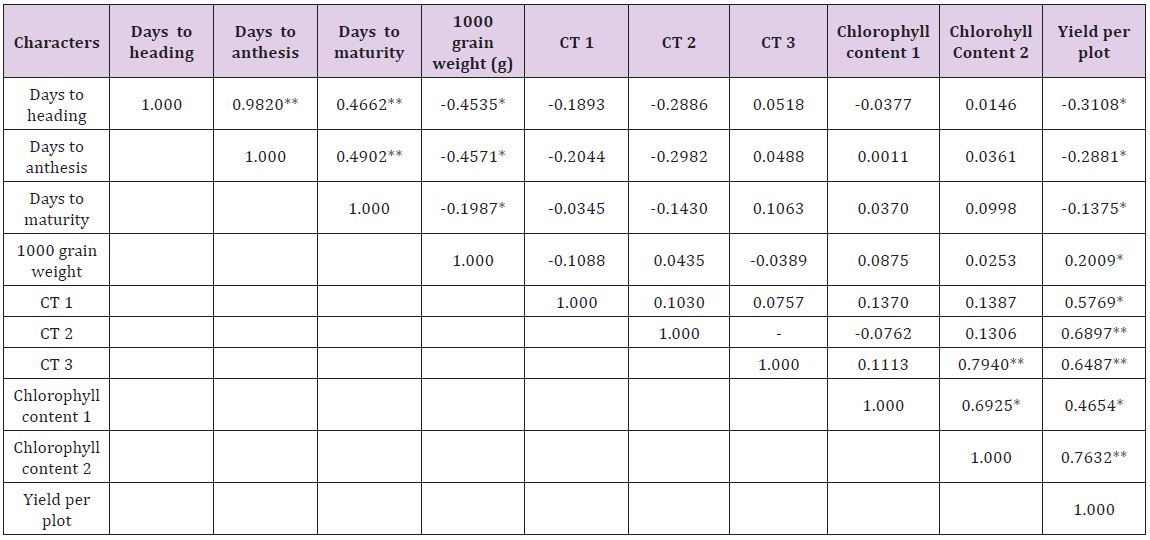
**Significant at P ≤ 0.01 level of significance
*Significant at P ≤ 0.05 level of significant
Among component traits positive and highly significant correlation was observed for days to heading with days to anthesis, days to maturity and CTD at late milking stage. Days to anthesis exhibited positive and highly significant correlation with days to maturity and CTD at late milking stage. This suggests that higher seed weight is possible in varieties which show high CTD i.e., low canopy temperature in heat stress conditions. Therefore the selection of such genotypes is useful in breeding for heat tolerance. A significant and positive correlation was observed for chlorophyll content at anthesis with days to heading, days to anthesis and plant height [34-36]. The plot yield had non-significantly negative association with days to maturity [37,38]. This indicates that the early genotypes in semi arid condition are capable of escaping the terminal heat stress which is the major yield reduction factor.
Climate change and sustainable development are interlinked problems that pose a serious challenge to humanity. High temperature stress in the recent years has been major factor affecting the wheat productivity especially, in the arid and semi-arid regions of the world. The earth temperature is constantly increasing. It can be concluded from the above mentioned findings and details that the genotypes used in the study exhibited considerable variability and association among themselves for various traits under study. Thus, providing the ample scope for selection of elite genotypes and those which are tolerant to heat stress. Several approaches like QTL mapping and association genetic analysis should be useful in an effort to relate specific alleles to trait variation and to identify candidate genes.
We are thankful to the UPCAR Lucknow, for providing genotypic materials and Department of Genetics and Plant Breeding, Institute of Agricultural Sciences for providing all the necessary support to conduct this research programme.


