info@biomedres.us
+1 (502) 904-2126
One Westbrook Corporate Center, Suite 300, Westchester, IL 60154, USA
Site Map
Received: November 14, 2017; Published: November 29, 2017
Corresponding author: Fu Chieh Shih, Emergency, Chi-Mei Medical Center, 901 Chung Hwa Road, Yung Kung Dist, Taiwan
DOI: 10.26717/BJSTR.2017.01.000548
Objective: To investigate journal features by collecting data from Medline and to visualize the journal characteristics of Bioinformatics.
Method: Selecting 11,411 abstracts, author names, countries and MESH (medical subject heading) terms by a keyword “Bioinformatics”[Journal] on October 31, 2017 from the Medline, we applied social network analysis (SNA) and Google Maps to report following features:
a. Nation distribution and coauthor collaboration,
b. Journal features represented by paper MESH terms.
We found that
a. The most number of papers are from nations of U.S. (4175, 36.58%) and Germany (1010, 8.85%)
b. The most linked MESH terms are algorithms and software.
Keywords: MESH terms; Authorship Collaboration; Google Maps; Social Network Analysis; Medline
An interdisciplinary field of science developing schemes/ methods and software tools for understanding and utilizing biological data for health care is popular in recent years [1]. By searching keyword Bioinformatics from Medline library on October 31, 2017, we found 228,865 published papers in which 3,928 with bioinformatics in title. Bioinformatics combines computer science knowledge, statistics and engineering to analyze and interpret the biological data using mathematical and statistical techniques has become an important part of many areas of biology in a short span of time. However, the pattern of international coauthor collaboration as well as the main MESH (medical subject heading) term [2,3] is still unclear.
An apocryphal story often told to illustrate the concept of cooccurrence is about beer and diapers sales. It usually goes along with both beer and diapers sales which were strongly correlated [4-6] in a market place. As such, all possible pairs of our observable phenomena can be combined and analyzed using computer techniques. However, we have not seen any computer algorithms that help us select the most possible pairs co-occurred with each other till now.
Social network analysis (SNA) [7-9] has applied to authorship collaboration in recent years. It is because co-authorship among researchers that forms a type of social network, called co-author network [10]. We are thus interested in using SNA and Google Maps to display the most pair relations for a journal in international author collaboration and MESH terms.
Our aims are to investigate journal features by collecting data from Medline and to visualize the journal characteristics of Bioinformatics in following representations:
a) Nation distribution and coauthor collaborations,
b) Journal features represented by paper MESH terms.
We programed Microsoft Excel VBA (visual basic for applications) modules for extracting abstracts and their corresponding coauthor names as well as MESH terms on October 31, 2017 from the US National Library of Medicine National Institutes of Health (Medline) by a keyword “Bioinformatics”[Journal]. Only those abstracts published by Bioinformatics and labelled with Journal Article were included. Others like those labelled with Published Erratum, Editorial or without author name(s) were excluded from this study. A total of 11,411 abstracts were retrieved from Medline since 1999.
We analyzed 11,411 papers with complete data including authors’ countries, names, and MESH terms. Prior to visualized representations of research findings using SNA, we organized data in compliance with the SNA format and guidelines using Pajek software [11]. Microsoft Excel VBA was used to arrange data fitting the SNA requirement.
We combined SNA and Google Maps to present the distribution of nations and their corresponding collaborations by separating isolated and clustered nodes (e.g., nations). The bigger bubble means the more number of authors (including their coauthors) in papers. The wider line indicates the stronger relations between two nodes. Community clusters are filled with different colors in bubbles. Similarly, keywords of MESH terms represent the research domain for Bioinformatics, the stronger relations between two MESH terms can be highlighted through the SNA, like the concept of co-occurrence about beer and diapers sales. The presentation for the bubble and line is interpreted in results.
Google Maps [12] and SNA Pajek software [11] were used to display visualized representations for Bioinformatics. Author-made Excel VBA modules were applied to organize data. Gini coefficient [13] is used to measure the strength of a role in a network: the higher is the Gini, the stronger is the role in the network.
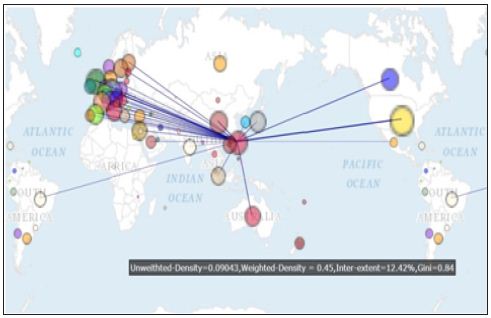
A total of 11,411 papers with complete authors’ nations based on journal article since 1999 are collected. The most number of papers are from nations of U.S. (4175, 36.58%) and Germany (1010, 8.85%). The distribution of coauthor nations is present in Figure 1. The closest relation is linked by U.S. and Taiwan, see the widest line in (Figure 2). All coauthors connected to Taiwan can be shown in Figure 3. After we click the bubble and the diagram. Interested readers are recommended to practice it by clink the link in reference [14].
Figure 1: International author collaborations in bioinformatics.
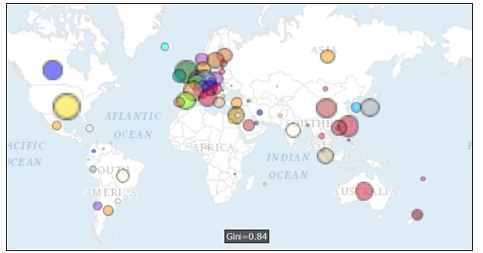
Figure 2: International author collaborations in bioinformatics with links.
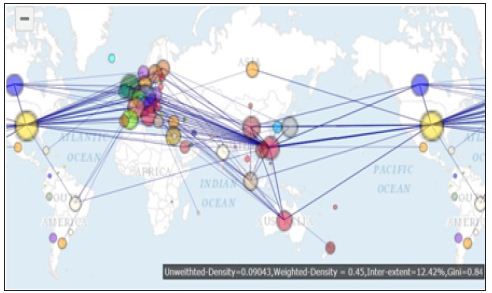
Figure 3: International author collaborations in bioinformatics focused on a specific nation/region.
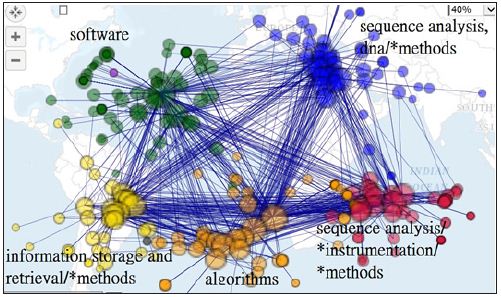
The most linked Keywords denoted by MESH terms are algorithms, software, *algorithms sequence analysis, dna/*methods, information storage and netrieval/*methods, and sequence analysis/instrument/Methods, see (Figure 4). The closest relation is between algorithms and software with a highest frequency of 848. Two terms of algorithms and sequence alignment/*methods (760) follow [15].
Figure 4: Main keywords using Mesh terms to describe the Journal of Bioinformatics dispersed in clusters.
In this study, we found that
a. The most number of papers are from nations of U.S. (4175,36.58%) and Germany (1010,8.85%);
b. The most linked MESH terms are algorithms and software.
Using Google Maps to show the relations of author collaboration and MESH term to represent the features of a Journal that is never seen in previous published papers.
Many previous researches [7-9] have investigated coauthor collaboration using SNA. However, the results have not been incorporated with Google Maps to clearly show the international author pattern. An apocryphal story often told to discover the cooccurrence about beer and diapers sales [4-6]. However, we have not seen any that demonstrates a concrete way to show how to conduct this exploration and to present informative messages to readership. Furthermore, what are the most popular terms that present in journals of Bioinformatics have been investigated in [Figure 4].
Incorporating Google Earth, Google Maps and/or network visualization with Pajek software, one can overlay the network of relations among addresses in scientific publications on the geographic map. We demonstrated and provided illustrations with hyperlinks [14,15] for interested authors to practice in their own ways. There are several limitations that should be concerned in future. First, the interpretation and generalization of the conclusions of this study should be carried out with caution because the data were merely extracted from a single journal. It is worth noting that any attempt to generalize the findings of this study should be made in the similar journal domain with similar topic and scope contexts.
Second, although the data were extracted from Medline and carefully dealt with every linkage as correct as possible, the original downloaded text file including some errors in symbols which are hard to deal with and might lead to some bias in the resulting nation distribution. Third, the social network analysis is not subject to the Pajeck software we used in this study. Others such as Ucinet [16] and Gephi [17] are suggested for readers to use in future.
Social network analysis provides wide and deep insight into the relationships among nations for coauthor collaborations. The results can be offered to authors who are interested in submission to the target journal.


