info@biomedres.us
+1 (502) 904-2126
One Westbrook Corporate Center, Suite 300, Westchester, IL 60154, USA
Site Map
Received: September 05, 2017; Published: September 18, 2017
Corresponding author: Juliet L King, Indianapolis University Purdue University Indianapolis, Indiana University Health Neuroscience Center, Department of Neurology, Indiana University School of Medicine, Indianapolis, IN, USA
DOI: 10.26717/BJSTR.2017.01.000366
This preliminary quantitative EEG study explores the differences in cortical activation patterns of subjects immediately following art making and following rote motor tasks of coin tossing and pencil rotation. It is hypothesized that a sustained, statistically significant difference from baseline occurs in cortical activity patterns, in respect to power and frequency, after art making, and after the performance of non creative rote motor tasks, and that such differences can be detected and quantified with the electroencephalogram (EEG). Ten consenting study subjects underwent EEG recording prior to, during, and after art making and rote motor tasks. Baseline control recordings prior to either task showed minimal changes in EEG power. In comparison, recording made immediately following art making showed a consistent pattern of increased power over the baseline EEG in specific frequencies over both hemispheres, which persisted through the end of the 12 minutes that data was collected. Recordings made immediately following performance of the rote motor tasks also showed a consistent pattern of increased power over the baseline EEG in specific frequencies over both hemispheres. The increase in power seen after art making was greater than the increase in power seen after the rote motor tasks. These preliminary findings suggest that EEG may be a meaningful tool for quantifying cortical activation in the study of creative arts. This study will be expanded to include comparisons of the data during art-making and during motor tasks. It points to further exploration of this methodology and the expansion of more advanced techniques using Mobile Brain Body Imaging (MoBI) in experimental designs. This technique may provide an easily accessible method of quantitative measurement for evaluating aspects of brain activity and function in the study of the neuro scientific basis of creative arts, neuron aesthetics, and art therapy.
Keywords: Art Therapy, Creative Arts, Creativity, EEG, qEEG, Neuroaesthetics, Neurophysiology, Rote Motor Movement
Abbreviations: EEG: Electroencephalogram; MoBI: Mobile Brain Body Imaging; qEEG: Quantitative Electroencephalogram; DDS: Diagnostic Drawing Series; CRT: Coin Rotation Task; FFT: Fast Fourier Transform; MoBI: Mobile Brain Body Imaging.
Since its inception in the 1940’s, the field of art therapy has intuited the connections between artistic expression and brain processes with the identification of three primary tenets, all of which can be underscored with neuroscience principles:
i. The bilateral and multi directional process of creativity is healing and life enhancing.
ii. The materials and methods utilized affect self-expression, assist in self-regulation, and are applied in specialized ways
iii. The art making process and the artwork itself are integral components of treatment that help to understand and elicit verbal and nonverbal communication within an attuned therapeutic relationship [1]. However, without empirical evidence to prove these tenets, art therapists must rely on interpretive frameworks, which are often idiographic and do not allow generalizations to be made to larger populations.
The field of neurasthetics is defined simply as “the study of the neuronal processes that underlie aesthetic behavior” [2] provides a framework for scientific exploration in the field of art therapy. Neuroaesthetics does not currently address therapeutic implications and further investigation of how the physiological and psychological aspects of aesthetic experience relate to one another is an important goal for the future [3]. Neuroaesthetics contributes to the understanding of creative processes by focusing on the nature of visual perception and brain function, the cortical patterns involved in both viewing and making art, and the areas of the brain where art making likely takes place Ramachandran, Hirstein 1999; [4-8].
Previous neuroaesthetic studies utilizing neuroimaging have largely focused on viewing artwork and the associated brain activation as opposed to creating artwork [3] and comparing cortical functions to movement. A study with normal participants showed a difference in cortical motor activation when viewing original abstract art versus a graphic representation of the same piece. Our current study of normal volunteers serves to define patterns of normal cortical activation in the setting of art making and rote motor tasks. Future applications to art therapy for patients with neurological and psychiatric conditions will require exploration of how cortical activation patterns may differ in the diseased and injured brain. Emphasis on patterns of activation in the normal state serves as a foundation for future studies. These results indicate the original art as dynamic and the result of an artist’s creative gesture, while the static graphic representation lacked a perceptual context [7]. These findings suggest that the motor system of the brain is involved differently based on the elements of art that the viewer perceives. This preliminary study seeks to explore the differences from baseline in cortical activity immediately following engagement in the creative act of drawing and immediately following the performance of a simple motor task with the hand. It is hypothesized that a sustained, statistically significant difference from baseline occurs in cortical activity patterns, in respect to power and frequency, after art making, and after the performance of non-creative rote motor tasks, and that such differences can be detected and quantified with the Electroencephalogram (EEG.) Further exploration of this measurement methodology can inform our understanding of brain function and artistic expression.
Neuroimaging technology allows for advanced understanding of art and how the viewer’s brain reacts [9], illuminating motion, emotion, and empathy within the aesthetic experience [6]. Thus far, the contribution of neuro imaging research on the brain during the creation of artwork is limited. The act of creating art engages the whole brain [10,11] which progressive research methodology and neuro imaging technology affirm [12]. Recording what the brain does during movement such as art making is difficult due to artifact yet essential to ferret out noise so that the data may be reduced in a meaningful way. Advanced technology such as Mobile Brain Body Imaging (MoBI) allows for a recording of brain activity using EEG and fNIRS to capture what the brain does, organizes, and senses [13]. This innovative technology is relatively low cost and provides opportunities to conduct research while engaging in a task of creativity.
The relation between various rhythms displayed on EEG and neuro cognitive processes or behaviors has historically been viewed with skepticism. However, as mentioned by [14], research over the past years has shown that synchronized neuronal firing reflected in local field potentials represent a basic mechanism underlying the dynamics of brain systems and the associated cognitive functions. At least some of these oscillations occur at frequency bands recorded on standard scalp EEG. For example, oscillations in alpha domain (such as the occipito-parietal alpha rhythm) may be involved in information processing functions as a modulating gate, while certain beta rhythms may increase when programming of a voluntary motor act occurs. We assume that some changes may occur after art making tasks or a rote motor task that will be reflected in the frequency bands recorded by standard scalp EEG.
Over the last decade art therapists have joined with neuroscientists to begin the exploration of artistic processes and brain activity by using EEG as a mechanism for inquiry. Efforts to study the relationship of brain function and art making have been made by researchers in art therapy [15,16]. These studies compared brainwave patterns before and after art making using Quantitative Electroencephalogram (qEEG) as a measure. [Note: qEEG is a medical term used to differentiate simple interpretation of raw data waveforms based on visual inspection from algorithm based information extraction, yet any processed EEG other than the raw EEG is quantitative. For the purposes of this paper, the term EEG will be used and will define both terms.] The study in 2008 was a single subject design and the 2014 study included a sample size of ten participants. Results of the 2008 study results included higher frequency bands of alpha and beta activation, with decreases in theta and delta. The 2014 study utilized EEG to measure residual changes after 20 minutes of drawing. Their ten subjects included six artists and four non-artists, showing a significant difference among artists in the left posterior temporal, parietal, and occipital EEG recordings. In contrast, non-artists showed changes in right parietal and prefrontal brain.
Kruk compared the brain activity during drawing and clay sculpting in fourteen female participants between the ages of 22 and 25 [18]. Participants completed a pre- and post-measure of state versus trait anxiety using the State-Trait Anxiety Inventory, STA1 Form Y1. Control readings required the participants to open and close their eyes and crumple tissue paper; readings were taken before and after five minutes of freely sculpting with clay and five minutes of drawing. Choosing two different tasks allowed for more specific investigation into how certain tasks, e.g. drawing and sculpting with clay, affect the brain. Results indicated the right medial parietal lobe increased in gamma power activation with the drawing and clay conditions. In comparison, the right medial frontal lobe showed a decrease in gamma power and an increase in theta power during the clay condition. These results also indicated that using a directive during the drawing task affected the front parietal network differently when compared to the non-directive art making using clay. The researchers stated that “drawing on paper in response to a directive likely would elicit a cognitive reaction and possibly a perceptual response” [17].
Malchiodi asserts that science will be central to understanding how art therapy works, will better define its effectiveness, and will improve the ability to develop more effective protocols to test art therapy interventions [19]. Although there have only been a handful of neuro imaging studies in the field of art therapy, EEG has been a promising method to research art making, the distinctions in properties of art materials, and art processes [19]. This current project contributes to the limited yet growing knowledge base on the brain activity involved in art making and supports the use of Mobile Brain-Body Imaging as integral in data collection.
This study was completed with adherence to the Human Subjects Guidelines of the Indiana University Institutional Revenue Board, (IRB approval # 1507398603) with informed written consent obtained from every subject. A sample of ten available participants meeting the exclusion criteria was taken using a within-subjects comparison of EEG recordings with the intent to further establish and explore the links between creativity and neuroscience for the purpose of advancing the field of art therapy. EEG recordings were taken during a single session. EEG data collection occurred as follows:
i. Baseline (3 minutes eyes open, 3 minutes eyes closed, 3 minutes eyes open, 3 minutes eyes closed).
ii. Art making (12 minutes eyes open).
iii. Post art making (3 minutes eyes open, 3 minutes eyes closed, 3 minutes eyes open, 3 minutes eyes closed.
iv. Coin flips (6 minutes eyes open).
v. Pencil rotation (6 minutes eyes closed).
vi. Post motor tasks (3 minutes eyes open, 3 minutes eyes closed, 3 minutes eyes open, 3 minutes eyes closed).
Due to funding constraints, comparisons could only be made for one grouping of the data collected. The decision was made to compare baseline eyes closed recordings to post art making eyes closed recordings and post rote motor task eyes closed recordings. It is known that EEG eyes open and EEG eyes closed conditions provide EEG measures with different topography and power levels (Barry et al. 2007). More work has been done with comparisons of EEG power and topography in the eyes closed state, so this was chosen as the first data to analyze, with future plans for analysis of the eyes open data, including the data recorded during the art making and rote motor tasks.
Participants were recruited from the Indiana University Purdue University Indianapolis campus, Indiana University School of Medicine faculty, and surrounding community members through the use of flyers, social media postings, and email notices. With a goal to recruit a wide sample of subjects with no major medical conditions that would significantly impact their EEG data, criteria for participation included being able to provide consent, with an age of 18 years or older, and no prior history of major head injury, stroke, seizure disorder, and no brain or skull injury or surgery. Subjects taking psychotropic or other medications, such as narcotics, sedatives, or stimulants that could affect the EEG recording, were also excluded. After data collection was complete, all subjects completed a short demographics form indicating handedness, level of artistic ability, age, and gender, so this data could be utilized for groupings in future studies, with appropriate numbers of subjects to analyze differences across some or all of these characteristics.
Prior to data collection, participants met with the graduate research assistants to read and sign an informed consent form and with the neuro technologist for a brief explanation of EEG recording processes and expectations. The informed consent form included information regarding the overall purpose of the study, participation procedures, risks and benefits of taking part in the study, how confidentiality would be maintained, and the voluntary nature of the study. Also included in the informed consent form was a release for their artistic production to be used in future publications and/or presentations pertaining to art therapy.
The art making portion of this study required a 12 pack of chalk pastels and an 18’’ x 24’’ sheet of white paper with a pre-drawn mandala, or circle, at the center. The mandala, commonly used in art therapy practice and intervention, is essentially a circle outline, which can be used as a focal point within which to explore the self. The diameter of the pre-drawn mandala was 15”. Chalk pastels were chosen because they are a diverse medium that can be used in a variety of ways (i.e. controlled clean lines or smeared/loose line quality) and are commonly found in a variety of art therapy settings. A Presidential $1 gold coin was chosen for the first motor task, coin flip, because is it larger (8.100 g and 26.49 mm) in diameter than the standard American quarter (5.67 g and 0.955 mm). A standard No. 2 pencil was also chosen for ease of availability for the second motor task.
EEG equipment for recording and computerized technology for assessments was made available for the conduct of this study from the Indiana University Health Neuroscience Center. Data collection took place on two separate days with five participants scheduled per day. EEG recordings took place in a well lit EEG testing room within the Indiana University Health Neuroscience Center with a neuro technologist (R. EEG T.), neurophysiologist, and graduate research assistant present. Standard gold cup EEG surface electrodes were placed by the neuro technologist using the International 10-20 system of electrode placement, conductive paste, and sticky gauze squares. Recording electrodes were placed at (Fp1, Fp2, F3, F4, C3, C4, P3, P4, O1, O2, F7, F8, T3, T4, T5, T6, FZ, PZ and CZ). A ground electrode was placed on the forehead, A1 and A2 electrodes were placed behind the ears. Electrodes were also placed at the outer canthus of each eye, to help detect and eliminate eye movement artifacts, and an ECG electrode was placed to identify ECG artifacts. Electrode impedances were kept below 5 Kilo-Ohms throughout all recordings. Every participant followed the same order of EEG data collection:
i. Baseline,
ii. Art making,
iii. Post art making,
iv. Coin flip,
v. Pencil rotation,
vi. Post motor tasks. The baseline, post art making, and post rote motor task intervals all followed the same 12 minute sequence; four 3 minute epochs of time, eyes open, eyes closed, eyes open, eyes closed.
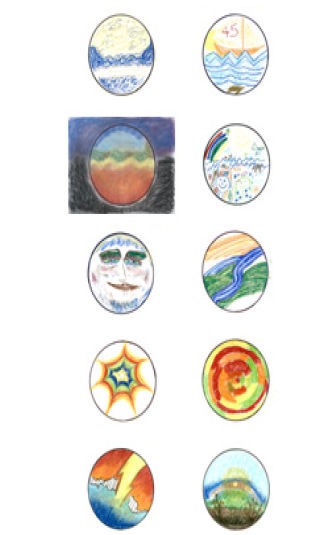
Figure 1: Subjects’ Artwork. Created with the directive, “explore how you feel using lines, shapes, and colors” within 12 minutes.
After completion of the 12 minute baseline, the table holding the paper and chalk pastels was moved into reach of the participant with the following directive:
Use the 12 pack of chalk pastels and 18” x 24” sheet of white paper with the pre-drawn circle provided to explore how you feel using lines, shapes, and colors in the circle. You will have 12 minutes to complete this task, please continue to make art for the duration of this task. You will not be judged based on the artwork created. There is no right or wrong way to complete this task. The study’s art task (Figure 1) was taken from [20] Diagnostic Drawing Series (DDS), which originally was designed to provide a baseline assessment of participants using a three-part directive. This section of the DDS was chosen to promote abstract thinking.
In addition, a pre-drawn mandala was included to provide structure, boundaries, containment, increase attention and reduce anxiety [21-24], Fincher 1991. Reducing anxiety was especially relevant to the current study as [16] suggested EEG procedures may be anxiety provoking. Next, the post-art making data collection occurred. This consisted of four 3 minute epochs of time, eyes open, eyes closed, eyes open, eyes closed. Following this, the rote motor tasks were performed. Mendoza et al. (2009), Foki et al. (2010) utilized the Coin Rotation Task (CRT) as a standard research instrument of psychomotor processing speed, which influenced the use of coin flipping in our preliminary study. Due to the level of ease and potential for attention loss and therefore decrease in cortical activation, the CRT was altered to coin flip task, and the pencil rotation task was added to increase the difficulty level. In order to maintain attention and engagement throughout this segment of testing, two tasks were administered in 6 minute, consecutive intervals.
The prompt read as follows:
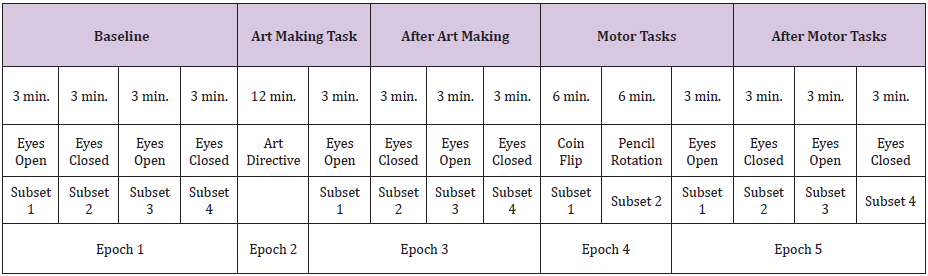
This intervention will be divided into two 6 minute tasks. For the first 6 minutes we will ask you to continually flip a coin. Next, we will ask that you rotate a pencil between your fingers using your dominant hand for the remaining 6 minutes. The final phase of the EEG data collection was to complete the post motor task measure. Again, this consisted of four 3 minute epochs of time, eyes open, eyes closed, eyes open, eyes closed. For the preliminary data analysis, only the epochs of data identified as Epoch 1: Subsets 2 and 4 (baseline eyes closed), Epoch 3: Subsets 2 and 4 (post art making eyes closed), and Epoch 5: Subsets 2 and 4 (post rote motor tasks eyes closed), were utilized (Table 1). All data will undergo analysis in future studies.
Table 1: Recordings of the EEG data were performed for epochs and subsets of time, as detailed here. Control data were obtained through comparison of Epoch 1 Subset 4 to Epoch 1 Subset 2. Epoch 1, Subsets 2 and 4 were combined to form the Baseline (Eyes Closed) data set. Epoch 3, Subsets 2 and 4 were combined to form the After Art Making (Eyes Closed) data set. Epoch 5, Subsets 2-4 were combined to form the After Motor Tasks (Eyes Closed) dataset.
Procedure Time with Epoch Notation
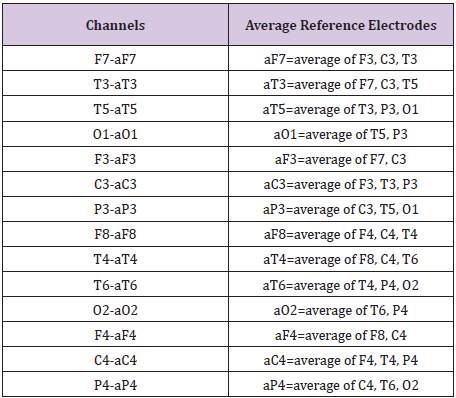
The EEG was recorded utilizing a Nihon Kohden, EEG-1200, with a low frequency filter of 0.16 seconds and a high frequency filter of 70 HZ. A bipolar, longitudinal montage was utilized during data collection, and the EEG was later reformatted to a modified average reference montage (Table 2). Prior to analysis of the data, raw EEG underwent visual inspection, with all time periods of excessive artifact deleted from the sample for all recording periods.
Table 2: Indicates the average reference electrodes utilized for each channel.
Modified Average Reference Montage
The two 3 minute recording periods of baseline eyes closed were first grouped separately as BaseEC1 and BaseEC2 so that a comparison could be made of the FFT data from these two separate samples of eyes closed EEG recorded prior to any interventions, This data was used as a control. These two baselines, eyes closed recording periods were then combined into one table of FFT data, called “baseline”. The two after art making eyes closed recording periods were combined into one table of FFT data, called “after art making task”. The two after motor tasks eyes closed recording periods were combined into one table of FFT data, called “after motor tasks”. Each of these tables of FFT data, baseline, after art making task and after motor tasks were compared as described in the statistical analysis section.
Persyst 12, Insight II software was then utilized to perform a Fast Fourier Transform (FFT) Spectrogram of the EEG, yielding numerical output of total power in sqrt (uV). The FFT Spectrogram was calculated with a sampling rate of 128 HZ for non-overlapping epochs of 1 second duration for separate 2Hz frequencies from 0-32 Hz, as 0-2 Hz, 2-4 Hz, 4-6 Hz, 6-8 Hz, 8-10 Hz, 10-12 Hz, 12-14 Hz, 14-16 Hz, 16-18 Hz, 18-20 Hz, 20-22 Hz, 22-24 Hz, 24, 26 Hz, 26-28 Hz, 28-30 Hz, and 30-32 Hz. The FFT of sequential 1 second epochs of time was conducted using an average of Left Hemisphere “channel” groupings and Right Hemisphere “channel” groupings of electrodes, as detailed in (Montage) (Table 2) and (Channel Groupings) (Table 3). Each 1 second epoch of time recorded for each of the “eyes closed” data collection periods yielded numerical data of total power as an average of Left Hemisphere channels and separately, an average of Right Hemisphere channels, for each 2 HZ frequency range. The one second epochs of time were not averaged together. They were each entered into the statistical analysis as a separate measurement of data. An example of the FFT data recorded for one data collection period (APPENDIX - I).
(APPENDIX - I) 10.26717/BJSTR.MS.ID.000366Appendix.pdf
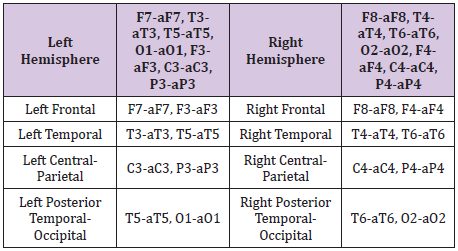
Table 3: Indicates the channel groupings used for the Quantitative EEG Analysis, separated into left and right hemispheres; left and right frontal regions; left and right temporal regions; left and right central-parietal regions; left and right temporal-occipital regions. For this preliminary data analysis, only the channel groupings of Left and Right Hemisphere were analyzed. All channel groupings will undergo analysis in future studies.
To analyze the raw EEG data, we tested differences within individual subjects and across all subjects. More specifically, we compared three treatment levels within individual subjects and across all ten subjects using the EEG total power measurements for each frequency interval. The three levels of the considered treatments are baseline eyes closed, after art making eyes closed, and after rote motor task eyes closed, respectively. The EEG measurements are recorded in the form of square root of total Power. Frequency (0-2 Hz, 2-4 Hz,up to 30-32 Hz) across specified time periods (around 400 time periods) and geographic locations (Left Hemisphere and Right Hemisphere). The analysis was done for each frequency level and each location thereby allowing for the detection of a greater number of variations in the data. Linear mixed effects models, or more specific, ANOVA with repeated measure models are applied. PROC MIXED procedure in SAS was used to perform the analyses.
To compare individual subject differences in the data (i.e. compare the three treatment levels for Subject 1, etc.), we applied the model with Power as the response variable, Treatment as the factor and Time periods as the repeated measure for each subject. We performed a pair wise comparison using Tukey adjustment to do t-tests for the mean power difference between each pair of the three treatments. We also did Bonferroni adjustment for the multiple tests at 16*2=32 frequency and location combinations. In other words, we compared the adjusted p values (through the above Tukey adjustment) to the adjusted alpha level 0.05/32=0.0015625. There are significant mean differences simultaneously for all the frequencies and locations where adjusted p values are less than 0.0015625.
Next, we tested for the treatment effect while considering the subject variation. The same linear mixed effects model was applied, as above, but this time we added Subject as a random effect. We again performed pair wise comparisons for the mean power difference among the three treatments and did Bonferroni adjustment for multiple tests at all the frequencies and locations. The results are summarized in (Table 4). Additionally, we also performed a comparison of the two eyes closed baseline sessions (BaseEC1 and BaseEC2) which were both recorded prior to art making or rote motor task, as an internal control, so that we could rule out any random variations that might affect the accuracy of our tests. By frequency and location, we applied ANOVA model with Power as the response, Treatment (two levels: BaseEC1 and BaseEC2) as the factor, Subject as the random effect, and Time as the repeated measure. We tested for the mean power difference between BaseEC1 and BaseEC2 using t-tests. The multiple tests results at all the frequencies and locations with Bonferroni adjustment are noted (Table 5).
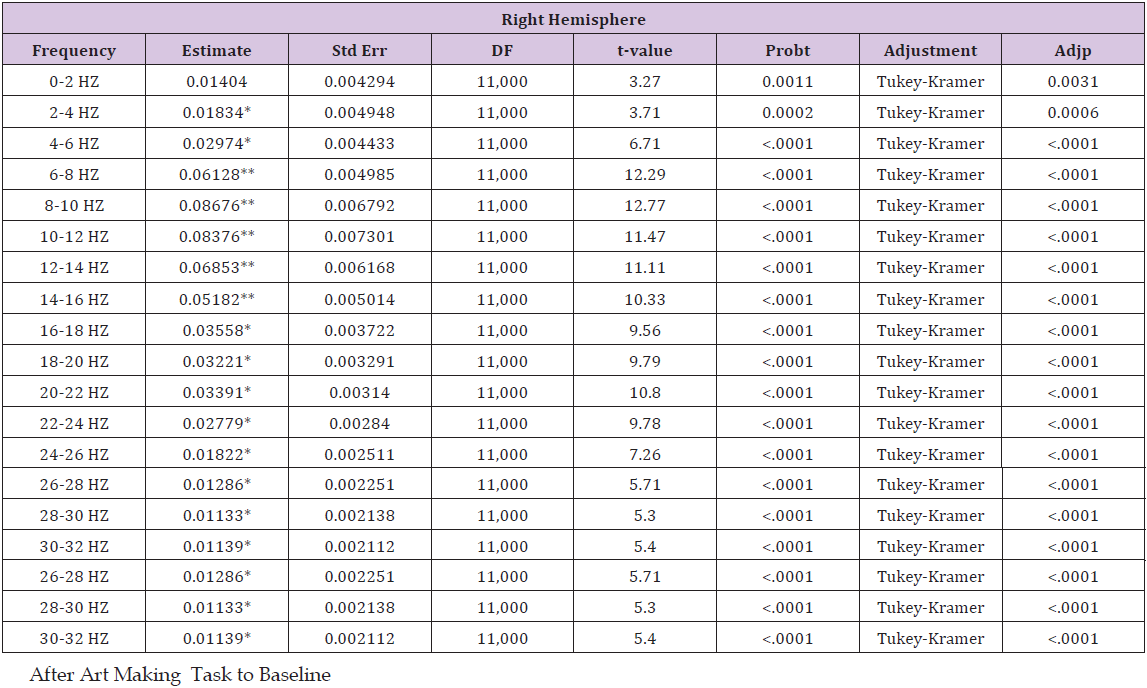
Table 4: This table details a pair wise comparison by frequency and location, showing estimated mean differences of power
i. After art making task to the baseline.
ii. After motor tasks to the baseline
iii. After motor tasks to after art making task. Cells with * indicate p < 0.0015625; cells with ** indicate p <0.0015625 and have an estimated mean difference above the 0.045 threshold or below the -0.045 threshold.
After Motor Tasks to After Art Making Task
Table 5: This table shows estimated mean differences of left and right hemisphere power by frequency and location, for the Baseline (Eyes Closed) Epoch 1 Subset 4 compared to the Baseline (Eyes Closed) Epoch 1, Subset 2 (see Table 1. Procedure Time with Epoch Notation). Cells with * indicate p < 0.0015625.
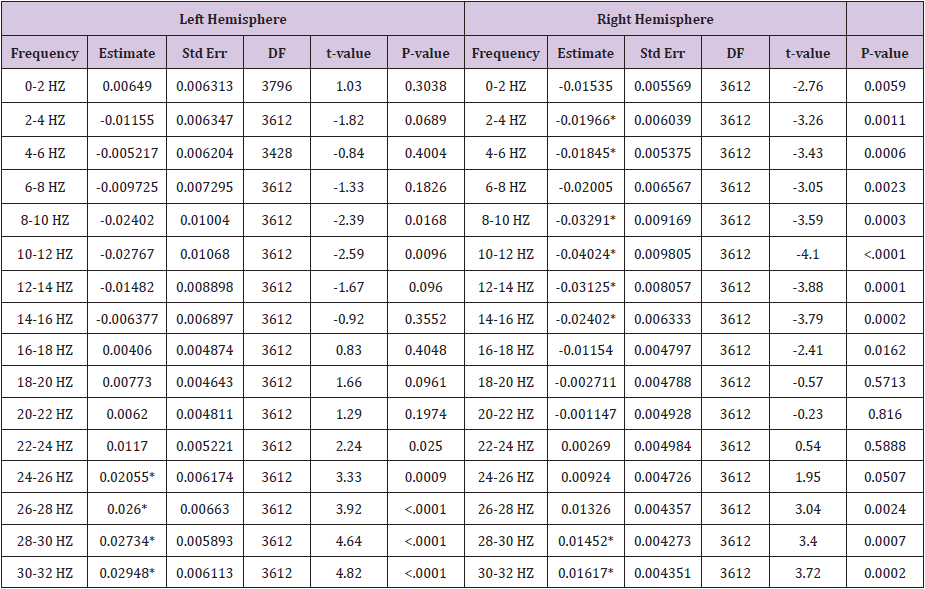
Baseline Difference Control
Table 6 (Baseline Difference Control) shows estimated mean differences of left and right hemisphere power by frequency and location, for the Baseline (Eyes Closed) epoch 1 subset 4 compared to the Baseline (Eyes Closed) epoch 1, subset 2 (Table 1) Procedure Time with Epoch Notation). These results show that the later epoch of time (epoch 1 subset 4) shows a general decrease of power in frequencies between 1-12 Hz, with a gradual trend upward in power from 12-32 Hz. In the left hemisphere, the increase in power is statistically significant in the 24-32 Hz range. In the right hemisphere, the decrease in power is statistically significant in the 2-6 Hz and 8-16 Hz ranges, and the increase in power is statistically significant in the 28-32 Hz range. Statistically significant estimated mean differences from both hemispheres ranged from -0.04024 to 0.02948. This shows that variation in brainwaves occurred over time, prior to interventions. To account for this in after intervention comparisons, a threshold line of estimated mean difference values was set at ±0.045. This was established to identify after intervention findings that could potentially reflect random fluctuations in the EEG.
A pair wise comparison by frequency and location, showing estimated mean differences of power 1) after art making task to the baseline, 2) after motor tasks to the baseline, and 3) after motor tasks to after art making task (Table 4). Results for after art making task compared to baseline showed a general increase in power throughout all frequencies, trending upward in power from 0-10 HZ, with a gradual trend downward from 10-30 Hz. In the left hemisphere, the increase in power is statistically significant from 4-32 Hz, and it exceeds the threshold lines of ±0.045 (set to show potential random variance), from 6-16 Hz. In the right hemisphere, the increase in power is statistically significant from 2-32 Hz, and it exceeds the threshold of 0.045 from 6-16 Hz.
Figure 2: Graphic representation of the pair wise comparison of the EEG power changes for After Art Making to Baseline, After Motor Tasks to Baseline, and After Motor Tasks to After Art Making by frequency for the left hemisphere. Additionally, comparison of 2 separate pre-intervention data collections is shown as Pre-Intervention Control, demonstrating variation in power that has been used to establish an estimated mean difference threshold of 0.045 and -0.045. Each data point from frequencies 0-2 HZ through 30-32 HZ is indicated. Points with a circle show that the estimated mean difference for that frequency was statistically significant (p < 0.0015625).
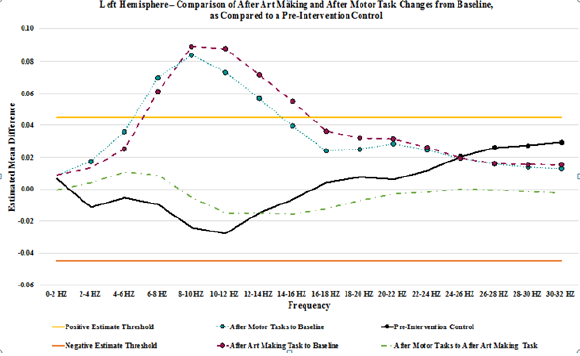
Figure 3: Graphic representation of the pair wise comparison of the EEG power changes for After Art Making to Baseline, After Motor Tasks to Baseline, and After Motor Tasks to After Art Making by frequency for the right hemisphere. Additionally, comparison of 2 separate pre-intervention data collections, is shown as Pre-Intervention Control, demonstrating variation in power that has been used to establish an estimated mean difference threshold of 0.045 and -0.045. Each data point from frequencies 0-2 HZ through 30-32 HZ is indicated. Points with a circle show that the estimated mean difference for that frequency was statistically significant (p < 0.0015625).
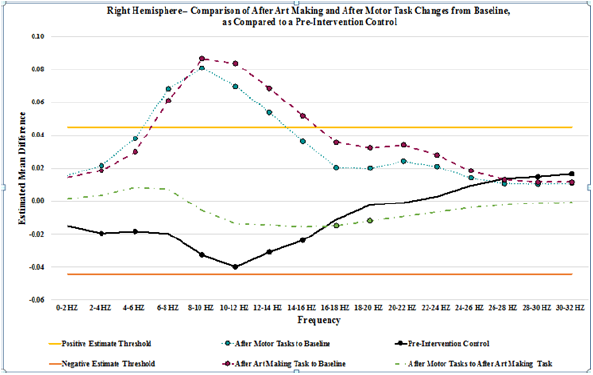
Results for after motor tasks compared to baseline showed a general increase in power throughout all frequencies, trending upward in power from 0-10 Hz, with a gradual trend downward from 10-32 Hz. In the left hemisphere, the increase in power is statistically significant from 2-32 HZ, and it exceeds the threshold of 0.045 from 6-14 Hz. In the right hemisphere, the increase in power is statistically significant from 0-32 HZ, and it exceeds the threshold of 0.045 from 6-14 Hz. Results for after motor tasks compared to after be art making task showed minimal changes in power. Statistically significant changes in mean power were not present on the left. In the right hemisphere, statistically significant changes in mean power were present from 14-20 HZ, showing a decrease in power. No variances exceeded the ±0.045 threshold lines set to show potential random variance. A graph depicting the changes from baseline that are seen after art making (Figure 2), after the motor tasks, and after motor tasks compared to after art making for the left hemisphere, detailed in (Table 4), as compared to the baseline control (Table 5), while (Figure 3) represents data from the right hemisphere. Threshold lines at ±0.045 estimated mean difference are drawn. Differences greater than those seen in the control are found in both hemispheres for both interventions (after art making compared to baseline and after motor tasks compared to baseline), from 6-14 Hz.
A pair wise comparison by subject, frequency and location, showing estimated mean differences of power, after art making task to the baseline, after motor task to the baseline, and after motor tasks to after art making task for each subject was also performed. Results of this comparison did not significantly vary from those seen in the above detailed pair wise comparison by frequency and location. At this stage of our analysis we cannot assess changes in connectivity during creative expression. In summary, the most significant findings are that there is random variation in the EEG seen in a pre-intervention baseline comparison of different collections of EEG with eyes closed. This must be taken into consideration when discussing variation of EEG post-interventions. There is a clear increase in power from baseline, across nearly all frequencies, especially those from 6-16 Hz that is present for at least 12 minutes after art making, and is also present after the following rote motor task.
Among the different approaches to research creativity, neuro imaging and neurophysiology hold strong potential and are complementary. Preliminary key findings and analysis in this study confirm similar studies showing that EEG is a meaningful tool for detection and quantification of cortical activation and processing in creative arts expression. The use of EEG may be complementary to functional imaging (fMRI and PET) and Mobile Brain Body Imaging (MoBI) as fundamental research tools in the study of the neuroscience of creative arts. Pre-intervention variations in EEG were identified and quantified. Based upon the level of variance seen, a threshold variance was set to identify after intervention findings that could potentially reflect baseline random fluctuations in the EEG. It is essential for meaningful interpretation of serial measurements pre and post intervention to understand the magnitude of random variation in EEG measurements. This study established these baseline changes as obtained in serial baseline measurements from each subject.
This quantification serves to best define the baseline variation in EEG measurements for comparing and interpreting post intervention changes. Future studies should further clarify the magnitude and characteristics of baseline variation so as to limit the risk of misinterpretation of post intervention changes. In the current study the post-intervention persistent cortical neuro physiological changes were of substantially greater magnitude than the baseline variations and thus suggest that art making and rote motor tasking were associated with a significant persistent neuro physiological change. This study reinforces the importance of establishing normal baseline variations in serial EEG records. A component of this study is the use of multiple measurements of baseline (pre-activity) EEG in all subjects. These data indicate the magnitude of EEG changes in a random or normal baseline state and provide important clarification of the degree of baseline variation necessary for optimal interpretation of post intervention EEG.
Persistent physiological changes of increased power were seen in both hemispheres across nearly all measured frequencies following art making and also after rote motor tasking. Our hypothesis that there is a statistically significant difference in the cortical activation pattern of art making as compared to baseline is proven. Because the order of tasks was not varied, we have not proven our hypothesis that the increase in activity from baseline seen after rote motor tasks was related to the performance of the motor task, or whether it was a persistent effect of the art making.
We also recognize the impact of having a small number of subjects in this study. There are clear trends in our data suggesting a greater effect from art making than from rote motor tasks which justify further studies to clarify if there are meaningful changes specific to the art making. We do not know the duration of the persistent EEG effect seen post art making. While this study indicates it is present for up to 12 minutes post art making we observed the same findings post rote motor task. One explanation is the rote motor task and creative art making induce a similar cortical activation and persistent physiologic effect. On the other hand, we cannot rule out that the effects from art making continued on through the rote motor activity and thus could be responsible in part for those similar findings. This issue can be clarified by repeating the protocol but reversing the order of art making and rote motor activity. Furthermore, these trends suggesting a greater effect from art making than rote motor task may require further studies using a larger number of subjects and avoiding a type 2 error to clarify if there are any meaningful changes specific to be art making.
Data from the current study confirm previous findings that there is no clear evidence for a right hemisphere versus left hemisphere localization for aspects of the art making process. While our initial analysis groups recordings from right and left hemisphere, it is possible that recording and analysis from more discretely localized regions (such as individual electrodes) would lead to detection of greater differences and offer greater in site into the specific regions of cortical activation. This should be pursued in future studies. Connectivity changes during art making represent another worthy target of future investigation. Our observations of cortical activation changes in alpha, theta, and beta range frequencies may provide insight into mechanisms and processing specific to those respective frequencies. Underlying neuro physiological and cognitive processes related to these rhythm frequencies should be considered in interpreting the meaning of cortical activation changes. Alpha frequency (8-12 Hz) typically originates from the occipital regions during wakefulness and is associated with relaxation and with eyes closed.Alpharhythmis reduced with eyes open,withdrowsiness,and alsoduring sleep.Evidence suggests the possibility of alpha rhythm serving to inhibit cortical regions and systems when not being utilized. Additional observations suggest a role of alpha rhythm in the coordination and communication of networks. Theta frequency (4–7Hz) is commonly seen in young children and in older children and adults it is associated with drowsiness, meditative states and light stages ofsleep.
Animal studies suggest that theta in the hippocampus EEG is associated with active movement. Further studies suggest that the tarhythmis detectable several hundred milliseconds before the onset of movement and may be related to the initiation or intent of movement. Betafrequency (12.5-30Hz)is associated with active thinking and concentration. Beta frequency over the motor cortex is associated with isotonic muscle contraction and is reduced prior to and during changes in movement. Theta bursts have been observed with increasing sensory feedback in static motor control and then diminished during a movement change. Exploration of the relationships between specific frequency changes and neuro physiological and cognitive function may provide insight into mechanisms and clarification of the meaning of such activation changes.
This preliminary study shows a quantitative methodology for evaluating cortical activity and brain function in the study of the neuro scientific basis of creative arts, neuro aesthetics, and art therapy that is consistent with related published works. Our observation of a persistent neurophysiological change of meaningful direction and magnitude in the cerebral cortex generates several important questions. What is the underlying functional basis for this persistent change? Is this a cortical activation effect or is it post activation exhaustion? How long does this persistent cortical effect last? And is the persistent EEG change correlated with or related to the degree, quality, impact of the therapeutic effect of a creative art therapy intervention. And if so, is there application for such EEG measurements to measure the impact or likely success of an intervention?
This study reinforces the importance of establishing normal baseline variations in serial EEG records. A component of this study is the use of multiple measurements of baseline (pre-activity) EEG in all subjects. These data indicate the magnitude of EEG changes in a random or normal baseline state and provide important clarification of the degree of baseline variation necessary for optimal interpretation of post intervention EEG.
Observations regarding localization are as follows:
Significant persistent EEG changes following art making were detected in both hemispheres. Further study should be conducted to confirm this observation including the study of larger numbers of subjects. To the degree that right hemisphere persistent changes are observed in art making, one related research question that can be answered using this methodology would include clarification of the variables involved with selective right hemispheric/cortical localization. In right handed individuals the right parietal lobe is largely responsible for spatial orientation and conducting a similar study using rote and non-creative tasks of spatial orientation (such as clock drawing) compared with novel creative drawing would clarify the variables responsible for the right hemisphere persistent EEG changes.
Further study including a larger cohort of formally trained artists using the current model will add clarity to the effect of such training on brain localization and function. Identifying more completely the cortical “effort” put forth in expediting an artistic task may provide implications for understanding art therapy clinical interventions in the future. For example, art therapists rely heavily on brain-based theoretical structures such as the Expressive Therapies Continuum (Kagin, Lusebrink, 1978) to develop intervention strategies using a range of art materials that influence the quality of self expression within the context of patient symptoms and goals for treatment. Clarifying the effect of formal artistic training may lead to studies that seek to explore the preparedness for art therapy interventions and eventually may influence an understanding of a candidate’s readiness for treatment.
With respect to the question of hemispheric and cortical localization we note that all of the subjects in the current study were right handed and further evaluation of left handed individuals may provide additional insight into associations that may be related to handedness and cerebral dominance. These preliminary findings suggest that EEG may be a meaningful tool for quantifying cortical activation in the study of creative arts. Use of this tool is limited to a subset of activities in which the subject is seated. This points to further exploration of the boundaries for use of this tool and supports additional development of Mobile Brain Body Imaging (MoBI) tool [25] that includes a larger subset of tasks which include ambulation. This technique provides a readily accessible tool to collect measurable and quantifiable brain activity during and after tasks in the study of the neuro scientific basis of creative arts, neuro aesthetics, and art therapy.
Although in early stages, these data point to this technology and the use of wearable technology (MoBI) to more fully investigate the links between brain activity and behavior during movement [26], which provides accessible and promising methods to more fully identify the brain processes during therapeutic events that historically have been intuited. Simultaneously, experimental studies in clinical art therapy interventions may contribute to the exploration of motivated motor behavior and aspects of embodied cognition as assessed by MoBI. Clarifying the interactions between brain and body dynamics may lead to evidence of a biological model of cognition [27] and the exploration of artistic expression in the context of the therapeutic relationship may provide useful data to inform protocols that study neuro imaging.
Limited funding for this study created the inability to:
i. Include enough subjects to adequately power the research
ii. Selectively recruit subjects evenly to distribute groupings, as related to art making experience
iii. Record three sessions per participant, with order of art making and motor tasks reversed between the first session and second session, and randomized in the third session
iv. Analyze remaining data collected (eyes open baseline, during art making, eyes open after art making, during motor tasks, and eyes open after motor tasks)
v. Analyze data in conventional groupings of brainwave frequencies (delta, theta, alpha, beta)
vi. Analyze data from more refined anatomical locations (frontal, temporal, central-parietal, posterior temporal-occipital, and from each electrode, as compared to an averaged reference
The authors acknowledge that scalp EEG is not a sensitive measure of neural activity that occurs below the cortex. Previous studies have shown that this method is prone to false-positive errors. To overcome these limitations, a more complete study with several trials of data collection with a large participant cohort needs to be completed. Though ideal, it is not feasible to conduct a study on participants using the far superior method of intracranial EEG recording as a purely research tool, due to the invasive and high-risk nature of the procedure. It may be feasible to conduct a future study with intracranial EEG recording, on patients who are receiving the intracranial EEG recording as a part of their normal course of treatment and care.
The current study was significantly impacted by funding limitations. In our future study, we will conduct a power analysis to find the sample size needed to obtain a good power for detecting the significant difference between art making and performance of a rote motor task. First, we will collect data from about 10 to 15 participants under the new design of the experiment, described below. Second, we will fit the linear mixed model to the preliminary data and obtain the estimators of model parameters. Third, with the estimated model, we will conduct a simulation study to carry out the power analysis to obtain the appropriate sample size. We will use this same method to adequately power groupings of subjects as related to level of art making experience. We will:
i. Address the research question, can EEG detect significant power differences in brain activity during art making versus during rote motor task
ii. Address the research question, can EEG detect significant power differences in brain activity after art making versus after rote motor task
iii. Include enough subjects to adequately power this research
iv. Selectively recruit subjects evenly to groupings, as related to art making experience
v. Record three sessions per participant, with order of art making and motor tasks reversed between the first session and second session, and randomized in the third session
vi. Analyze remaining data collected (eyes open baseline, during art making, eyes open after art making, during motor tasks, and eyes open after motor tasks)
vii. Analyze data in conventional groupings of brainwave frequencies (delta, theta, alpha, beta)
viii. Analyze data from more refined anatomical locations (frontal, temporal, central-parietal, posterior temporal-occipital, and from each electrode, as compared to an averaged reference).
We will utilize our findings and methodology to:
i. Address the question of limitations of this technique in certain patient populations secondary to baseline abnormal brainwave function
ii. Apply this technique to the question of quantifying power differences seen with art therapy versus no art therapy in a patient population
iii. Explore the possibility of conducting a similar study with intracranial EEG recording, on patients who are receiving the intracranial EEG recording as a part of their normal course of treatment and care.
This quantitative study explores the differences in cortical activation patterns when subjects create art versus when they engage in a rote motor task. Baseline control recordings showed minimal changes in EEG. Changes in EEG due to baseline normal variation were identified and quantified so as to allow for determination of statistically meaningful effects from art making and rote motor tasking. Art making was associated with a persistent change from baseline of significant direction and amplitude involving both hemispheres, a change that was similar to the persistent change in EEG following rote motor tasks. Our hypothesis that there is a statistically significant difference in the cortical activation pattern of art making as compared to baseline is proven. Because the order of tasks was not varied, we have not proven our hypothesis that the increase in activity from baseline seen after rote motor tasks was related to the performance of the motor tasks, or whether it was a persistent effect of the art making.
Trends in our preliminary data suggest a greater effect from art making than from rote motor tasks and justify further studies to clarify if there are meaningful changes specific to be art making. These preliminary findings suggest that EEG may be a meaningful tool for quantifying cortical activation in the study of creative arts. Use of this tool is limited to a subset of activities in which the subject is seated. this points to further exploration of the boundaries for use of this tool and the further development of Mobile Brain Body Imaging (MoBI) tools that include a larger subset of tasks which include ambulation. This technique may provide a more readily accessible tool to collect measurable and quantifiable brain activity during and after tasks in the study of the neuro scientific basis of creative arts, neuro aesthetics, and art therapy.
The study confirms previous research, includes a methodology for collecting pre-intervention data to establish thresholds for normal variance in EEG, and informs future work that will be adequately powered and designed to test for differences in EEG during and after art making, versus during and after motor tasks.
Our study contributes to the much needed empirical evidence that will validate the impact of art therapy assessment and intervention. Merging neuroscience and art therapy through scientific research offers evidence for how brain science and artistic processes inform one another to support the overall health and amelioration of disease for patients and their caregivers.
This study was completed with adherence to the Human Subjects Guidelines of the Indiana University Institutional Revenue Boards, (IRB approval #1507398603) with informed written consent obtained from every subject.
JK was the Principal Investigator and was responsible for the hypothesis, the design and conduct of the trial, KK was an art therapy graduate research assistant involved with the design, conduct and analysis, AS was an art therapy graduate research assistant involved with the design, conduct and analysis, FL was the statistician, DS was the neurologist EEG expert, RP was the neurologist involved with conduct and analysis, and LO was the neurophysiologist responsible for neurophysiology recordings, data extraction and interpretation. All individuals were involved with preparation of the manuscript.
Partial support for this project was received was from the Clinical and Translational Sciences Institute (CTSI) of Indiana University School of Medicine.
All authors attest that this research was conducted in the absence of any commercial or financial relationships that could be construed as a potential conflict of interest.
We would like to thank the Herron School of Art and Design, the IU School of Medicine, CTSI, Bonnie Merkel, JD Hall, and the study subjects for their roles in supporting this project.
The supplementary material of this study in full report may be found here.


