Impact Factor : 0.548
- NLM ID: 101723284
- OCoLC: 999826537
- LCCN: 2017202541
Received: August 05, 2017; Published: September 01, 2017
Corresponding author: Jean-claude Perez, Maths and Computer Science Retired interdisciplinary researcher (IBM), 7 avenue de terre-rouge F33127 Martignas, Bordeaux metropole, France
DOI: 10.26717/BJSTR.2017.01.000324
Background: Global analysis of 3 human genomes of increasing levels of evolution (Neanderthal /Sapiens Build34 / Sapiens hg38) reveals 2 levels of numerical constraints controlling, structuring and optimizing these genome’s DNA sequences. A global constraint - called “HGO” for “Human Genome Optimum” - optimizes the genome at its global scale. The same operator applied to each of the 24 individual chromosomes reveals a hierarchical structure of these 24 chromosomes.
Results: Then analysing the single strand DNA CG / TA proportions at whole chromosomes and genome scale reveals strong fine-tuned numerical ratios evidencing the “closure” nature (Varela’s autopoiesis theory) of whole human genome.
Keywords: Human genome; CRISPR; Biomathematics; Evolution; Autopoiesis
Thanks to the CRISPR (Clustered regularly interspaced short palindromic repeats) technology, it is now possible to locally modify the genomes, and particularly the human genome [1]. Almost simultaneously, the fractal and global structures of the human genome were demonstrated [2]. In such a context, apart from ethical questions, can a local technology as powerful as CRISPR be applied, ignoring its possible effect on the possible global and longrange equilibrium and balancing at the chromosome scale or even the entire genome scale? For more than 25 years, we have been looking for possible global, even numerical, structures that would organize DNA, genes, chromosomes and even whole genomes [3-6].
We have already demonstrated a numerical structure at the scale of each human chromosome as well as on the whole genome [7-15]. In [10] we have already highlighted this numerical value of 0.6909830056, the HGO in this article: it controls the population of triplets codons analysing single stranded DNA sequence from the whole human genome.
We analyzed completely and systematically each of the 24 chromosomes of each of the following three reference genomes:
A. Neanderthal genome
B. Sapiens Build34
C. Sapiens hg38
Let us now distinguish the two types of HGO that will be discussed:
A. Theoretical HGO (tHGO)
tHGO = (3-Phi)÷2 = 0.6909830056, where Phi is the Golden Ratio Phi = 1.618033989
B. Reference female HGO (rwHGO) : rwHGO = 0.6913477936 error (tHGO – rwHGO) = 0.6909830056 - 0.6913477936 = ¯0.0003647879784 and
C. Reference male HGO (rmHGO) : rmHGO = 0.6922864236 error (tHGO – rmHGO) = 0.6909830056 - 0.6922864236 = ¯0.001303417973
HGOwoman (LOH chr n) = [ (sum C+G single strand 1 to 22 chromosomes except chrn) + (sum C+G chrn) + (sum C+G chrX) + (sum C+G single strand 1 to 22 chromosomes except chrn) + (sum C+G chr LOH n) + (sum C+G chrX) ] / [ (sum T+A single strand 1 to 22 chromosomes except chrn) + (sum T+A chrn) + (sum T+A chrX) + (sum T+A single strand 1 to 22 chromosomes except chrn) + (sum T+A chr LOH n) + (sum T+A chrX) ]
HGOman (LOH chr n) = [ (sum C+G single strand 1 to 22 chromosomes except chrn) + (sum C+G chrn) + (sum C+G chrX) + (sum C+G single strand 1 to 22 chromosomes except chrn) + (sum C+G chr LOH n) + (sum C+G chrY) ] / [ (sum T+A single strand 1 to 22 chromosomes except chrn) + (sum T+A chrn) + (sum T+A chrX) + (sum T+A single strand 1 to 22 chromosomes except chrn) + (sum T+A chr LOH n) + (sum T+A chrY) ]
In all that follows, the general methodology will be as follows: we calculate, for the 46 chromosomes constituting each genome studied, only the single-stranded DNA sequences. In these sequences, we count the relative populations of bases T + A on the one hand, and C + G on the other hand.
HGO of the 3 whole genomes : Neanderthal, Sapiens Build34 and Sapiens HG38: The three genomes we compare here are differentiated on the one hand by their respective evolution levels, on the other hand by the sample of individual genomes of which they form the syntheses, and finally by the precision of the sequencing of DNA.
The detailed analysis related to the 3 whole genomes shows the various distances and errors between real computed HGOs for each genome and theoretical HGO optimum value = 0.6909830055. Particularly, it is found that the 3 HGOs calculated for the respective 3 genomes of Neanderthal, Sapiens (2003 Build34 and 2013 hg38 Sapiens) are very close to the ideal theoretical optimal HGO = 0.6909830056 (99.67% for the least optimal genome) [16-29]. It is also observed that female genomes (XX) are more optimal than male genomes (XY). On the other hand, the genomes of Neanderthal and Sapiens (Build34 of 2003) have very close optimization levels. We believe this results from the fact that the precisions of their respective DNA sequencing are similar.
On the contrary, the hg38 genomes of 2013 show the most optimal levels, this is most certainly due to the deeper quality of their DNA sequencing (Figure 1). A summarizes HGO results for these 3 human genomes of varying levels of evolution.

Figure 1: The respective HGOs of 3 human genomes of varying levels of evolution are shown here.
Considerations on this theoretical Human Genetic Optimum (HGO) of (3 – Phi) / 2: This formula is particularly simple. We can even make it more “beautiful”, indeed: Since 1 + Phi = Phi * 2, we can write:
(3 – Phi) / 2 = C+G / T+A = (4 – (1+Phi)) / 2 = (4 – (Phi*2)) / 2 = (2*2 – Phi*2) / 2 = C+G / T+A
This new equivalent formula contains only the numbers “2” and “Phi”.
A second track to be studied could consist in replacing this writing by:
(3 – Phi) / 2 = (3 – Phi) / (5 - 3) = C+G / T+A
By this artifice of writing, we thus make the “3” appear in the numerator and the denominator (!)
The formula then becomes:
A. (3-Phi) x (T+A) = 2 x (C+G) = (5-3) x (C+G)
B. 3(T+A) + 3 (C+G) = 5(C+G) + Phi(T+A)
C. 3(T+A+C+G) = 5(C+G) + Phi(T+A)
Therefore, if we consider that the single copy (single strand DNA) of the 24 chromosomes whole genomes XX or XY all lead to the same attractor HGO = (3-Phi) / 2, to write:
Considering the cumulative population of 24 chromosomes of the single human genome (single strand DNA),
We check the following Perfect Balance: “Three times the whole genome (T + A + C + G) = FIVE times (C + G) PLUS Phi times (T + A)”
A. Neanderthal
B. Sapiens Build34 2003
C. Sapiens HG38 2013
D. 689500000
E. 690000000
F. 690500000
G. 691000000
H. 691500000
I. 692000000
J. 692500000
K. 693000000
L. 693500000
Comparing HGO (Human Genome Optimum) for 3 Human Genomes: HGO man XY; HGO woman XX. numerical ideal attractor: 0.690983005.
Verification on 24 hg38 chromosomes single strand DNA:
A. CG = 1200551672
B. TA = 1737087441
C. 3×(CG+TA) = 8812917339
D. (5×CG)+(PHI×TA) = 8813424881
E. 8812917339÷8813424881 = 0.9999424126
F. 8812917339-8813424881 = ¯507542
Finally, it is remarkable that this formula is based on integers 3 or 5. In fact, these numbers are very small integers and they are Fibonacci numbers. It will therefore be interesting to postpone the error calculations on
the accuracy of these two integers 3 and 5:
(5×CG)+(Phi×TA) = 8813424881 / (CG+TA) = 2937639113 8813424881 / 2937639113 = 3.000172772 and 3×(CG+TA) = 8812917339 - (Phi×TA) = 2810666521 8812917339 -2810666521 = 6002250818 CG = 1200551672 6002250818÷CG = 4.999577243
The exact formula can then be written:
3.000172772 (T+A+C+G) = 5(C+G) + Phi(T+A) or 3(T+A+C+G) = 4.999577243 (C+G) + Phi(T+A)
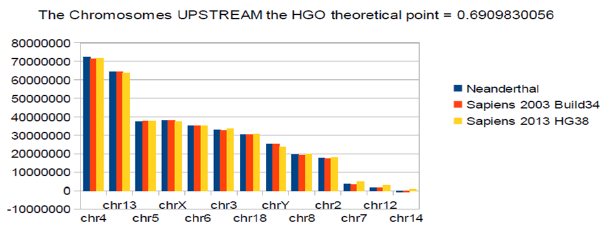
HGO spectral hierarchy of the 24 Human chromosomes: The following 2 figures (Figure 2) (Figure 3) illustrate the hierarchical spectrum of the individual HGOs of each of the 24 chromosomes for each of the three genomes analyzed. It should be noted that the upstream / downstream tipping point lies between chromosomes 14 and 21, which is closely related to the probable mechanisms explaining trisomy21 (whose disorders involve precisely these two chromosomes). Finally, we note that it is the downstream region (Figure 3) that contributes the most to the superiority of optimality of sapiens hg38 compared to sapiens Build34. We have sorted the 24 chromosomes by increasing values of CG/TA ratios in the 3 cases of compared genomes [29-35].

Figure 2: Chromosomes : HGO diversity of human chromosomes UPSTREAM of the numerical attractor HGO = 0.6909830056.

Figure 2: Chromosomes : Diversity of HGOs of human chromosomes DOWNSTREAM of the numerical attractor HGO = 0.6909830056.
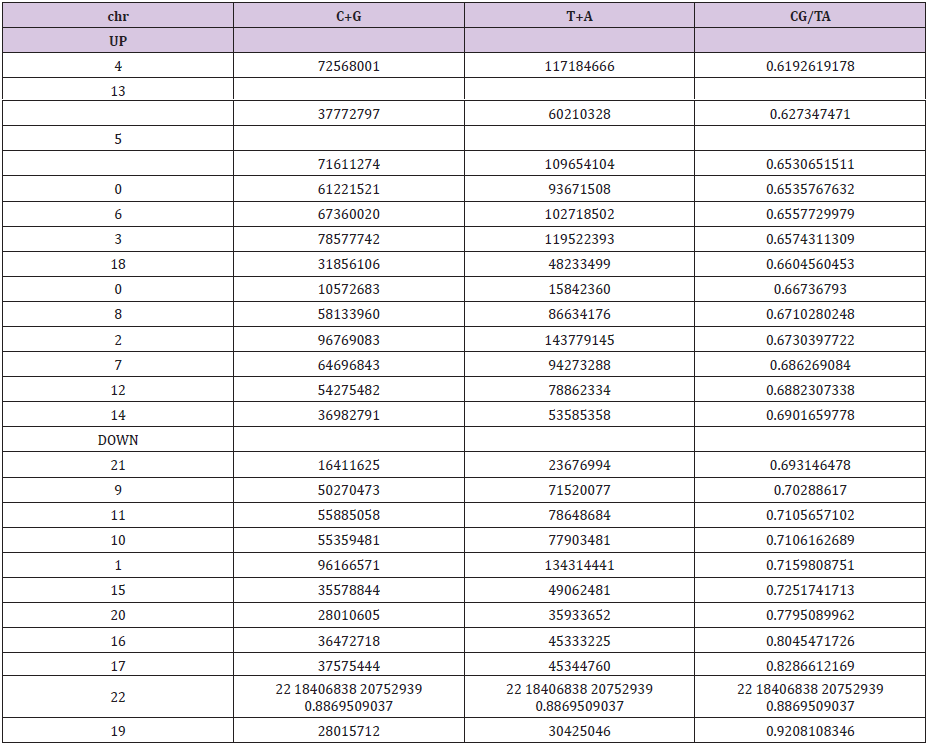
It then reveals a hierarchical classification scale of 24 chromosomes ranging from 1 / Phi (chromosome4) to 3/2 Phi (chromosome 19) (Table 1).

Table 1: The respective populations and ratios of each of the 24 chromosomes of the genome HG38.
About the hierarchical classification of 24 single stranded chromosomes
A. chr4 -10000000
B. chr13 0
C. chr5 10000000
D. chrX 20000000
E. chr3 30000000
F. chr18 40000000
G. chr Y 50000000
H. chr8 60000000
I. chr 2 70000000
J. chr7 80000000
Diversity of Chromosomes from 3 Human Genomes The Chromosomes UPSTREAM the HGO theoretical point = 0.6909830056; Neanderthal, Sapiens 2003 Build34, Sapiens 2013 HG38 In the following, we demonstrate a real interaction, a kind of “dialogue” with feedback between the equilibrium of the whole genome and the part of each of the individual chromosomes. We must now regulate this high level of remarkable numerical constraints which seem to “frame” the CG and TA populations of each of the 24 human chromosomes on the one hand and of the entire genome on the other hand. This will be verified Diversity of Chromosomes from 3 Human Genomes. The Chromosomes UPSTREAM the HGO theoretical point = 0.6909830056; Neanderthal, Sapiens 2003 Build34, Sapiens 2013 HG38 (Table 2).

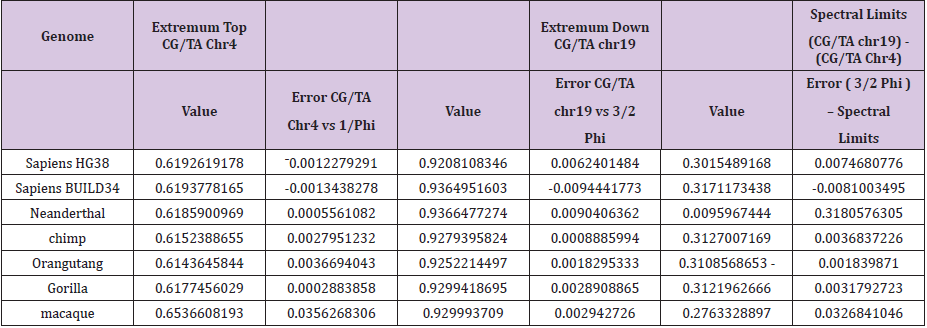
Table 2: Evidence of strong numerical constraints surrounding the relative populations C+G / T+A constituting the hierarchical metastructure of the 24 chromosomes in humans and large primates.
In the following, we demonstrate a real interaction, a kind of “dialogue” with feedback between the equilibrium of the whole genome and the part of each of the individual chromosomes. We must now regulate this high level of remarkable numerical constraints which seem to “frame” the CG and TA populations of each of the 24 human chromosomes on the one hand and of the entire genome on the other hand. This will be verified.


