info@biomedres.us
+1 (502) 904-2126
One Westbrook Corporate Center, Suite 300, Westchester, IL 60154, USA
Site Map
Received: July 31, 2017; Published: August 16, 2017
Corresponding author: G Lohith, Consultant Radiation Oncologist, Healthcare global enterprises Limited, India
DOI: 10.26717/BJSTR.2017.01.000272
75-80% of patients who are diagnosed with cancer in India have advanced disease(Stage III and Stage IV) that is not amenable to curative treatment, which means that they are likely to have pain and other symptoms and psychosocial concerns. These burdens vary with the economic and political situations and are affected by such factors as legal restrictions on access to drugs to relieve pain, and a medical culture in which quality-of-life considerations are undervalued in relation to imperatives to treat. These issues could be ameliorated by increased investment in cancer screening, removal of restrictions on prescription of opioids, and improvements in medical education to increase recognition of treatment futility.
Keywords: PET: Positron Emission Tomography; FDG: Fluoro-2-Deoxy-d-Glucose; SUV: Standardized Uptake Value; DICOM: Digital Imaging and Communications in Medicine; GTV: Gross Tumor Volume; IVH: Intensity Volume Histogram; AUC: Area Under the Curve
Oral cancer is the sixth most common cancer worldwide and continues to be most prevalent cancer related to the consumption of tobacco, alcohol and other carcinogenic products. Nevertheless, significant reduction in mortality has been achieved by advances in early diagnosis and implementation of multidisciplinary treatment programs leading to improvement of survivorship and better quality of life [1]. Even with recent advances in cancer diagnosis and therapy, treatment outcomes for many cancers remain dismal. Patients often show different response to the same therapy regimen, supporting the development of precision medicine. There has been increased use of positron emission tomography (PET) using [18F] Fluoro-2-deoxy-d-glucose (FDG),a glucose metabolism analog, for prediction of outcomes and guiding the precision medicine in tumor detection, staging, and treatment planning and surveillance post therapy in head and neck cancer sites [2]. Accumulating evidence of recent literature suggests that pre-treatment FDG uptake could be used as a prognostic factor for predicting treatment outcomes and is motivated by the fact that radiotracer uptake in the tumor is dependent on the characteristics of the microenvironment, quantitative analysis of FDG uptake is based on changes in the standardized uptake value (SUV) [3], However, sole SUV measurements are potentially impacted by the initial FDG uptake kinetics and radiotracer distribution and there is significant inter and intra observer variability in interpreting the results [4]. Recent development in Radiomics provides a promising objective way for tumor assessment, which uses computerized tools to extract a large number of image features that capture additional information not currently used in clinic that has prognostic value [5]. Radiomics is a process designed to extract a large number of quantitative features from digital images, place these data in shared databases, and subsequently mine the data for hypothesis generation, testing, or both. Radiomics is designed to develop decision support tools; therefore, it involves combining radiomic data with other patient characteristics, as available, to increase the power of the decision support models [6].
In this study, we are exploring radiomic features for summarizing and extracting reliable information from PET images of oral cancer patients. This information would be used to derive predictive metrics in local recurrence outcome analysis which could potentially lead to development of noninvasive biomarkers and could be incorporated into the clinical planning process to modify patients’ treatment based on their predicted loco-regional failure risk. For instance, this could be done by intensifying the treatment dose for patients that at are high risk of failure and providing less toxic regimens than standard for patients who are at lower risk. To our knowledge, this is the first study that utilizes radiomics approach to create a predictive model for local recurrence outcomes in oral cancer patients based on PET imaging.
In this study we analyzed 44 patients of stage (III and IVa) squamous cell carcinomas of the oral cavity, The standard treatment regimen involving Surgery followed by chemo-radiotherapy was adopted and pre-treatment diagnostic FDG-PET CT was mandatory and were acquired using a hybrid PET/CT Siemens with an inplane spatial resolution of 5.3×5.3 mm/pixel and a slice thickness of 2.5 mm. The images were reconstructed using orderedsubsets expectation maximization algorithm with compensation for attenuation using CT-derived μ-maps at Health care Global enterprises Ltd. 26 patients of carcinoma tongue, 8 patients of Carcinoma buccal mucosa,6 patients of carcinoma of the upper and lower alveolus and 4 patients of carcinoma floor of mouth were the sub sites involved in the dataset.
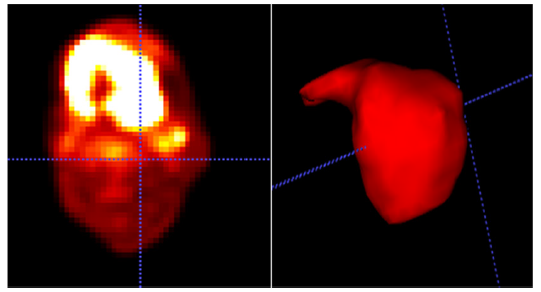
Each patient underwent diagnostic PET/CT scan providing 16 images per case. The dataset was analyzed for endpoint of local recurrence rate and consideration to all the demographics of the patient involved. The patients had a median follow-up period of 30 months (range: 9-48 months). Digital Imaging and Communications in Medicine (DICOM) protocol based scans were considered for the study and intensity values were converted to standard uptake values where SUV is a decay-corrected measurement of activity per unit volume of tissue (MBq/mL) adjusted for administered activity per unit of body weight (MBq/kg) [7]. All patients had a maximum SUV greater than 4. An experienced radiation oncologist outlined and recorded the Gross tumor volume (GTV) manually for all patients, which includes the position and extent of the primary tumor [8], thresholding the SUVs within the GTV at 40% of the maximum value. Figure 1 shows sample of the segmentation pattern and this segmented tumor volume considered for extracting the below radiomic features in oral cancers [9].
i. Intensity volume histograms-The typical role of the intensity volume histogram (IVH) is to reduce a complicated 3D data to a single easier to interpret curve, whereas in this case the volume of a selected structure is plotted as a function of image intensity (or normalized SUV) that is equal to or higher than a certain value.
ii. Texture features using co-occurrence matrix-The cooccurrence features are based on the second-order joint conditional probability density function Pof a given texture image.
iii. Shape features: We computed the following geometrical shape features, Eccentricity, Euler Number, Solidity, and Extent.
Figure 1: Radiomics workflow at HCG hospital.
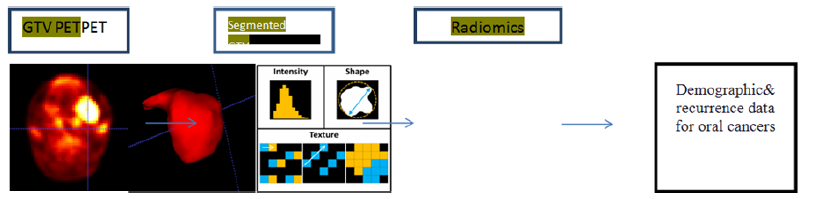
Figure 2:The validity of the derived logistic regression model was tested using the leave-one-out cross-validation resampling technique.
Spearman’s rank correlation (rs) and the area under the receiver-operating characteristics curve (AUC) were used to analyze the association between the extracted features and post therapy outcomes in oral cancers. Spearman’s coefficient provides a simple yet robust nonparametric way to estimate bivariate increasing or decreasing trends that are not necessarily linear associations. The receiver-operating characteristics (ROC) is a graph of the true positive fraction (sensitivity) versus the false positive fraction (1-Specificity) for a continuum of threshold values. A value of the area under the curve (AUC) of 1 is ideal, while a value of 0.5 is equivalent to a random guess (Figure 1). To improve the prediction power, we have adopted a multi-metric model building approach based on logistic regression and resampling methods to combine several prognostic factors. The validity of the derived logistic regression model was tested using the leave-one-out crossvalidation resampling technique (Figure 2).
Figure 3: Machine learning algorithms.
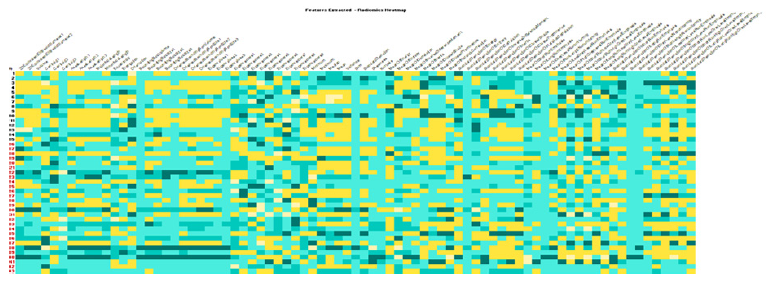
Figure 4:(AUC-0.95) Biomarker description.
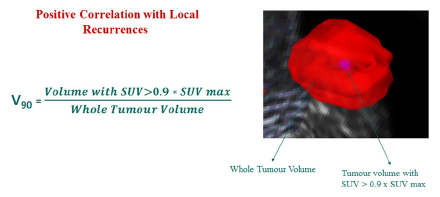
Figure 5:Extent (AUC-0.85) Biomarker description
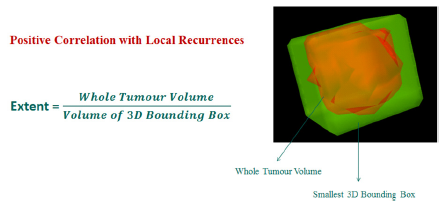
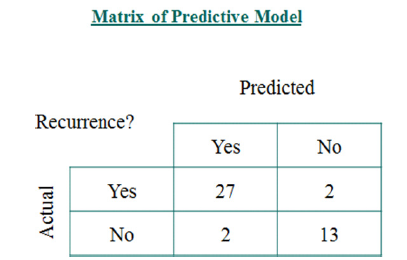
Total of 79 radiomic features were extracted which included 25 intensity based features, 34 size and shape based features and 20 texture based features using pattern recognition and machine learning algorithms (Figure 3) and two features V90 (AUC-0.95) Biomarker description (Figure 4) and Extent(AUC-0.85) Biomarker description: (Figure 5) showing strong co-relations with V90 having a positive co-relation and Extent having a negative corelation corelation and the predictive modeling involving the two biomarkers showed with accuracy metrics sensitivity of 93.1% and specificity of 86.7% (Figure 6).
Figure 6:Accuracy metrics sensitivity of 93.1% and specificity of 86.7%.
In this study, we have investigated methods based on pattern recognition and machine learning for analyzing Functional imaging data to ameliorate reported shortcomings of relying on visual inspection or sole traditional standardized uptake value (SUV) measurements in predicting local recurrence patterns in oral cancers. These methods would allow for extracting potential predictive and prognostic factors from functional imaging data that could be more robust, informative, and discriminative than simplistic SUV descriptive statistics to predict treatment outcomes. Two distinct approaches were explored for analyzing functional imaging information. The first Category is histogram-based reduction of 3D functional imaging and is represented as Intensityvolume histogram (IVH). Metrics such an Ix and Vx are derived from IVH plots and could be used to build predictive models of outcomes. IVH is limited by its spatial insensitivity. To overcome this limitation, we have also investigated image-based features such as texture and shape features which are the second category .Unlike SUV descriptive statistics and IVH metrics, image-based features would have spatial and topological information embedded in them. We have chosen only two features from this pool, which we thought were most relevant for analyzing PET prognostic value with highest AUC of greater tor equal to 0.85, mainly focused on characterizing uptake’s heterogeneity texture patterns.
Based on the above analysis we need to further investigate if V90 can be used as a predictive marker for a new term called radiomic stem cells which could represent the Hypoxia inside the tumor which is resistant to radiotherapy and could be a major deterrent to treatment response and extent could be linked to the size of the tumor meaning, smaller tumors respond to treatment better and larger tumors have a poorer responses to therapy. These results are based on a small dataset of patients and are intended for demonstrative purposes. Analysis on bigger cohort would be required to shed more light on role of these radiomic features and their absolute clinical relevance. We expect that these imaging metrics will complement and enrich currently existing clinical knowledge.
For effective use of PET imaging as a radiomic biomarkers platform and proper application of pattern recognition and machine learning features, PET scanning of the patients should follow the same standard with regards to blood glucose concentration, FDG dose, interval between FDG injection and imaging, and imaging duration. In addition, it should be noted that shape metrics are relatively more sensitive than texture metrics to delineation variations. Manual contouring is known to suffer from inter-observer variability [9]. Therefore using a robust automated method would be preferred to manual contouring when possible.
In our analysis we have built a multi-metric model of relevant features to improve the predictive power by exploiting complementary information in .This approach has improved the prediction power oral cancers cases which are more prevalent in subcontinent with minimal shortcomings.
This study represents a systematic machine learning approach for quantitative evaluation of functional imaging FDG-PET-CT. This would allow for extracting robust radiomic features that could aide incorporation of FDG-PET-CT imaging information to understand better patient’s responses to cancer treatments and reduce the subjectivity induced by visual assessment and incorporate these assessment predictive models in the present scenario of precision and personalized medicine.


