
 Research Article
ABSTRACT
Since erythema squamous skin diseases show very close findings in clinical examination, a biopsy is taken from the patient for definitive diagnosis and the diagnosis of the disease can be made according to the biopsy result. On literature, classification studies were carried out on these diseases using machine learning and classification methods. Researches were mostly focused on optimizing and reducing database features for better classification score. Due to importance of reflecting specifications of diseases we especially focused on dataset features named as clinic or histopathological features findings. In this study, histopathological features of diseases were discussed first and then we developed an algorithm to remove outlier data from the dataset. This algorithm leads us to discover a threshold value to achieve better outlier removal. Logistic Regression, K Neighbors Classifier, Support Vector Classifier, Gaussian Naive Bayes, Decision Tree Classifier and Random Forest Classifier methods applied to the outlier free dataset. It was determined that the Gaussian Naive Bayes method was the most appropriate classification method with 100% score. The results we obtained as a result of the algorithm we developed, being compatible with the clinical and histopathological features of skin diseases with erythema squamous, is a positive result for this study.
Keywords: CHAT; Congenital Myasthenic Syndromes; Genetic Diagnosis; Compound Heterozygous Mutation
Introduction
Chronic diseases are diseases that progress slowly, do not fully heal with treatment, and occur with multifactorial causes in which genetic factors are involved in the etiology. Erythemato-squamous skin diseases affect the individual’s mental, social and quality of life, as well as cause psychological stress on the family and negatively affect social mental health [1]. These diseases cause loss of workforce and economic negativities with high treatment costs with high cost drugs obtained from foreign countries (Akdeniz, 2019). There are 6 different erythemato-squamous skin diseases in the data set discussed in our study (İlter & Güvenir, 1998). In order to understand the diseases in the data set and the relations of these diseases, the following information was compiled by considering the diseases first [2].
Psoriasis
Psoriasis is a chronic disease characterized by inflammation with periods of exacerbation and remission, with the formation of erythematous plaques or papules with pearlescent-white scales on the skin. Its prevalence in the community is around 1-2%. It is seen in all age groups, regardless of gender [3]. Psoriasis continues with joint involvement as well as skin disease and can cause death by damaging many organs together with severe cases, accompanied by psychiatric disorders, inflammatory bowel disease, insulin resistance (Alper et al., 2016) (Aykol et al., 2011). When the crusts of the psoriasis plaque are removed, the appearance of punctate bleeding foci (Auspitz sign) is helpful in the diagnosis (Topkarcı, 2013). The histopathological findings of psoriasis are regular elongation of the rete ridges, elongation of the dermal papillae, edema of the dermal papillae, dilated blood vessels, thinning of the suprapapillary plate, intermittent parakeratosis, absence of a granular layer, perivascular and dermal infiltrates of lymphocytes (Kim et al., 2015).
Seboreic Dermatitis
Seborrheic dermatitis is a chronic inflammatory disease characterized by oily yellowish scaly and erythematous scaling patches, which can occur on the face, scalp and body folds, periodically recurs or heals (Aksoy & Aksu Arica, 2016a) (Harmanyeri et al., 1990). It is a chronic, recurrent inflammatory skin disease characterized by erythematous scaling patches and is usually located in areas rich in sebaceous glands. It is divided into infantile and adult-onset. While infantile is initially seen in the first 3 months of life, adults initially appear between the ages of 20- 40 [4-6]. It is more common in men and peaks in the 40s. While the severity of the disease increases in the winter months, the appearance of the disease improves with the effect of ultraviolet rays in the summer months (Aksoy & Aksu Arica, 2016b). The disease increases with stress, depression and fatigue (Aksoy et al., 2012). Although sebum production is thought to be the cause of the disease because the disease involvement areas are rich in sebaceous glands, sebum in patients is at a normal level. Although the disease is not seen in areas where sebaceous glands are absent, such as the palms and soles, seborrheic dermatitis is not a sebaceous gland disease, although it occurs in sebaceous areas (Doğruk Kaçar & Özuğuz, 2016). It is seen frequently in the society and is not perceived as a disease. Winter and autumn are effective in increasing the severity of the disease (Saçar & Saçar, 2010). The histopathological findings of seboreic dermatitis are parakeratosis, epidermal spongiosis, lymphocytic exocytosis, dermal inflammatory cell infiltration (Park et al., 2016).
Lichen Planus
Lichen planus is a papulosquamous, non-infectious inflammatory disease involving the skin and mucous membranes (Yanık & Albayrak, n.d.). It does not show organ involvement and involves skin, nails and mucosal surfaces. It is more common in women. Oral lichen planus has an increased risk of developing oral cancer. Therefore, its clinical classification is important for followup [7]. (Turkoglu Babakurban et al., n.d.). The histopathological findings of lichen planus are saw-tooth rete ridges, atrophy, acanthosis, hyperorthokeratosis, melanin incontinence (Cheng et al., 2016).
Pityriasis Rosea
Pityriasis rosea is a self-limiting, common acute papulosquamous inflammatory disease affecting the trunk and extremities. It is seen in children and adults and is rarely seen under the age of 10 (Kılınç, 2019). In most of the cases, the first finding is “medallion plaque”, followed by classical lesions on the trunk and proximal extremities within 5-14 days. There is no definite conclusion about which season it is specific to (Başkan et al., 2011). The histopathological findings of pityriasis rosea are spongiosis, exocytosis (Özyürek et al., 2014).
Cronic Dermatitis
It is a disease known as eczema in Turkey. Dermatitis types include atopic dermatitis, seborrheic dermatitis, contact dermatitis, allergic contact dermatitis, irritant contact dermatitis, hypereosinophilic dermatitis and other types. Atopic dermatitis is a recurrent, chronic, inflammatory skin disease that usually begins in early childhood (Yıldırım & Özcanlı, 2009). The lifetime prevalence of the disease is increasing all over the world and especially in developed countries (Ertam Sağduyu et al., 2018). The histopathological findings of cronic dermatitis are elongation of the rete ridges, prominent hyperkeratosis, minimal spongiosis (Bieber, 2010).
Pityriasis Rubra Pilaris
Pityriasis Rubra Pilaris (PRP) is a rare inflammatory disease, the etiology of which is not fully known, and the definitive treatment is still being investigated. It occurs equally in men and women. Immune system diseases and infections can be a trigger for the emergence of this disease [8-11]. In the PRP age distribution, the majority of patients are in their 10s, 50s and 60s. When classification is made according to age distribution, it is divided into 5 groups. More than 50% of the patients are adults and are in the first group. 80% of patients in the first group recover within 3 years. The patients in the second group are adults, but the disease progresses chronically. The patients in the third group consist of children aged 5-10 years, and the disease characteristics are the same as in the first group. The patients in the fourth group are children between the ages of 3-10. Well defined borders follicular hyperkeratosis and erythema are seen in the knees and elbows. Stress and dissipation are low [12,13]. The patients in the fifth group are children between the ages of 0-4 and the disease progresses chronically. The patients in the fifth and last group have the same symptoms as the first group and these patients are HIV virus carriers. It varies with treatment (Cohen et al., n.d.). The histopathological findings of pityriasis rubra pilaris are psoriasiform epidermis with areas of parakeratosis, plugs of the follicular infundibulum (Katherine L, 2003).
Related Work
In the study conducted by Güvenir et al. in 1998, VFI5 was used as a classification algorithm developed by Güvenir. In the classification process, the VFI5 algorithm was not affected by the missing data in the database. As a result of the estimation made with the VFI5 algorithm during the preparation of the data, it was revealed that the specialist doctor was wrong in two diagnoses. With cross validation (10 fold cross validation) analysis, 96.2% correct classification was made with the VFI5 algorithm [14-18]. In order to determine the most suitable features for classification, after the weight values of the features were determined by the genetic algorithm method, when the classification was made over the features with the appropriate weight value, the classification was 99.2% higher than the VFI5 algorithm (Güvenir et al., 1998). In the study conducted by Güvenir and Emeksiz in 2000, a comparison was made using 3 different methods in the classification of erythemato-squamous skin diseases. K-NN classification, Naive Bayesian classification and VFI5 classifications were applied and their effectiveness was compared with cross-validation analysis. In addition, it is aimed to make effective use in the field by developing an interface in the C++ programming language of these classifications (Güvenir & Emeksiz, n.d.).
In the study conducted by Übeyli et al. in 2005, a classification study was carried out on the UCI database by using the adaptive network-based fuzzy inference system (ANFIS), which is a combination of artificial neural networks and fuzzy logic. The accuracy of the classification study made with the ANFIS system was measured with the confusion matrix and the classification result was obtained with an accuracy of 95.5% (Übeyli & Güler, 2005). In the study carried out by Karabatak and Ince in 2009, a classification system based on neural networks (Neural Network) and matching rule (Assosation Rule) was used [19]. In their study, it was stated that it was more important to determine the features of the classes rather than the classification, and the determination of the most accurate features that could provide a high rate of classification was provided by the AR2 method developed by Karabatak. As a result of classification using neural networks with 24 features determined by AR2 instead of 34 features in the database, an accuracy of 98.6% was obtained (Karabatak & Ince, 2009). In the study conducted by Abdi and Giveki in 2013, the AR-PSO-SVM system, which is a supervised learning method, was used to classify the data on erythemato-squamous diseases in the relevant database. The age attribute was excluded from the scope of the study since there were records with missing age information in the database. By using the matching rule defined by Karabatak as the matching rule (AR), 24 features were determined by simplifying the features [20]. The reason for using particle swarm optimization is to optimize the parameters required by the support vector machine. By determining the most appropriate input parameters with PSO, classification was made with an accuracy of 98.91% using confusion matrix measurement with SVM (Abdi & Giveki, 2013).
In the study carried out by Xie and Wang in 2011, the number of features was reduced to 21. In their study, the support vector machines have high performance in classification. But if the number of features in the used database is high, an over-learning situation will occur, a hybrid optimization process has been applied by applying the filtering with the F-score method developed on the features and the comprehension method with the forward sequential search method [21,22]. Grid search method was applied to determine the necessary parameters in the support vector machines method, which will be applied after the features are determined. As a result of their study, classification was made with an accuracy rate of 98.61% (Xie & Wang, 2011). In the literature review study conducted by Thomsen et al. in 2019, classification studies on dermatology datasets and dermatology images and the prediction rates obtained are presented in tables (Thomsen et al., 2020). In the literature review on the dermatology dataset, which is the subject of our study, in the article study titled “Medical Diagnosis by Feature Selection using Particle Swarm Optimization and Support Vector Machine” by Daliri, the features of the Daliri dermatology database were optimized by using binary particle swarm optimization (BPSO) method. The number of 34 features was reduced to 20 and classification was made with 100% accuracy (Daliri, 2012).
As a result of the comprehensive research conducted by Wang et al. in 2019, the methods of detecting outlier data to be removed from the dataset were discussed (Wang et al., 2019). Classification study was carried out by Anifah and Haryanto in the classification study in 2021 with the Linear Vector Quantization method. As a result of the study, classification studies were carried out with an accuracy of 40% for pporiasis, 45% for seborrheic dermatitis, 30% for lichen planus, 45% for pityriasis rosea, 50% for chronic dermatitis and 90% for pityriasis rubra pilaris (Anifah & Haryanto, 2022). In the classification study conducted by Alotaibi in 2022, a hybrid algorithm named K-nearest neighbor (KNN) and ReleifF was developed. While classification was made with the traditional KNN algorithm with an accuracy of 85.13%, the hybrid KNN model he developed was classified with an accuracy of 94.59% (Alotaibi, 2022). In the classification study conducted by Elsayad et al. in 2022, classification was made with an accuracy of 99.07% using the Bayesian and SVM hybrid algorithm (Elsayad et al., 2022). In the classification study conducted by Al-Kahlout et al. in 2021, a classification study was carried out with an accuracy of 98.36% with artificial neural networks and JNN (Just Neural Network) tool. (Al-Kahlout et al., 2021).
When the literature is examined in general, the minimum number of features has been obtained by optimizing the data set features by using support vector machines [23]. Than it has been observed that classification studies have been carried out to a maximum of 100% by working classification algorithms on the optimized data set features. It was seen that the classification results were evaluated over numbers, regardless of whether the optimized data set obtained as a result of all studies reflects the clinical and histopathological features of these diseases. In order to detect outliers in our study, relatively inconsistent data were determined in each attribute data and the records of these data were removed from the data set. In order to determine the outlier data density at the most appropriate rate, a threshold ratio was determined and classification accuracy rates were determined according to the relevant threshold value. When the threshold value is 100%, classification work is performed on all data without any elimination. Since feature loss occurred, the minimum treshold value was not lowered below 70%. Threshold values in the range of 100-70% were considered with 10% slices and classification studies were carried out on the data set from which outlier values were removed [24].
By combining the classification results obtained according to the threshold values in the range of 100-70%, the threshold value that provides the highest number of high classification rates among the classification methods used was determined. By applying the 5-fold cross-validation method to the results obtained, the machine learning method that provides the highest classification rate was determined [25]. Among the Logistic Regression, KNeihgbors Classifier, Support Vector Classifier, Gaussian Naive Bayes, Decision Tree Classifier and Random Forest Classifier classification methods, the Gaussian Naive Bayes method gave the best result with a rate of 100%. It was determined that the data set obtained by outlier elimination was compatible with the clinical and histopathological features of these diseases.
Materials and Methods
Data Set
In this study, the dataset of erythemato-squamous skin diseases in the machine learning database of the University of California Irvine (UCI) at https://archive.ics.uci.edu/ml/datasets/ dermatology was used. The data set was first prepared by Prof. Dr. H. Altay GÜVENIR, Prof. Dr. Nilsel ILTER and Dr. Gülşen DEMİRÖZ as “Diagnosis of Erythema-Scaly Diseases with VFI Algorithm” (Güvenir et al., 1998), the data set was provided by Prof. Dr. Nilsel İLTER at Gazi University Department of Dermatology (Güvenir & Emeksiz, n.d.).
Features
The data set in the file named “dermatology.data” consists of 366 records of 34 different features separated by a comma. When the features are examined, the features 1, 2, 3, 4, 5, 6, 7, 8, 9, 10, 11 and 34 contain the values of the clinical findings. Features between 12 and 33 contain the values of the histopathological findings. Except for the age feature number 34, all features between 1 and 33 have values between 0 and 3. Age feature has 8 unknown value and 358 values varying between 0 and 75 [26]. Number of patients are : Psoriasis 112 patients, Seborrheic dermatitis 61 patients, Lichen planus 72 patients, Pityriasis rosea 49 patients, Cronic dermatitis 52 patients, Pityriasis rubra pilaris 20 patients. Totally 366 patients available on dataset.
The clinical and histopathological features are explained as below.
Clinical features : (with values 0, 1, 2, 3)
• Erythema (The severity of erythema in wounds)
• Scaling (Squam, dandruff peeling off the skin, dandruff amount in the lesions)
• Definite borders (Whether the wounds are sharply circumscribed)
• Itching (Intensity of itching in wounds)
• Koebner phenomenon (Limited manifestation of dermatological disease in the area of stimulation as a result of traumatic stimulation of the skin (Rifaioğlu et al., 2014)) • Polygonal papules (Multi-edged, raised, less than 1 cm in diameter lesions on the skin)
• Follicular papules (Swellings less than 1 cm in height, distributed at equal distances from each other)
• Oral mucosal involvement (Lesions formation in the oral mucosa)
• Knee and elbow involvement (Lesions formation on knees and elbows)
• Scalp involvement (Lesions formation on the scalp)
• Family history, (0 - 1) (Whether there is a family history) • Age (Have linear values)
• Histopathological features : These are the findings obtained by biopsy taken from patients. (values are in the range of 0, 1, 2, 3)
• 12: Melanin incontinence (Brown granules that appear on the skin under the epidermis layer)
• Eosinophils in the infiltrate (An increase in a type of white blood cell)
• PNL infiltrate : Polymorphonuclear leukocyte spread. Migration and arrival of neutrophils to the disease site. Increase in the number of white blood cells of leukocytes, inflammation.
• Fibrosis of the papillary dermis : Accumulation of new fibrotic material (collagen) due to disease in the papillary dermis layer of the skin.
• Exocytosis : Accumulation of white blood cells towards the epidermis.
• Acanthosis : Thickening of the epidermis layer.
• Hyperkeratosis : Thickening of the keratin layer.
• Parakeratosis : Nuclear cell formation in the keratin layer.
• Clubbing of the rete ridges : Clubbing of the ridges of the rete.
• Elongation of the rete ridges : Elongation of the ridges of the rete.
• Thinning of the suprapapillary epidermis : Thinning of the epidermis over the papillary dermis.
• Spongiform pustule : Spongy vesicles (pustules) filled with pus (neutrophils)
• Munro microabcess : Small vesicles filled with neutrophils in the epidermis.
• Focal hypergranulosis : Focal thickening of the granular layer of the epidermis.
• Disappearance of the granular layer : Disappearance of the granular layer of the epidermis.
• Vacuolisation and damage of basal layer : Formation of spongy cavities as a result of damage to the basal layer.
• Spongiosis : Edema between epidermis cells.
• Saw-tooth appearance of retes : Formation of rete ridges in a sawtooth appearance.
• Follicular horn plug : Formation of plugs in hair follicles.
• Perifollicular parakeratosis : Presence of nucleated cells around the hair follicle in the corneum layer.
• Inflammatory mononuclear infiltrate : Migration of mononuclear inflammatory cells.
• Band-like infiltrate : Migration of white blood cells in band appearance.
Classification of Dataset Features
In order to determine which disease class is associated with clinical and histopathological features in the data set, a ratio between 0-3 values was first made. All features are scaled except for Age and Class features. As a result of this process, the ratio of each feature belonging to the disease class was determined with a value between 0-3. The classification rates of each feature are determined by graphics and these values are shown separately in the table. While some features are seen in more than one disease, it has been determined that some of them are specific to the related disease. All the features in the data set were charted separately and the average values of each feature were calculated according to the disease it belongs to. Values between 1 and 6 on the x-axis of the figures represent 1-Psoriasis, 2-Seberoic dermatitis, 3-Lichen planus, 4-Pityriasis rosea, 5-Cronic dermatitis and 6-Pityriasis rubra pilaris diseases, respectively. The numbers in the range of 0-3 on the y-axis in the figures show the average values of these diseases in the data set of the related feature. Figure 1 shows the mean values of the diseases of the Erythema feature in the data set. In Psoriasis as number 1 and Seboric dermatitis as number 2, Erythema has the highest incidence rate with a value of 2.3 according to the ratio values in the 0-3 range. With a value of 1.5, the Erythema feature has the lowest incidence in chronic dermatitis.
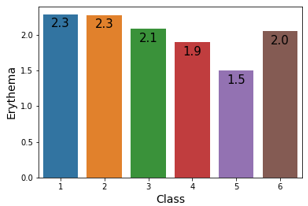
Figure 1: Erythema feature.
In Figure 2, the Definitive borders feature in the data set is seen at the highest rate in 1-Psoriasis and 3-Lichen Planus diseases, with the lowest rate of 0.8 in 5-Cronic dermatitis. In Figure 3, the Itching feature in the data set is seen at the highest rate in 3-Lichen planus disease, with the lowest rate of 0.5 in 4-Pityriasis rosea and Pityriasis rubra pilaris diseases. In Figure 4, the Koebner phenomenon feature in the dataset is included in 1-Psoriasis, 3-Lichen planus and 4-Pityriasis rosea diseases, while it is not seen in other diseases such as 2- Seborrheic dermatitis, 5- Cronic dermatitis and 6- Pityriasis rubra pilaris and does not have any value. The Band-like infiltrate feature in Figure 5 and dataset is only seen in 3-Lichen planus disease and has a rate of 2.7 in this disease. The Clubbing of the rete ridges feature in Figure 6 and dataset is seen only in 1-Psoriasis disease and has a rate of 2.1 in this disease. Perifollicular parakeratosis feature in the data set in Figure 7 is seen only in 6-Pityriasis rubra pilaris disease and has a rate of 2.0 in this disease. The Fibrosis of the papillary dermis feature in the data set in Figure 8 is only seen in 5-Cronic dermatitis disease and has a rate of 2.3 in this disease.
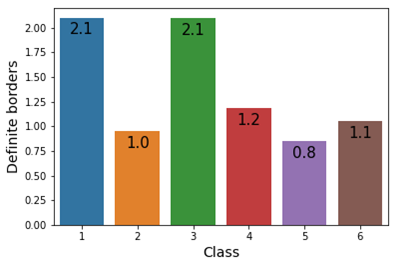
Figure 2: Class feature.
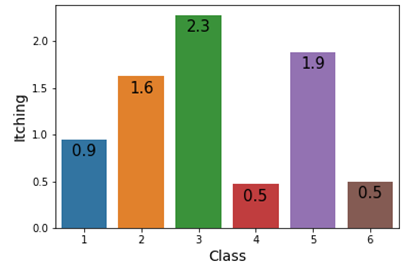
Figure 3: Itching feature.
Figure 9 shows the age distribution of the Age feature in the data set according to the diseases. While patients between the ages of 0-40 are observed in 1-Psoriasis, 2-Seborrheic dermatitis, 3-Lichen planus, 4-Pityriasis rosea and 5-Cronic dermatitis diseases, the age range of patients in 6-Pityriasis rubra pilaris disease has values of 0-10.
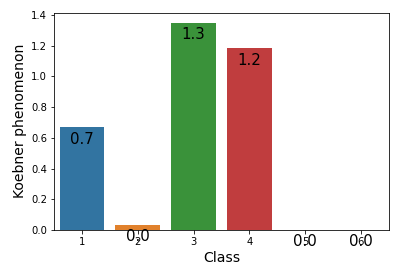
Figure 4: Koebner phenomenon feature.
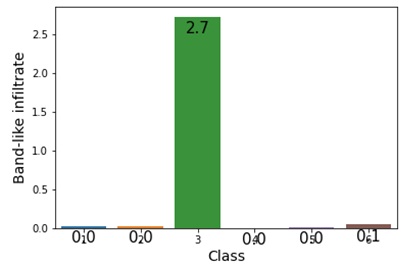
Figure 5: Band-like infiltrate feature.
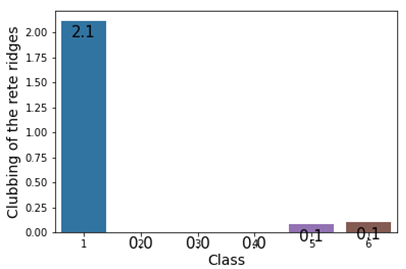
Figure 6: Clubbing of the rete ridges feature.
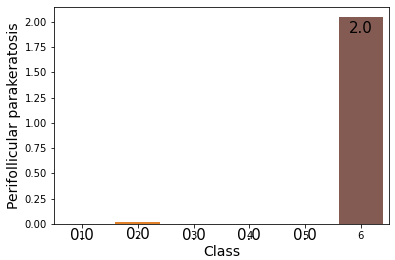
Figure 7: Perifollicular parakeratosis feature.
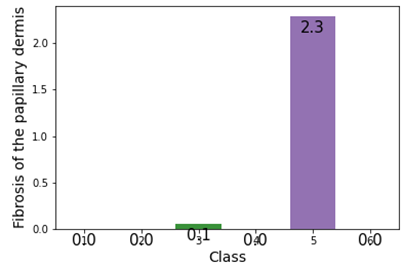
Figure 8: Fibrosis of the papillary dermis feature.
In Figure 10, a statistical graph was drawn instead of the mean values of the age ranges of the patients in the data set. Thanks to this graph, the value of a 22-year-old patient who was found to be outlier in 6-Pityriasis rubra pilaris disease outside the 7-16 age range is shown as a dot in the 6th column. When the conditions seen in seborrheic dermatitis are examined in the introduction part of our article, it is understood that Koebner phenomenon should not be seen in this disease. When the dataset is examined, the outlier value of “2” in the Koebner Phenomenon attribute is seen in the data of Seborrheic Dermatitis disease. Table 1 shows the outlier value of the Koebner phenomenon in red sign. In dataset, Class 2 indicates the disease name of Seborrheic dermatitis and has 61 patient records. Koebner phenomenon feature has 60 “0” value and only one “2” value. This single outlier value affects the ratio of machine learning classifications scores. The presence of such outliers in the dataset reduces the classification performance of machine learning algorithms [27]. For this reason, it is aimed to develop an algorithm and delete the outliers that are not compatible with the data density from the data set.
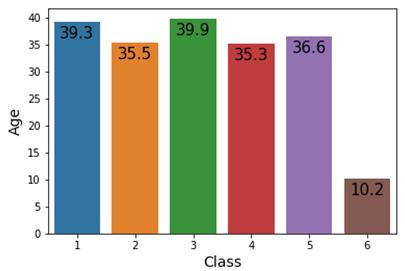
Figure 9: Age feature.
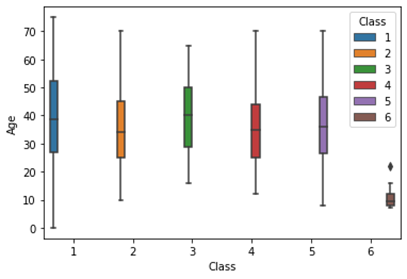
Figure 10: Statistical average value of Age feature.
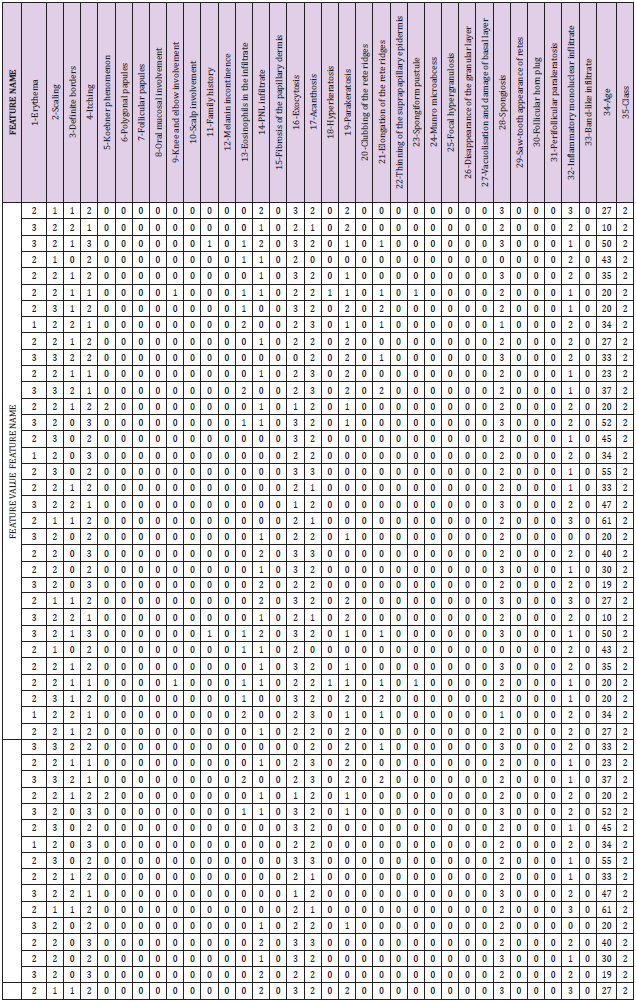
Table 1: An outlier value detected on Koebner phenomenon feature of Class 2 (Seberoic dermatitis).
A mathematical and logical algorithm has been applied as stated below to detect and delete outlier data.
C letter represents database class feature. The index i of letter C represents the class of diseases range 1-6.
F letter represents database features consist of 1 to 33. The index i of letter F represents the feature range 1-33. Age and Class features are not members of F. Equation 1 will be as follows:

Since the number of elements belonging to each class is different, the letter n represents the number of elements of the active class. The average values of all the features belonging to the Ci class are calculated separately. The average value of each feature belonging to the relevant class can be calculated by equation 2.

The values found on Ci Fj are indexed. The number of each index value in the corresponding attribute is counted. As seen in equation 3 letter v indicates indexed values of active feature of active class. And letter q_(1-33) indicates that the count of the indexed v values for each feature separately.
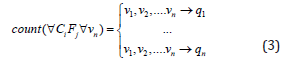
x letter represent the maximum value of q gives us the most repeated values of active feature. Equation 4 will be as follows:

y letter represent the minimum value of q gives us the least repeated values of active feature. Equation 5 will be as follows:

As used before in equation 2, we used n as the number of elements of the active class. n reflects us the count of active classes active features elements.
The ratio of the number of the most repeated values in the studied feature to the number of values of the related feature is calculated by equation 6.

We need a treshold value to be able to evaluate the ratio value we found.
In order to determine the outlier data density at the most appropriate rate, a threshold ratio was determined and classification accuracy rates were determined according to the relevant threshold value. When the threshold value is 100%, classification work is performed on all data without any elimination. Since feature loss occurred, the minimum threshold value was not lowered below 70%. Threshold values in the range of 100-70% were considered with 10% slices and classification studies were carried out on the data set from which outlier values were removed. If ratio value resulted in 1, its reflects the situation that all values of active feature has same values without not having any outlier value. Otherwise if ratio value bigger than threshold and lower than 1, its shows that active feature has outlier values to be delete from database. Algorithm will delete records which indicates y from Eq 5. This is illustrated in equation 7 below.

By equation 8, the Ratio evaluation is applied separately for all the features in the entire dataset.

With this method, all records that will be considered as outlier data are removed from the data set. Then we can apply machine learning methods on the remaining error-free data set. The general flow chart of the classification work to be done is shown in Diagrams 1 & 2. With Scheme 2, the flow chart of the machine learning methods applied on the dataset obtained by evaluating the features according to the treshold value and deleting the related records is given [27].
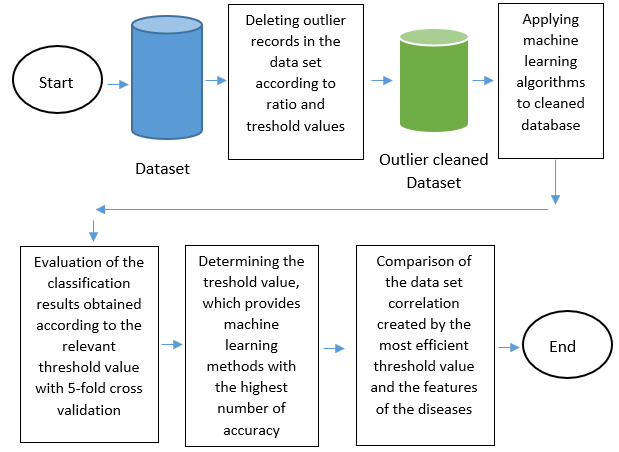
Diagram 1: General flow chart of classification work.
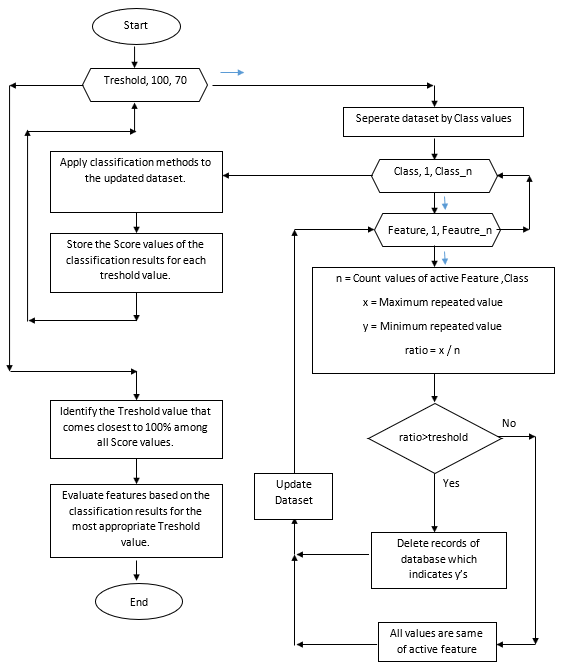
Diagram 2: Detailed flow chart of detecting the best classification method.
Performance Analysis of Classification Methods
In our study, classification methods of the Sklearn library in the Python programming language were used. The data set is divided into 33% test and 67% train sections, and classification studies will be carried out on 121 records, which corresponds to 33% of the 366 records in the data set. By using training and test data, Logistic Regression, K Neihgbors Classifier, Support Vector Classification (SVC), Gaussian NB, Decision Tree Classifier and Random Forest Classifier classification methods were applied, respectively. The classification results were evaluated by k-fold cross validation values. The results obtained without deleting the outlier records were first evaluated with the single fold cross validation method. Since feature loss occurred, the minimum treshold value was not lowered below 70%. Threshold values in the range of 100-70% were considered with 10% slices and classification studies were carried out on the data set from which outlier values were removed. By combining the classification results obtained according to the threshold values in the range of 100-70%, the threshold value that provides the highest number of high classification rates among the classification methods used was determined. By applying the 5-fold cross-validation method to the results obtained, the machine learning method that provides the highest classification rate was determined. Logistic regression, KNeighbors Classifier, Support Vector Classification, Gaussian Naive Bayes, Decision Tree Classifier and Random Forest Classifier methods were used as classification methods.
Logistic Regression: With logistic regression, a discrimination model is created according to the number of groups in the structure of the data. With this model, the new data taken into the dataset is classified. The purpose of using logistic regression is to create a model that will establish the relationship between the least variable and the most suitable dependent and independent variables. (Bircan, 2004).
KNeighbors Classifier: In the Kneighbors Classifier classification (k-nearest neighbors), a clustering is created according to the distance values of the classes depending on the k parameter value in the existing data set, and the method of classifying the new data according to the similarity to these clusters is applied. (Keskenler et al., 2021)
Support Vector Classification (SVC): Support vector classification is the process of predicting what will be the outputs of new data based on existing data. Support vector classification performs classification by finding the separator plane with the widest range between classes (Güner et al., n.d.).
Gaussian Naive Bayes: Gaussian Naive Bayes classification applies a classification algorithm based on the probability of the Gaussian distribution (Karatay & Algahani, 2021).
Decision Tree Classifier: Decision tree classifier method consists of 3 components consisting of node, branch and leaf. Questions are asked to create a tree structure using the attributes in the training data, and these processes continue until node or leaves without branches are reached (Çölkesen & Kavzoğlu, 2010).
Random Forest Classifier: The purpose of the random forest classifier classification method is to bring together the decisions made by many trees trained in different training sets instead of a single decision tree. (Daş et al., n.d.). Table 2 shows the single-fold cross-validation score values of the machine classification methods applied to the database according to each threshold value. While the Threshold value was 100%, all records were listed, while at 70%, the number of patient records decreased to 171. When the whole table was evaluated, it was determined that the classification algorithms with 80% treshold value had the highest accuracy rate. Since the rates here are determined by the single fold validation method, the 5-fold cross validation evaluation method was applied to the results obtained for the 80% treshold value found in order to obtain more accurate results.
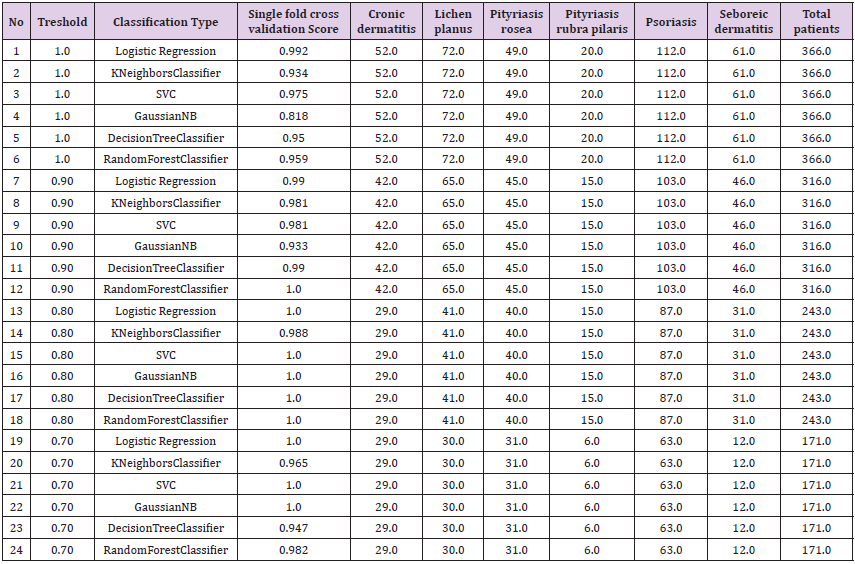
Table 2: Single fold cross validation scores obtained between 100% - 70% treshold values.
When Table 3 is examined, it is seen that there is a difference between single fold validation and 5-fold cross validation values. Since the 5-fold cross validation is applied on the entire dataset due to its structure, it gives more accurate results about the performance of the classification method. When the normal classification results and the classification results of the Treshold value are compared, it is seen that the success rate of the threshold value classification is higher. Again, when the 5-fold cross-validation method was applied, the Gauss Naive Bayes method achieved the highest classification success with 100%. As can be seen from the Figure 11, it has been determined that classification success rates are in the range of 100– 96% when the treshold value is 1, and when it is at the 0.8 point, all methods show success at values close to 100%. From this graph, it is understood that by decreasing the threshold value from 1 to 0.8, 20% outlier record was detected and deleted from the table (Figure 12). As a result of the normal classification study obtained in Table 2, the correlation graph of the dataset features was drawn with Graph 2. As a result of the normal classification, it was observed that the features of the diseases did not appear clearly.
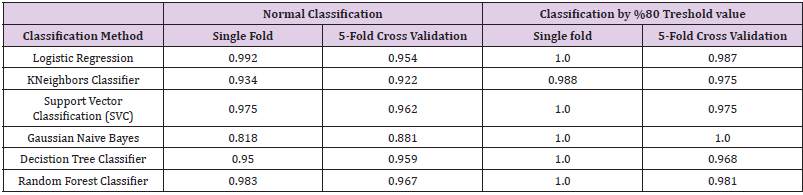
Table 3: 5-fold cross validation result table.
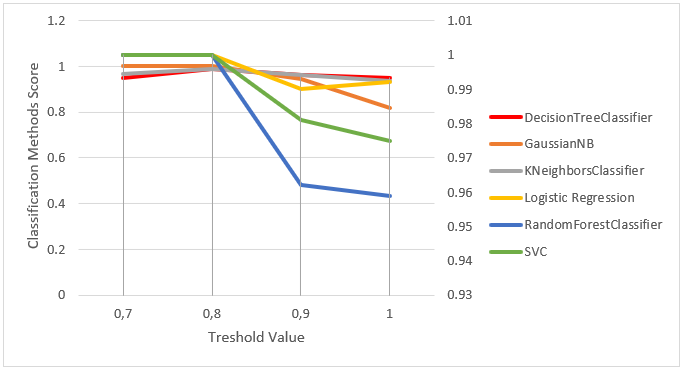
Figure 11: The success graph obtained with the threshold value of machine learning methods.
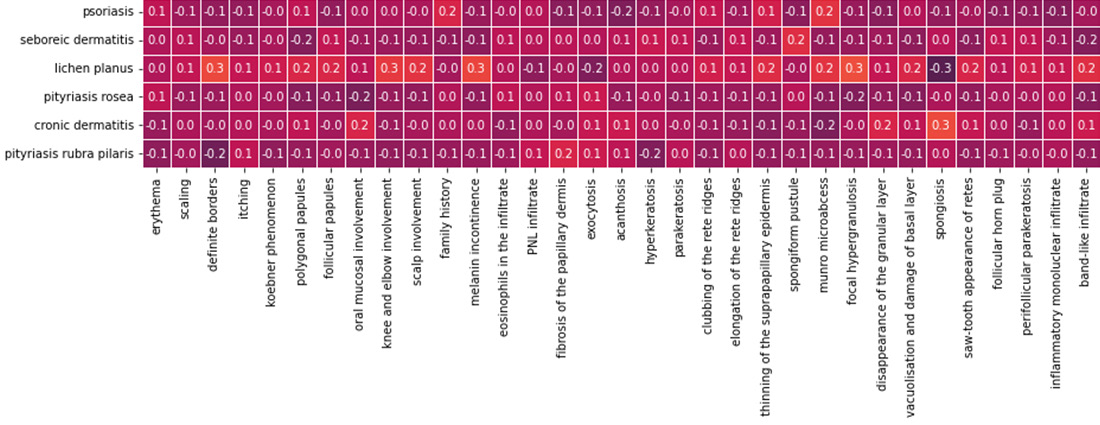
Figure 12: Dataset features correlation graph before the outlier data was cleaned.
The correlation graph of the outlier-free dataset obtained after the treshold value determined in Table 2 is shown in Figure 13. The white areas in the graph show that there is a high correlation between the related feature and the disease. Clinical and histopathological findings such as knee and elbow involvement, scalp involvement, clubbing or the rete ridges, elongation of the rete ridges, thinning of suprapapillary dermis are compatible with psoriasis. It was observed that the correlation graph of the psoriasis disease in the database, which was cleared of outlier data, was exactly compatible with the findings of this disease.
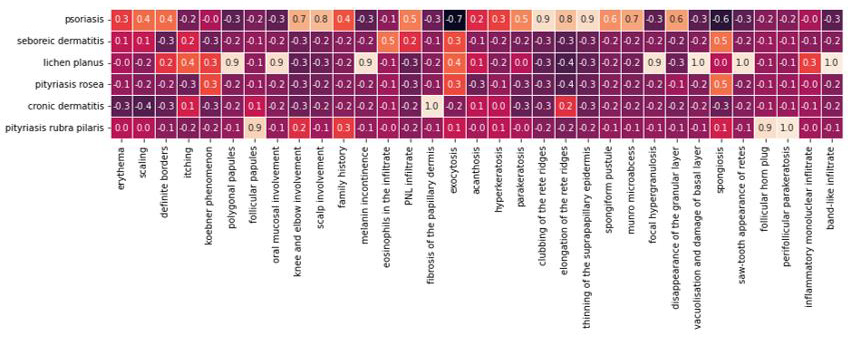
Figure 13: Dataset features correlation graph after the outlier data was cleaned.
Conclusion and Findings
Many different machine learning methods are applied in the diagnosis of erythema squamous skin diseases. Each method classifies disease with reasonable accuracy. Clinical and histopathological data obtained from the patient are used in the diagnosis of the disease. The specialist doctor uses these data to make the most appropriate diagnosis decision for the patient. With the experience of the medical profession, the specialist physician can decide whether the erroneous data is compatible with the relevant disease and can eliminate the erroneous values. Outlier values in the data set cause incorrect rates to be obtained in the results of the applied classification method. Outlier data were removed from the dataset in order to obtain a classification result that fully reflects the clinical and histopathological features of the diseases. As a result, machine learning classification rates have been successfully achieved. When the findings obtained from all these studies are evaluated:
• Although machine learning methods give effective results, a specialist doctor examination is always required.
• Outlier datas should be corrected as much as possible and these datas should be added to the data set again for an advanced working method and evaluated.
• For individuals who are suitable for the ordinary course of life, the data in this dataset is suitable for machine learning methods. However, in cases where pregnancy or other chronic diseases are accompanied, these methods will be insufficient.
• When outlier records are not deleted, classification methods consider these outlier records as part of the disease and reveal the results of misclassification.
• A feedback should be obtained as to whether the results obtained are compatible with the intended study.
References
- Abdi MJ, Giveki D (2013) Automatic detection of erythemato squamous diseases using PSO SVM based on association rules. Engineering Applications of Artificial Intelligence 26(1): 603 608.
- Al Kahlout BI, Naeem MM, Shepherd MJ (2021) ANN for the Classification of Eryhemato Squamous Disease. International Journal of Academic and Applied Research (IJAAR) 5(4): 47-55.
- Alotaibi AS (2022) Hybrid Model Based on Relief F Algorithm and K Nearest Neighbor for Erythemato Squamous Diseases Forecasting. Arabian Journal for Science and Engineering 47(3): 1299-1307.
- Anifah L Haryanto (2022) Decision Support System Erythemato Squamous Diseases Classification Diagnosis Using Linear Vector Quantization Based Clinical Atributes, pp. 254-258.
- Bieber T (2010) Atopic dermatitis. Annals of Dermatology 22(2): 125-137.
- Bircan H (2004) Lojistik Regresyon Analizi. Issue 2.
- Cheng YSL, Gould A, Kurago Z, Fantasia J, Muller S (2016) Diagnosis of oral lichen planus: a position paper of the American Academy of Oral and Maxillofacial Pathology. Oral Surgery, Oral Medicine, Oral Pathology and Oral Radiology 122(3): 332-354.
- Çölkesen I, Kavzoğlu T (2010) Classification of Satellite Images Using Decision Trees: Kocaeli Case. Electronic. Journal of Map Technologies 2(1): 36-45.
- Daliri MR (2012) Feature selection using binary particle swarm optimization and support vector machines for medical diagnosis. Biomedizinische Technik 57(5): 395-402.
- Daş B, Türkoğlu I, Üniversitesi F, Fakültesi T, Mühendisliği Y, et al. (2014) DNA Dizilimlerinin Sınıflandırılmasında Karar Ağacı Algoritmalarının Karşılaştırılması.
- Elsayad AM, Nassef AM, Al Dhaifallah M (2022) Bayesian optimization of multiclass SVM for efficient diagnosis of erythemato squamous diseases. Biomedical Signal Processing and Control 71: 103223.
- Güner N, Çomak E, Üniversitesi P, Fakültesi M, Bölümü BM (2011) Mühendislik Öğrencilerinin Matematik I Derslerindeki Başarısının Destek Vektör Makineleri Kullanılarak Tahmin Edilmesi Predicting Performance of First Year Engineering Students in Calculus by Using Support Vector Machines.
- Güvenir HA, Demiröz G, İlter N (1998) Learning differential diagnosis of erythemato squamous diseases using voting feature intervals. In Artificial Intelligence in Medicine 13(3): 145-165.
- Güvenir HA, Emeksiz N (2000)An expert system for the differential diagnosis of erythemato squamous diseases. Expert Systems with Applications 18(1): 43-49.
- Karabatak M, Ince MC (2009) A new feature selection method based on association rules for diagnosis of erythemato squamous diseases. Expert Systems with Applications 36(10): 12500-12505.
- Karatay S, Algahani M (2021) 1999 Marmara Depremi ve Güneş Tutulmasının Naive Bayes Sınıflayıcısı ile İstatistiksel Analizi. European Journal of Science and Technology 22: 643-648.
- Katherine LMW (2003) Pityriasis rubra pilaris. Dermatology Online Journal 9(4): 6
- Keskenler MF, Dal D, Aydın T (2021) Yapay Zeka Destekli ÇOKS Yöntemi ile Kredi Kartı Sahtekarlığının Tespiti. El Cezeri Fen ve Mühendislik Dergisi 8(2): 1007-1023.
- Kim BY, Choi JW, Kim BR, Youn SW (2015) Histopathological findings are associated with the clinical types of psoriasis but not with the corresponding lesional psoriasis severity index. Annals of Dermatology 27(1): 26-31.
- Nanni L (2006) An ensemble of classifiers for the diagnosis of erythemato squamous diseases. Neurocomputing 69(7-9): 842-845.
- Özyürek GD, Alan S, Çenesizoʇlu E (2014) Evaluation of clinico epidemiological and histopathological features of pityriasis rosea. Postepy Dermatologii i Alergologii 31(4): 216-221.
- Park JH, Park YJ, Kim SK, Kwon JE, Kang HY, et al. (2016) Histopathological differential diagnosis of psoriasis and seborrheic dermatitis of the scalp. Annals of Dermatology 28(4): 427-432.
- Rifaioğlu E NŞ En BB, Ekiz Ö (2014) Tatuaj Komplikasyonu Olarak Koebner Fenomeni; Psoriasis Tanılı Bir Olgu. Turk Dermatoloji Dergisi 8(4): 244-245.
- Thomsen K, Iversen L, Titlestad TL, Winther O (2020) Systematic review of machine learning for diagnosis and prognosis in dermatology. In Journal of Dermatological Treatment 31(5): 496-510.
- Übeyli ED, Güler I (2005) Automatic detection of erythemato squamous diseases using adaptive neuro fuzzy inference systems. Computers in Biology and Medicine 35(5): 421-433.
- Wang H, Bah MJ, Hammad M (2019) Progress in Outlier Detection Techniques: A Survey. IEEE Access 7: 107964-108000.
- Xie J, Wang C (2011) Using support vector machines with a novel hybrid feature selection method for diagnosis of erythemato squamous diseases. Expert Systems with Applications 38(5): 5809-5815.
