 Research Article
ABSTRACT
Osteoarthritis (OA) is a painful, degenerative condition which affects the joints of the elderly population. Caused by the wearing down of the cartilaginous surfaces and thereby enabling bone surfaces to directly contact each other, the most commonly affected joints are the hip and knee. As the mechanisms of OA progression become elucidated, the bone marrow microenvironment is suspected to be more involved than previously thought. This investigation examined the quantity of hematopoietic elements T-lymphocytes, B-lymphocytes, macrophages, megakaryocytes, myeloid cells, and erythroid precursors as assessed by immunohistochemistry in formalinfixed paraffin-embedded femurs resected during hip replacement as they compared to those in a control group of normal bone marrow biopsies taken from the posterior iliac crest. Tissue analysis demonstrated a significant increase in erythroid precursors, decrease in megakaryocytes, and decrease in available iron stores in OA bone marrow. Together, these results suggest a stressed bone marrow microenvironment associated with OA joints.
Keywords: Osteoarthritis; CD71; Iron; Hematopoiesis; Erythroblasts
Introduction
Affecting over 60% of the elderly population, osteoarthritis (OA) has come to be one of the most common joint diseases to affect aging society and leads to the incapacity of joint movement [1]. Caused primarily by mechanical factors including age, obesity, inactive lifestyle, joint injury, and occupation, alterations in gene expression in cartilage and subchondral bone tissue may accelerate the rate of OA disease progression [2]. During alteration of joints in OA, the cartilage covering the ends of the bone become eroded, so the bone surfaces no longer glide across each other, but grind into each other releasing pieces of cartilage and bone into the joint space thereby causing pain and disability. The degenerative changes which include thinning of cartilage layers, increase in subchondral bone content, increased underlying bone remodeling, and fissures which penetrate both cartilage and bone have been well documented [2-9]. Qualitative and quantitative studies have evaluated adipocyte, T-cell, B-cell, macrophage, megakaryocyte, granulocyte, osteoblast, osteoclast, and osteocyte activity that affects the cartilage and subchondral bone in OA [10-18]. The goal of the study was to evaluate the hematopoietic elements in the proximal end of the osteoarthritic femur head as they compare to hematopoietic elements in normal bone marrow aspirates collected from the traditional posterior iliac crest to determine whether the joint pressure and bone degeneration influences the underlying blood cell fractions.
Materials and Methods
This study was approved by the University of Tennessee Health Science Center Internal Review Board IRB number 22-08576-NHSR. Twenty-one formalin-fixed paraffin-embedded osteoarthritic femur head tissues and 13 normal bone marrow biopsy tissues were obtained from the UT shared tissue resource. Only samples evidencing areas of 40% - 60% hematopoietic cells compared with adipocytes were selected for evaluation, and only those selected areas were used for image collection and analysis. Tissue sections were cut at 4 micrometers, were mounted on plus-charged microscope slides, and were placed in a 60°C oven overnight to dry. A hematoxylin and eosin stain was used to visualize the tissue elements and determine appropriate regions of interest.
An iron stain was performed by deparaffinizing tissue sections through several changes of xylene, 1 minute each, and graded alcohols and deionized (DI) water, 10 seconds each. Equal portions of 10% potassium ferrocyanide (424135000, ACROS Organics, NJ, USA) and 20% hydrochloric acid (A144S-212, Fisher Scientific, NJ, USA) were mixed and sections were submersed in this solution for 20 minutes. After a 1-minute tap water rinse, the sections were stained in nuclear fast red solution (STNFRLT, American MasterTech Scientific, Inc., CA, USA) for 5 minutes, rinsed briefly in running tap water, and then were dehydrated through several changes of absolute ethanol and xylene before being cover slipped with a resinous mounting medium.
For immunohistochemistry (IHC) applications, the Bond™ Polymer Refine Detection Kit (DS9800, Leica Biosystems, IL, USA) was used for visualization of the following antibodies: CD3 (103R- 96, Cell Marque/Sigma Millipore, MO, USA), low pH, 1:400, CD20 (ACR3004B, BioCare Medical, CA, USA) high pH, 1:100, CD68 (M0876, Dako/Agilent, CA, USA), high pH, 1:100, Myeloperoxidase light chain (MPO) (sc-365463, Santa Cruz Biotechnology, CA, USA), high pH, 1:500, CD42b (SZ2) (sc-59052, Santa Cruz), high pH, 1:100, and CD71 (NCL-L CD71-309, Leica Biosystems), low pH, 1:80. The tissue sections underwent heat-induced antigen retrieval using a decloaking instrument and the appropriate solution pH as indicated for each antibody above. The IHC steps consisted of the following: A peroxidase block was applied for 5 minutes and then rinsed briefly using tris buffered saline (TBS) 1X Envision™ Flex Wash buffer (DM831, Dako/Agilent) before application of the primary antibody at room temperature for 20 minutes. Thereafter, sections were rinsed with TBS, the kit post primary antibody was applied for 8 minutes, and another TBS rinse followed. The kit polymer reagent was used for 8 minutes followed by TBS and DI water washes before the kit diaminobenzidine reagent was applied for 2 minutes for chromogenic labeling. A kit hematoxylin counterstain was applied for 5 minutes followed by TBS and DI water rinses. The sections were allowed to air dry and were briefly immersed in xylene prior to cover slipping with a resinous mounting medium.
For CD3, T-cell marker, and CD20, B-cell marker, 3 images were obtained using a 40x objective on an Olympus BX45 light microscope (Olympus Corp, Tokyo, Japan) and CellSens software (Olympus). Positively-labeled cells were counted in each field and results reported as an average. For MPO, myeloid cell marker, CD71, red blood cell precursor marker, and CD68, macrophage marker, 3 images were also captured using a 40x objected. However, because positive cell numbers were very large and because the cells adjacent to each other were difficult to reliably count, positivity was evaluated using NIH ImageJ software (https://imagej.nih.gov). The counts represent the amount of brown chromogen present as a percentage of hematopoietic area analyzed. Adipocytes were subtracted from the areas analyzed. Because the kit utilized an amplification step to increase the chromogenic labeling and therefor overall area occupied by each positively-labeled cell, analyzed fraction percentages may exceed 100% when added together. However, with the exception of the myeloid:erythroid, the fraction populations were not compared against each other, but instead were compared only between the OA patient samples and control group samples. Megakaryocyte counts using CD42b were performed on 3 high-powered fields (40x) and iron positivity was graded with a low power (10x) objective using the grading scale 0 - 3 where 0 = no iron present, 1 = minimal iron stores, 2 = moderate iron stores, and 3 = marked iron stores present. For all cell fractions, only areas which were 40% - 60% hematopoietic cellularity were analyzed. Statistical analysis was performed using Microsoft Excel data analysis tool t-Test: Two-Sample Assuming Equal Variances.
Results
B-lymphocytes, T-lymphocytes, and macrophages were found to be slightly increased in OA specimens as compared to control specimens, but the increases were not statistically significant (Table 1, Figures 1 & 2). The myeloid cell component was found to be decreased in OA as compared to that of the control group, but, again, there was no statistical significance to that value. However, the megakaryocyte component was found to be significantly decreased and the CD71+ erythroid fraction was found to be significantly increased in OA cases over the control group (Table 1, Figures 1-3). Because the red blood cell component was increased with no corresponding increase in the myeloid component, the myeloid to erythroid ratio (M:E) in OA cases was decreased (0.98 ± 0.26) compared to the control group (1.66 ± 0.71) and the difference was statistically significant (p-value 0.0005). The presence of iron stores was noted to be distinctly decreased in OA samples (0.16 ± 0.37) as compared to control bone marrow samples (1.08 ± 1.04) with a p-value of 0.001.
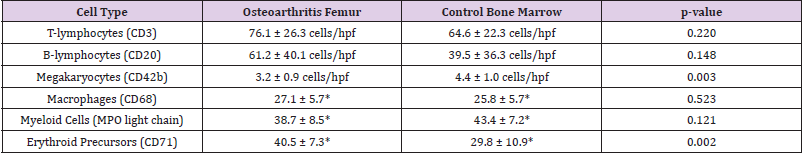
Table 1: Hematopoietic cell fractions in osteoarthritis bone marrow compared to normal bone marrow biopsies.
Note: *Measured as percentage of hematopoietic area occupied.
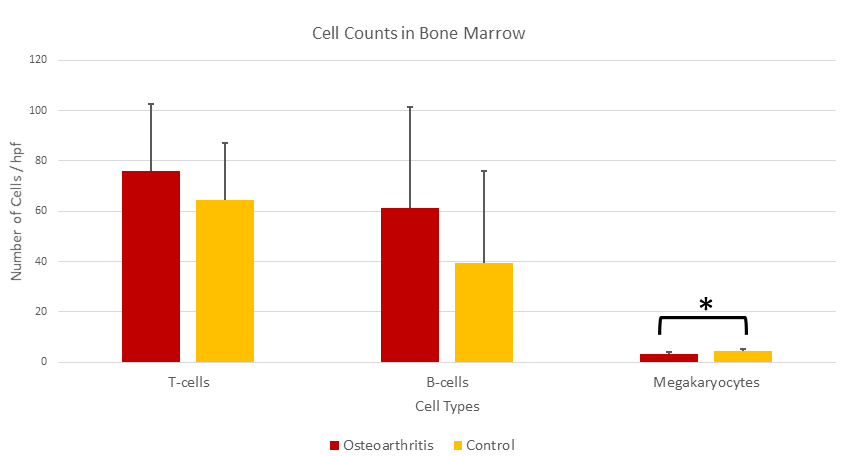
Figure 1: Average number of T-cells, B-cells, and megakaryocytes per high power field (40x) in osteoarthritis bone marrow as compared with control bone marrow. While numbers of T-cells and B-cells present were not significantly different, the number of megakaryocytes in osteoarthritis cases was significantly decreased.
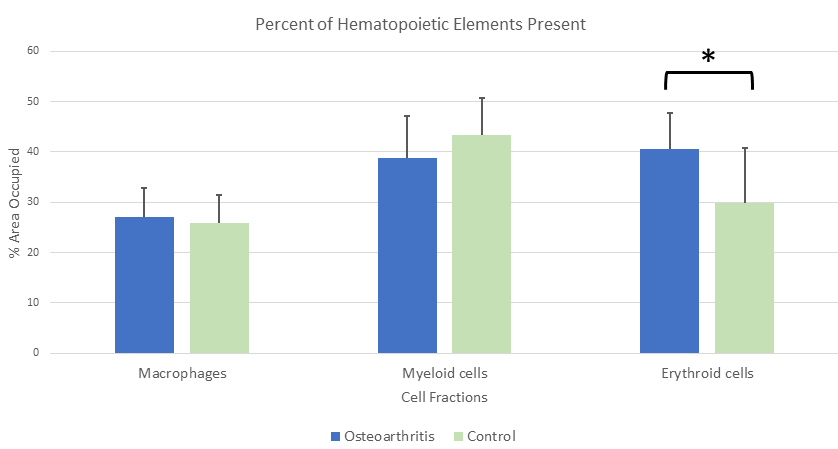
Figure 2: The relative fraction of macrophages, myeloid cells, and erythroid precursor cells given as a percentage of the available hematopoietic cells in osteoarthritis and normal bone marrow. Although the macrophage and myeloid components were not significantly altered, there were more erythroid precursors found in osteoarthritis bone marrow.
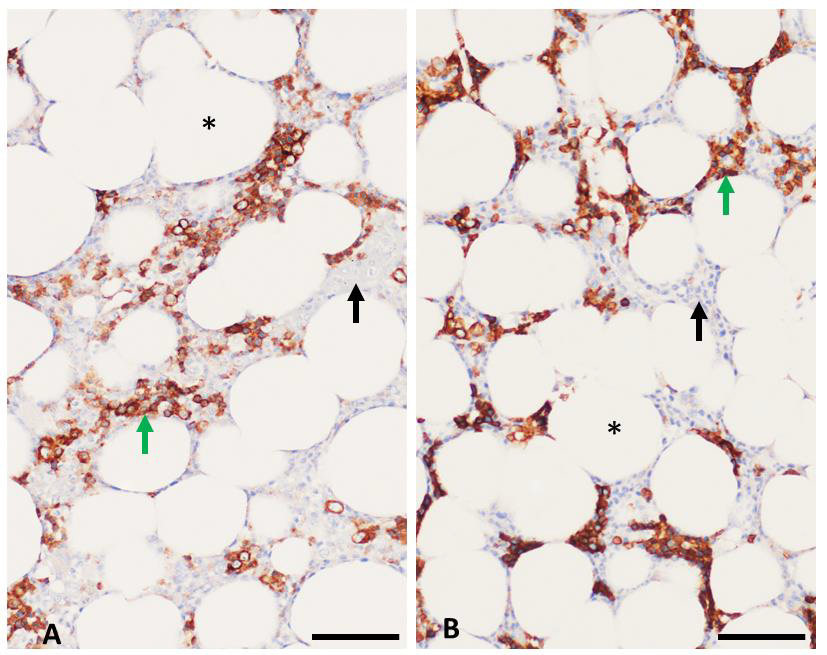
Figure 3: Immunohistochemistry assays on bone marrow. Adipocytes (*) occupied 40% - 60% of bone marrow space in the tested samples. CD71 labeling (green arrows) with brown chromogen highlights red blood cell precursors while unlabeled regions (black arrows) identify non-erythroid hematopoietic elements.
a) Control tissue demonstrated approximately 30% positivity while,
b) Osteoarthritis marrow demonstrated approximately 40% positivity. Scale bar = 50 micrometers.
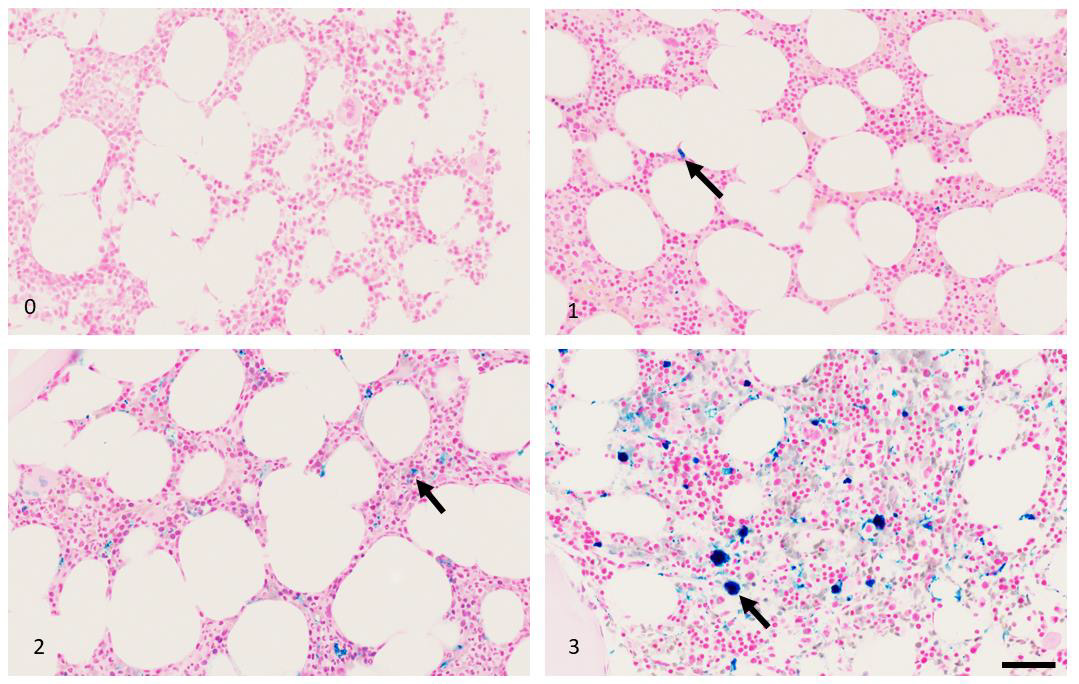
Figure 4: Iron pigment (black arrows) as assessed by Prussian Blue stain for iron, grades 0-3. Scale bar = 50 micrometers.
Discussion
Cartilage growth and maintenance are carefully regulated by appropriate load bearing on the joint. Increase in water content in cartilage softens the matrix allowing for microtears which enlarge with load bearing and eventually lead to flaking of bone and cartilage into the synovial space [1]. Breakdown of cartilage and subchondral bone may allow for exchange of larger-than-normal molecules to influence signaling pathways and increase cross-talk between the normally unconnected compartments of synovium and bone marrow [19]. Studies have shown cellular fractions such as macrophages, osteoblasts, osteocytes, adipocytes, T-cells, B-cells, megakaryocytes, granulocytes, and osteoblasts found in the bone/bone marrow may affect, or be affected by, the cartilage and subchondral bone changes seen in OA joints [10-18].
This study reviewed the quantity of hematopoietic cells found in subchondral bone marrow in OA proximal femurs. Most hematopoietic elements including myeloid cells, macrophages, T-lymphocytes, and B-lymphocytes were similar in quantity to those found in normal bone marrow biopsy specimens taken from the posterior iliac crest. However, the erythroid precursor fraction was increased in OA and there was a corresponding decrease in iron stores. Although excessive iron can give rise to osteoarthritis symptoms [20,21], the relationship between iron deficiency and OA is scarce in the literature. The most common cause of hyperproliferative red blood cell progenitors in bone marrow is increased erythropoietin released in response to hypoxia sensed by the juxtaglomerular apparatus in the kidneys, typically in response to anemia. Hyperproliferation of red blood cells in the bone marrow in conjunction with decreased iron stores is characteristic of iron deficiency anemia. However, lack of access to patient clinical information including hemoglobin levels, serum iron, transferrin, and ferritin precludes a definitive diagnosis. Indeed, a previous studies suggested that OA patients over 70 years are less likely to be anemic than those who have fractured a femur [22]. While bone marrow aspirates collected from the iliac crest are thought to represent the general bone marrow population in the entire organism, it is uncertain whether discrete bone marrow compartments may evidence increases or decreases in hematopoietic lines based on local environment signals. Joints affected by OA are known to produce a myriad of chemokines, proteases, and interleukins among others which could stimulate or suppress one or more hematopoietic lineages [23]. Thus, the increase in erythroid precursors, decrease in megakaryocytes, and decrease in iron stores may reflect the state of the organismal bone marrow. Alternately, the shift in hematopoietic element production may be specifically localized to the femur head due to the mechanical stress related to OA changes. Estimated to make up <1% of the hematopoietic population under normal circumstances, the decrease in megakaryocytes could be directly related to the increased erythroid fraction resulting in reduced space in the bone marrow for megakaryocytes. Additionally, because megakaryocytes and erythroid precursors putatively stem from the same multipotent hematopoietic cell, signals from erythropoietin may drive differentiation from the megakaryocytic pathway and toward the erythrocytic pathway [24].
One limitation of this project pertains to the fact that the methods used in bone decalcification vary and can have adverse effects on subsequent tissue stains [25]. Decalcifying agents containing acid can reduce iron visualization in tissue sections. While both control and OA bone samples underwent acid decalcification with the same reagent, the length of time each was subjected to the acid reagent varied. Larger tissues such as femur heads undergo decalcification for several hours whereas bone marrow biopsies are decalcified for a brief 45 minutes. Because OA bones were subjected to longer decalcification procedure, the possibility that iron may have been leached out of those tissues cannot be excluded. However, the decalcification solution was composed of a weak acid and two of the OA bone samples did evidence clear iron deposits in tissues outside of the hematopoietic compartment suggesting that the decalcification procedures may not have adversely affected the iron stores present.
In conclusion, erythrocyte precursors in the bone marrow were found to be increased in proximal femurs in OA patients as compared to normal bone marrow biopsy specimens taking from the posterior iliac crest of control subjects. The myeloid component was not significantly decreased but nonetheless resulted in a decreased myeloid to erythroid ratio of cell fractions in the bone marrow. The iron stores were lower in OA patients which, when taken with the increase in red blood cell precursors, suggests possible iron deficiency or altered iron metabolism within the proximal femur compartment in persons with OA. Future studies are needed to assess the serum iron, transferrin, ferritin, and complete blood cell count of OA patients to determine anemia status and possible elucidation for the increased red blood cell components
Funding Sources
None.
Study Approval
This study was approved by the University of Tennessee Health Science Center Internal Review Board IRB number 22-08576- NHSR.
Conflict of Interest
The authors declare no competing interests on this project.
Contributions
a) Study design – SC,
b) Experiments – MR and SC,
c) Data Analysis – SC,
d) Manuscript Drafting and Editing – MR and SC.
References
- Sulzbacher I (2013) Osteoarthritis: histology and pathogenesis. Wien Med Wochenschr 163(9-10): 212-219.
- Sharma AR, Jagga S, Lee SS, Nam JS (2013) Interplay between cartilage and subchondral bone contributing to pathogenesis of osteoarthritis. Int J Mol Sci 14(10): 19805-19830.
- Brandt K, Myers S, Burr D, Albrecht M (1991) Osteoarthritic changes in canine articular cartilage, subchondral bone, and synovium fifty-four months after transection of the anterior cruciate ligament. Arthritis 34(12): 1560-1570.
- Dedrick D, Goldstein S, Brandt K, Oconnor B, Goulet R, et al. A longitudinal study of subchondral plate and trabecular bone in cruciate-deficient dogs with osteoarthritis followed up for 54 months. Arthritis Rheum 36: 1460-1467.
- Poole A, Kojima T, Yasuda T, Mwale F, Kobayashi M, et al. (2001) Composition and structure of articular cartilage: A template for tissue repair. Clin Orthop Relat Res 391: S26-S33.
- Bailey A, Mansell J, Sims T, Banse X (2004) Biochemical and mechanical properties of subchondral bone in osteoarthritis. Biorheology 41(3-4): 349-358.
- Brandt K, Radin E, Dieppe P, van de Putte L (2006) Yet more evidence that osteoarthritis is not a cartilage disease. Ann. Rheum. Dis 65(10): 1261-1264.
- Kwan Tat S, Lajeunesse D, Pelletier J, Martel Pelletier J (2010) Targeting subchondral bone for treating osteoarthritis: What is the evidence? Best Pract. Res. Clin. Rheumatol 24(1): 51-70.
- Dong B, Kong Y, Zhang L, Quiang Y (2017) Severity and distribution of cartilage damage and bone marrow edema in the patellofemoral and tibiofemoral joints in knee osteoarthritis determined by MRI. Experimental and Therapeutic Medicine 13(5): 2079-2084.
- Appel H, Kuhne M, Spiekermann S, Köhler D, Zacher J, et al. (2006) Immunohistochemical analysis of hip arthritis in ankylosing spondylitis: evaluation of the bone-cartilage interface and subchondral bone marrow. Arthritis Rheum 54(6): 1805-1813.
- Geurts J, Patel A, Hirschmann M, Pagenstert G, Mueller Gerbl M, et al. (2015) Elevated marrow inflammatory cells and osteoclasts in subchondral osteosclerosis in human knee osteoarthritis. Journal of Orthopaedic Research 34(2): 262-269.
- Gregory J, Barr R, Varela V, Ahearn T, Gardiner J, et al. (2017) MRI and the distribution of bone marrow fat in hip osteoarthritis. J Magn Reson Imaging 45(1): 42-50.
- Li YS, Luo W, Zhu SA, Lei GH (2017) T Cells in Osteoarthritis: Alterations and Beyond. Front Immunol 8: 356.
- Maruotti N, Corrado A, Cantatore FP (2017) Osteoblast role in osteoarthritis pathogenesis. J Cell Physiol 232(11): 2957-2963.
- Zhu S, Zhu J, Zhen G, Hu Y, An S, et al. (2019) Subchondral bone osteoclasts induce sensory innervation and osteoarthritis pain. J Clin Invest 129(3): 1076-1093.
- Zhang H, Cai D, Bai X (2020) Macrophages regulate the progression of osteoarthritis. Osteoarthritis Cartilage 28(5): 555-561.
- Liu Y, Zhang Y, Zhang J, Ma J, Bian K, et al. (2021) CD226 Is Required to Maintain Megakaryocytes/Platelets Homeostasis in the Treatment of Knee Osteoarthritis With Platelet-Rich Plasma in Mice. Front Pharmacol 12: 732453.
- Zhang L, Wen C (2021) Osteocyte Dysfunction in Joint Homeostasis and Osteoarthritis. Int J Mol Sci 22(12): 6522.
- Findlay DM, Atkins GJ (2014) Osteoblast-chondrocyte interactions in osteoarthritis. Curr Osteoporos Rep 12(1): 127-134.
- Li G, Cheng T, Yu X (2021) The Impact of Trace Elements on Osteoarthritis. Front Med (Lausanne) 8: 771297.
- Cai C, Hu W, Chu T (2022) Interplay Between Iron Overload and Osteoarthritis: Clinical Significance and Cellular Mechanisms. Front Cell Dev Biol 9: 817104.
- Maezawa K, Nozawa M, Maruyama Y, Sakuragi E, Sugimoto M, et al. (2022) Comparison of anemia, renal function, and nutritional status in older women with femoral neck fracture and older women with osteoarthritis of the hip joint. J Orthop Sci S0949-2658(21): 396-401.
- Taşoğlu Ö, Şahin A, Karataş G, Koyuncu E, Taşoğlu İ, et al. (2017) Blood mean platelet volume and platelet lymphocyte ratio as new predictors of hip osteoarthritis severity. Medicine 96(6): e6073.
- Noetzli L, French S, Machlus K (2019) New Insights Into the Differentiation of Megakaryocytes From Hematopoietic Progenitors. Arterioscler Thromb Vasc Biol 39(7): 1288-1300.
- Gayle Callis, Diane Sterchi (1998) Decalcification of Bone: Literature Review and Practical Study of Various Decalcifying Agents. Methods, and Their Effects on Bone Histology. Journal of Histotechnology 21(1): 49-58.
