 Research Article
Abstract
Quantitative Liquid Chromatography (LC) – Mass Spectrometry (MS) has revolutionized biomarker discovery and therapeutic target identification. However, during global proteome analysis of biological samples, membrane receptors and adhesion molecules which constitute 50% of drug targets, are under-represented. This is due to their low abundance and hydrophobic nature, which leads to less solubility in lysis buffers, less proteolysis by the proteases commonly used in bottom-up proteomics and reduced ionization in MS. Their detection in MS is improved by enrichment and employing specific proteolysis strategies. However, during global proteomic profiling of scanty clinical samples, additional material is unavailable for separate processing and analyses. We demonstrate that optimization of composition and duration of gradient in LC separation, within the LC-MS run, improves identification of hydrophobic proteins. Lysates of K562 cells prepared in two different buffers, were separated on three LC gradients, which differed in their steepness and duration. Greater number of proteins were identified in two gradients which were long and shallow before reaching 70% concentration of solvent A in the mobile phase and were steep to different extents thereafter. The proteins uniquely identified in these gradients, had higher content of hydrophobic amino acids and their unique identification in MS was confirmed to be due to detection of hydrophobic peptides. The study demonstrates that the separating power of LC coupled with MS can be exploited to improve the detection of hydrophobic proteins from complex protein mixtures in a single run. The strategy can be validated in diverse clinical samples to assess its wider applicability
Keywords: Hydrophobicity; LC-MS; LC Gradients; Proteomics; Biomarkers
Abbreviations: LC : Liquid Chromatography; MS: Mass Spectrometry; IDA: Information Dependent Analysis; SDS: Sodium Dodecyl Sulphate; IAA: Iodoacetamide; FA: Formic Acid; FDR: False Detection Rate
Introduction
LC-MS has evolved as a vital technology for the global identification of proteins from complex mixtures such as biological samples. It has significant applications in deciphering the differential proteomes of normal and diseased tissue in a bid to identify biomarkers for improved diagnosis, prognostication, monitoring treatment outcome [1,2] and for the identification of therapeutic targets [3,4]. However, hydrophobic membrane proteins which, show alterations in pathologies [5] and constitute 50% of drug targets [6,7], are not efficiently detected by LC-MS. The reasons for their lowered detection lies in the low abundance of majority of them individually in the cells, though together they constitute 30% of the cell proteome [8]. Other reason is their distinct chemistry due the presence of long stretches of hydrophobic residues [9,10] in their sequence, which lowers their extraction, proteolysis as well as ionization [11] in MS. Detection of the peptides generated by proteolysis is also affected by their low solubility in common reconstitution buffers [12]. The features of LC-MS-MS experimental design in bottom-up approach which favours the detection of high intensity peptides, therefore fails to detect the hydrophobic peptides from complex biological samples.
Solutions sought for most of these issues aim at specifically improving detection of hydrophobic proteins which are:
i. To compensate for their low abundance, enrichment of hydrophobic proteins [13-15] and peptides [14,16,17] prior to LC-MS [16,18] is employed;
ii. Cell lysis buffers suitable for extraction of most cellular proteins, do not extract hydrophobic proteins efficiently and several studies have employed specially designed lysis buffers for their extraction [16,19]. Bagag et al. reported that the poor detection of hydrophobic peptides due to non-compatibility of detergents required for their extraction to MS, can be overcome by analysis on APPI–MS [20];
iii. The hydrophobic proteins are poorly cleave by the specific proteases routinely used in bottom-up MS approach, thereby influencing the number of peptides generated. Specific cleavage strategies such as methionine modification by hyper oxidation or cyanogen bromide digestion have been employed for their improved cleavage [21].
However, these approaches cannot be applied while profiling the entire proteome, which is composed of proteins with different chemistries, especially for scanty clinical samples which are unavailable for separate processing [22]. In global proteome analysis of biological samples, the detection of few peptides from hydrophobic proteins which get ionized is hindered owing to the features of MS method. In the widely used shotgun proteomic approach, the peptides are subjected to stochastic selection for fragmentation based on their intensity [23]. In this information dependent analysis (IDA), peptides derived from the high abundance hydrophilic proteins, which are efficiently proteolyzed and ionized, are better represented than those which lack these features such as signaling molecules and membrane proteins [6,7]. In this study we have explored whether the separation power of LC in the LCMS experiment can be exploited to improve the detectability of hydrophobic proteins without compromising on identification of other proteins. Though, in earlier reports it has been suggested that increasing the length of the LC column improves overall protein detection [24-26], the status of detection of hydrophobic proteins is not indicated. We have assessed
a) Triton-based versus sodium dodecyl sulphate (SDS)-based lysis buffer containing mild and strong detergents respectively and
b) Variation in composition and duration of LC gradient, to check their effect on detection of hydrophobic proteins within complex protein mixtures.
Materials and Methods
Cell Culture
K562 (chronic myeloid leukemia- blast crisis) cell line was gifted by Dr. Tadashi Nagai, Jichi Medical University, Tochigi, Japan. It was maintained in RPMI-1640 medium (Gibco-Life technologies, NY, USA: cat. no. 23400-021), supplemented with 10% fetal bovine serum (Gibco-Life technologies, NY, USA: cat no. 10270-106) and 1% antibiotic (Gibco-Life technologies, NY, USA: cat no. 15240- 062).
Cell Lysate Preparation
Whole cell lysate of K562 cells was prepared using two different lysis buffers:
a. Triton buffer containing HEPES (50mM), NaCl (150mM), 1% Triton X-100, MgCl2 (1.5mM), ethylene glycol-bis(β- aminoethyl ether)-N,N,N′,N′-tetraacetic acid (5mM), ethylenediaminetetraacetic acid (5mM), NaF (1.5mM), leupeptin (1mM), phenylmethylsulfonyl fluoride (2mM), 10μg/ml pepstatin, 10μg/ml aprotinin, Na3VO4 (1mM) or
b. SDS buffer containing 10% glycerol, 2% SDS, 5% β-mercaptoethanol and Tris (pH 6.8, 62.5mM). For Triton buffer based lysate preparation, 1×10⁶ cells were suspended in 100μl Triton buffer, lysed by incubating on ice for 20min, centrifuged at 13,000×g for 15min, and the supernatant was collected. Lysate preparation using SDS buffer was carried out as described previously [27] using 1×10⁶ cells.
Sample Processing for LC-MS/MS
Sample processing for LC-MS/MS was carried out as described earlier [27]. Briefly, acetone precipitated whole cell lysate was incubated with Urea (6M) and Dithiothreitol (200mM) together for 1hr at room temperature for denaturation and reduction of proteins respectively. Thereafter alkylation was carried out using iodoacetamide (IAA) (200mM) for 1hr in the dark. The modified protein lysate was subjected to in-solution digestion, wherein 10μg protein was digested with proteomic grade trypsin (Sigma Aldrich, MO, USA cat. no. T6567); trypsin: protein (1:50, w/w) and incubated for 16hr at 37 °C. The peptides generated after tryptic digestion of proteins were dried in speed vac, reconstituted in 0.1% formic acid (FA) in water and desalted using C18 spin columns (Pierce- Thermo Fisher Scientific, MA, USA cat. no. 84850). Further, the desalted peptides were dried and reconstituted in 0.1% FA in water to attain a final concentration of 0.5μg/μl.
LC Separation
The peptides obtained from digestion of 2 micro gram protein were injected into Eksigent ekspertTM nano-LC 400 with cHiPLC® system comprising of trap column (200μm x 0.5mm) and analytical column (75μm x 15cm), both of which were packed with 3μl ChromXp C18 (120 Å). The mobile phase solvents A and B for reverse phase high performance LC consisted of 0.1% FA in water and 0.1% FA in acetonitrile respectively. Biological replicates of K562 cells lysed in each of the two lysis buffers were subjected to three LC-MS/MS runs wherein a distinct elution gradient was used in each of the three runs, as shown in Table 1 with a flow rate of 300nl/min. Three technical replicates of each lysate were run for each gradient. Details of the three gradients are given in Table 1 and Figure 1, Gradient A had a total duration of 240min. Concentration of solvent A in mobile phase was decreased from 85% to 50%, with 10% drop in concentration over 40min. Further drop from 50% to 5% was with 10% drop in concentration over 20 min. In gradient B, with a duration of 225min, the drop in concentration of solvent A from 90% to 70% was in 70min and thereafter to 50% in 20min. After the solvent A concentration reached 50%, the gradient composition and duration was same as gradient A. Gradient C, was identical to gradient B till the concentration of solvent A reached 50%, but unlike B, the concentration dropped from 50% to 20% in 1min and was maintained at 20% for 20min. It was, then increased to 95% in 1min and was maintained for 20min.
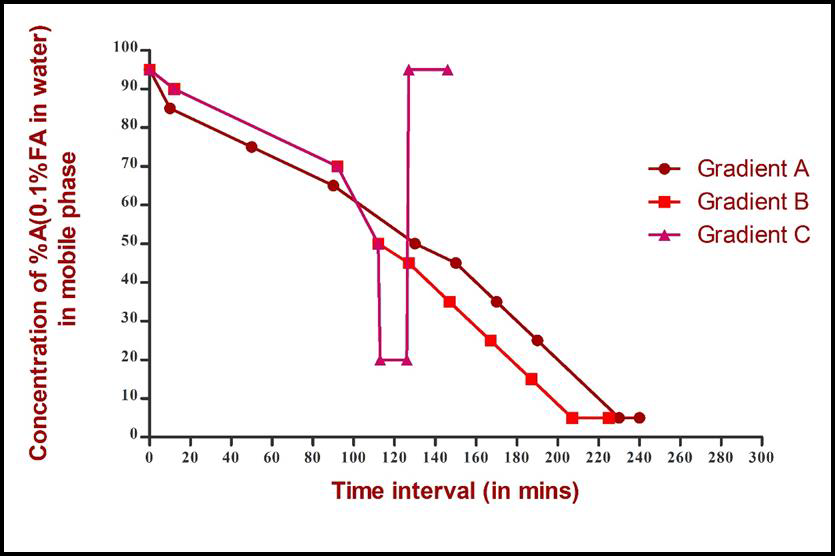
Figure 1: Composition of LC gradients: concentration of solvent A in mobile phase is decreased stepwise in Gradient A.
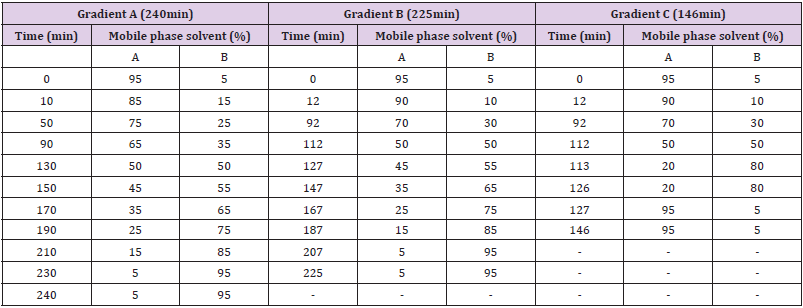
Table 1: Detailed parameters of the three LC gradients used in this study.
Acquisition and Analysis of MS/MS Data
The eluate from the column was analysed in the online MS (Triple TOF 5600+, Sciex, USA) operated in a positive ion mode. Mass spectra were obtained in IDA mode with a survey scan over a mass range of 350 – 1250 m/z and MS/MS scan over 200 – 1800 m/z for top 30 precursor ions with rolling collision energy, 50mDa mass tolerance and accumulation time of 250 ms for MS and about 50 ms for MS/MS [27]. MS and MS-MS spectra were analyzed to obtain the protein identities. Protein pilot 4.5 software (Sciex, USA) was used for protein identification with the following parameters: Sample type – complex mixture, cysteine alkylation – IAA, digestion – trypsin, species – Homo sapiens. The search effort was set to ‘thorough ID’, and false discovery rate (FDR) analysis was enabled. The search was carried out with reference to Uniprot database containing reviewed human protein identities. Proteins detected with 1% FDR were included in further analyses. Proteins identified from the biological replicates of lysates from the same lysis buffer and fractionated using the same LC gradient were pooled together. Venn diagram of proteins identified from different gradients within each lysate type was constructed using the program InteractiVenn [28] to identify the protein commonly as well as uniquely identified by the gradients. Hydrophobicity of uniquely identified proteins was determined using the hydrophobicity assessment tool provided by Peptide 2.0 inc.
Statistical Analysis
Statistical analyses were performed using IBM-SPSS statistics software 21. A p-value < 0.05 was considered to be statistically significant. Graphs were plotted using Graphpad Prism 8 software.
Results and Discussion
A practical solution may not be universally applicable but is ideal for a given condition. In spite of availability of methods which specifically improve identification of hydrophobic proteins by LCMS, their application in global proteome profiling of scanty clinical samples is impractical, due to unavailability of sample for separate processing. This study was undertaken to achieve practically possible improvement in detection of hydrophobic proteins from complex biological sample in a single LC-MS run. Lysates of K562 cells prepared in SDS and Triton buffers, were subjected to LC-MS analysis. Three technical replicates of each lysate were run on three distinct gradients each before their identification by on-line MS. The gradient for separation of a mixture of proteins with diverse chemistries, like biological samples, have a biphasic composition. In the initial phase the concentration of polar solvent (A) in the mobile phase is high which is conducive to the elution of hydrophilic peptides. As the concentration of non-polar solvent (B) begins to rise in the mobile phase, the hydrophobic peptides start to elute. Gradients in this study differed in their slopes either in the initial phase or later phase of the LC run. From the details of gradient given in Table 1 and Figure 1, it is seen that the slope of gradient A is shallow throughout its 240 min run, which would give a gradual elution of peptides. The gradual and continuous elution can leave a trail of hydrophilic peptides eluted just before the rise of solvent B concentration in mobile phase. This may interference with the MS detection of hydrophobic peptides, which would begin to elute.
Gradient B, too, is shallow like gradient A throughout its 225min run, except between the region where solvent A concentration in mobile phase decreases from 70% to 50%. This would cause a sharp elution of hydrophilic peptides with minimum trailing effect. This would minimize their interference with detection of hydrophobic peptides which elute as the concentration of solvent B in the mobile phase begins to rise. Gradient C is identical to gradient B till the solvent A concentration reaches 50% and therefore would also have reduced interference of hydrophilic peptides. Thereafter, gradient C becomes excessively steep, probably causing efficient and sharp elution of hydrophobic peptides. This may lead to concentration of hydrophobic peptides before their entry in MS thereby may improve their detection. The data supports this anticipation.
Since shotgun proteomics employing IDA approach can detect only 60-70% overlap in protein identities among the replicate runs of a sample [29] due to stochastic selection of peptides for fragmentation, we improved proteome coverage by pooling the identities obtained in replicates as suggested by Domon, et al. [23]. Identities obtained in individual LC-MS runs are available via ProteomeXchange (PXD028896). Within each lysate type, protein identities of biological replicates separated using a particular gradient were pooled. The identities of proteins obtained for lysates made in one buffer separated on three gradients were assessed for their overlap by Venn diagram (Figures 2A & 2B), which detected proteins that are common among gradients, as well as the presence of proteins unique to each gradient. The total number of proteins as well as proteins uniquely identified in these gradients (Tables 2 & 3) highlighted the effects of different lysis buffers and different gradients. As seen in Figure 3, stretching of hydrophobic region in gradient B as well as a steep hydrophobic gradient in C yielded maximum number of proteins upon pooling, in triton as well as SDS lysates (Figure 3A). Further, increased percentage of unique proteins was also observed in gradients C and B (Figure 3B). The increase in total number of proteins coincided with increase in the unique proteins identified, which is observed in both SDS based lysates and Triton based lysates. The unique proteins from all gradients were further assessed for their content of hydrophobic amino acids. They were grouped into four subgroups (Tables 2 & 3) based on their percent hydrophobicity (based on the amino acid composition) as quantified using the hydrophobicity assessment tool provided by Peptide 2.0 inc.
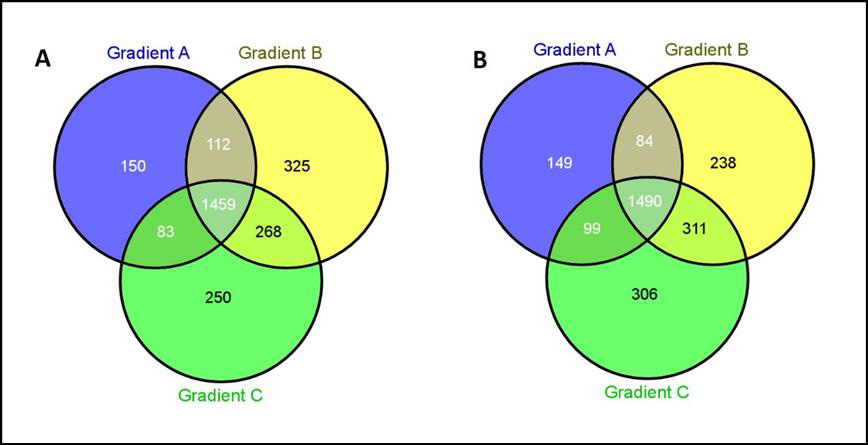
Figure 2: Venn diagram to identify proteins unique to each gradient obtained from
A. Triton lysate
B. SDS lysate.
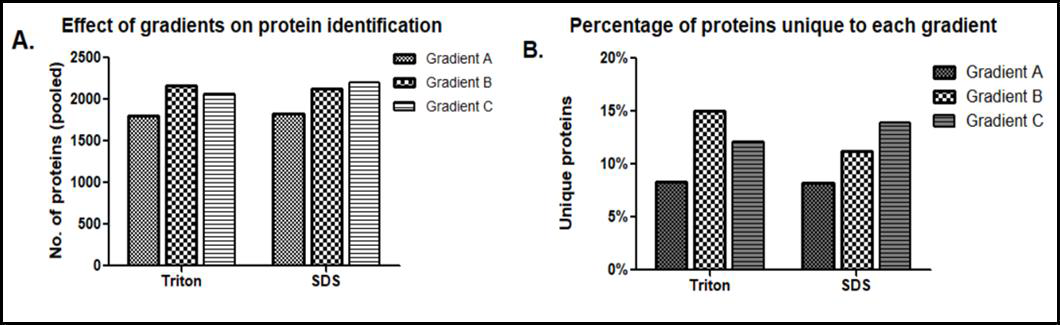
Figure 3:
A. Comparison among different gradients for pooled proteins identified from SDS-based and triton-based lysates.
B. Comparison of percentage of unique proteins identified from SDS and triton-based buffers.
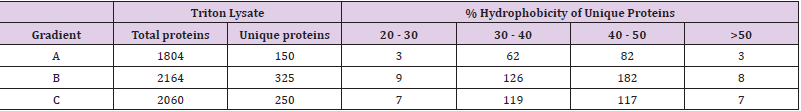
Table 2: Hydrophobicity-based distribution of proteins from Triton lysates.
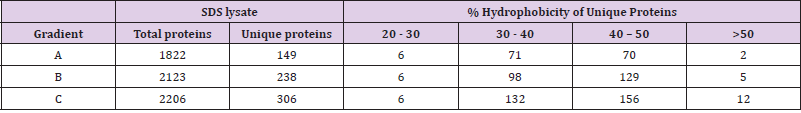
Table 3: Hydrophobicity-based distribution of proteins from SDS lysates.
Proteins with <30% hydrophobicity were considered less hydrophobic, those with hydrophobicity between 30% and 50% as intermediate, and those with >50% hydrophobicity as highly hydrophobic. Higher number of intermediate to highly hydrophobic proteins were detected in gradients B and C. The total calculated hydrophobicity would reflect in the number of hydrophobic peptides generated from each of these proteins and, in turn, the detectability of the protein. Electronic supplementary information Table 1 (ST1) and Table 2 (ST2) shows that unique proteins with >50% hydrophobicity across gradients were identified due to detection of either a single or two peptides in MS. These peptides have a hydrophobicity score of >45-50%, thereby establishing that detection of hydrophobic peptides mediated identification of these unique proteins in MS. It is apparent from the distribution of hydrophobic proteins in each gradient for Triton and SDS lysates that gradients B and C have not only yielded higher number of proteins but also their unique proteins included a higher number of intermediate and highly hydrophobic proteins as compared to gradient A. It can be thus inferred that the detection of hydrophobic peptides improves when the LC gradient is partially or completely steep, more so in the later phase. This improvement in detection is observed in both, SDS based lysates and Triton based lysates, thus implying that the type of lysis buffer did not impact the efficiency of hydrophobic protein detection. There is a simultaneous improvement in the detection of total identified proteins.
Conclusion
The study has thus identified LC conditions which are conducive to the detection of hydrophobic peptides. Since the gradient variation is carried out within the LC-MS run, it is suitable for analysis of clinical samples which are not available for additional processing. The proposed strategy for improved detection of hydrophobic peptides is a practical approach for global profiling of scarcely available biological samples by LC-MS. The strategy is open for validation in diverse clinical samples so as to have wide application in the field of biomarker discovery and identification of therapeutic targets.
Acknowledgement
We acknowledge the help and contribution of Mr. Shashi Dolas and Mrs. Savita Prabhu- Chavan from the Mass Spectrometry facility, ACTREC, and of Ms. Pranali Panchal from Rukmini Lab, ACTREC. We thank Dr. Aparna Bagwe for substantive editing of the manuscript. This project was funded from annual operational expenditure of ACTREC.
Declarations
Funding
This research did not receive any specific grant from funding agencies in the public, commercial, or not-for-profit sectors.
Competing Interests
The authors declare no competing financial interests.
Availability of Data and Material
The datasets generated and/or analysed during the current study are available via ProteomeXchange with identifier PXD028896.
References
- Diamandis EP (2004) Mass spectrometry as a diagnostic and a cancer biomarker discovery tool: opportunities and potential limitations. Mol Cell Proteomics 3(4): 367-378.
- Ralhan R, Leroi V Desouza, Ajay Matta, Satyendra Chandra Tripathi, Shaun Ghanny, et al. (2008) Discovery and verification of head-and-neck cancer biomarkers by differential protein expression analysis using iTRAQ labeling, multidimensional liquid chromatography, and tandem mass spectrometry. Mol Cell Proteomics 7(6): 1162-1173.
- Gates LA, Guowei Gu, Yue Chen, Aarti D Rohira, Jonathan T Lei, et al. (2018) Proteomic profiling identifies key coactivators utilized by mutant ERα proteins as potential new therapeutic targets. Oncogene 37(33): 4581-4598.
- Kuhlmann L, Emma Cummins, Ismael Samudio, Thomas Kislinger (2018) Cell-surface proteomics for the identification of novel therapeutic targets in cancer. Expert review of proteomics 15(3): 259-275.
- Cournia Z, Toby W Allen, Ioan Andricioaei, Bruno Antonny, Daniel Baum, et al. (2015) Membrane Protein Structure, Function, and Dynamics: a Perspective from Experiments and Theory. J Membr Biol 248(4): 611-640.
- Matthews H, J Hanison, N Nirmalan (2016) “Omics”-informed drug and biomarker discovery: opportunities, challenges and future perspectives. Proteomes 4(3): 28.
- Gillet LC, Nathalie Selevsek, Lukas Reiter, Ron Bonner, Ruedi Aebersold, et al. (2012) Targeted data extraction of the MS/MS spectra generated by data-independent acquisition: a new concept for consistent and accurate proteome analysis. Mol Cell Proteomic 11(6): O111.016717.
- Lhor M, Sarah C Bernier, Habib Horchani, Sylvain Bussières, Line Cantin, et al. (2014) Comparison between the behavior of different hydrophobic peptides allowing membrane anchoring of proteins. Adv Colloid Interface Sci 207: 223-239.
- Tomita M, V T Marchesi (1975) Amino-acid sequence and oligosaccharide attachment sites of human erythrocyte glycophorin. Proc Natl Acad Sci U S A 72(8): 2964-2968.
- Von Heijne G, C Manoil (1990) Membrane proteins: from sequence to structure. Protein Engineering, Design and Selection 4(2): 109-112.
- Seddon AM, P Curnow, PJ Booth (2004) Membrane proteins, lipids and detergents: not just a soap opera. Biochim Biophys Acta 1666(1-2): 105-117.
- Wysocki VH, Katheryn A Resing, Qingfen Zhang, Guilong Cheng (2005) Mass spectrometry of peptides and proteins. Methods 35(3): 211-222.
- Ernoult E, E Gamelin, C Guette (2008) Improved proteome coverage by using iTRAQ labelling and peptide OFFGEL fractionation. Proteome Science 6(1): 27.
- Atanassov I, H Urlaub (2013) Increased proteome coverage by combining PAGE and peptide isoelectric focusing: comparative study of gel-based separation approaches. Proteomics 13(20): 2947-2955.
- Vollmer M, P Hörth, E Nägele (2004) Optimization of Two-Dimensional Off-Line LC/MS Separations To Improve Resolution of Complex Proteomic Samples. Analytical Chemistry 76(17): 5180-5185.
- Weston LA, KM Bauer, AB Hummon (2013) Comparison of bottom-up proteomic approaches for LC-MS analysis of complex proteomes. Analytical methods: advancing methods and applications 5(18): 10.
- Gokce E, Genna L Andrews, Ralph A Dean, David C Muddiman (2011) Increasing proteome coverage with offline RP HPLC coupled to online RP nanoLC–MS. Journal of Chromatography B 879(9-10): 610-614.
- Josic D (2014) Strategies for Complete Proteomic Analysis of Hydrophobic Proteins in Complex Biological Samples–Hyde-and Seek. Journal of Data Mining in Genomics & Proteomics 05: 1.
- Zhang Y, Dario Bottinelli, Frédérique Lisacek, Jeremy Luban, Caterina Strambio-De-Castillia, et al. (2015) Optimization of human dendritic cell sample preparation for mass spectrometry-based proteomic studies. Analytical biochemistry 484: 40-50.
- Bagag A, Jean-Michel Jault, Nazha Sidahmed-Adrar, Matthieu Réfrégiers, Alexandre Giuliani et al. (2013) Characterization of hydrophobic peptides in the presence of detergent by photoionization mass spectrometry. PLoS One 8(11): e79033.
- Eichacker LA, Oliver Mirus, Bernd Christian Müller, Christian Miess, Enrico Schleiff, et al. (2004) Hiding behind hydrophobicity. Transmembrane segments in mass spectrometry. J Biol Chem 279(49): 50915-50922.
- Köcher T, Peter Pichler, Remco Swart, Karl Mechtler (2012) Analysis of protein mixtures from whole-cell extracts by single-run nanoLC-MS/MS using ultralong gradients. Nature protocols 7(5): 882-890.
- Domon B, R Aebersold (2010) Options and considerations when selecting a quantitative proteomics strategy. Nat Biotechnol 28(7): 710-721.
- Wang H, Yanling Yang, Yuxin Li, Bing Bai, Xusheng Wang, et al. (2015) Systematic optimization of long gradient chromatography mass spectrometry for deep analysis of brain proteome. J Proteome Res 14(2): 829-838.
- Thakur SS, Tamar Geiger, Bhaswati Chatterjee, Peter Bandilla, Florian Fröhlich, et al. (2011) Deep and highly sensitive proteome coverage by LC-MS/MS without prefractionation. Mol Cell Proteomics 10(8): M110.003699.
- Motoyama A, John D Venable, Cristian I Ruse, John R Yates (2006) Automated Ultra-High-Pressure Multidimensional Protein Identification Technology (UHP-MudPIT) for Improved Peptide Identification of Proteomic Samples. Analytical Chemistry 78(14): 5109-5118.
- Narasimhan M, Sadhana Kannan, Aakash Chawade, Atanu Bhattacharjee, Rukmini Govekar (2019) Clinical biomarker discovery by SWATH-MS based label-free quantitative proteomics: impact of criteria for identification of differentiators and data normalization method. J Transl Med 17(1): 184.
- Heberle H, Gabriela Vaz Meirelles, Felipe R da Silva, Guilherme P Telles, Rosane Minghim (2015) InteractiVenn: a web-based tool for the analysis of sets through Venn diagrams. BMC Bioinformatics 16(1): 169.
- Tabb DL, Lorenzo Vega Montoto, Paul A Rudnick, Asokan Mulayath Variyath, Amy Joan L Ham, et al. (2010) Repeatability and reproducibility in proteomic identifications by liquid chromatography-tandem mass spectrometry. J Proteome Res 9(2): 761-776.
