 Research Article
ABSTRACT
Objective: To evaluate maximum inspiratory pressure (MIP) in women with obesity using a manometer (FIMm) and the RT2® device (MIPRT) and compare the findings with equations for predicted values.
Methods: A cross-sectional study was conducted with 103 women between 18 and 65 years of age with a body mass index (BMI) between 30 and 60 kg/m2. Spirometric values (FVC, FEV1 and FVC/FEV1), MIPM and MIPRT were determined.
Results: The MIPM was higher than the MIPRT (98 ± 24.3 cm H2O and 74.2 ± 29 cm H2O, respectively) and both values were lower than the values predicted for individuals in the ideal weight range. Moreover, negative correlations with BMI were found.
Conclusion: These results demonstrate that the women with obesity had weaker inspiratory muscle strength compared to values predicted for individuals in the ideal weight range, differences are found when MIP is measured using different equipment and the BMI exerts an influence.
Keywords: Obesity; Respiratory Muscle; Muscle Strength; Reference Values; Maximum Inspiratory Pressure
Abbreviations: MIP: Maximum Inspiratory Pressure; BMI: Body Mass Index; FVC: Forced Vital Capacity; ANOVA: Analysis of Variance
Introduction
Obesity is a disease characterized by the excessive accumulation of body fat [1] and has become a worldwide public health problem [2-4]. An imbalance favoring calorie intake over expenditure leads to an increase in adipose tissue, which plays a key role in the development of complications in diverse body systems [5,6], including the respiratory system [7]. According to Magnani and Cataneo [7], obese individuals have respiratory muscle dysfunction due to the changes that occur in the lungs, thoracic wall and diaphragm, which alter the respiratory mechanics and exert a negative impact on the gas exchange. These changes are believed to overload the respiratory muscles, increasing the mechanical work involved in respiration [6-11]. The evaluation of respiratory muscle strength, which is measured by maximum expiratory and inspiratory pressures, has been used since the 1960s [12] due to its important diagnostic role in lung conditions, such as chronic obstructive pulmonary disease [13]. However, there is a lack of information on respiratory muscle strength in individuals with obesity, as no consensus is found on predictive values for this population or whether there is an association between respiratory muscle strength and the body mass index (BMI) [6-9].
Researchers have proposed equations for reference values for measures of respiratory muscle strength in individuals in the ideal weight range taking into consideration sex and age [14-21]. However, few studies have been conducted with obese individuals. Evaluating maximum inspiratory pressure (MIP) in obese women, Pazzianotto-Fort, et al. [22] compared different predictive equations and found three different values for the same individuals. This demonstrates that respiratory muscle strength is not only correlated with age and sex, but also weight, height and body surface, which underscores the need for studies on predictive equations, particularly for the MIP, involving individuals with obesity [19,20]. Independently of the population being studied, respiratory muscle strength has been investigated with the use of different equipment and methods. An analog manometer is the most widely known and used. This equipment constitutes a closed system in which vacuum pressure is measured on a scale in cmH2O [12-15]. Since the 1990s, however, the RT2® device (DeVilbiss Healthcare Ltd.) has been employed for the measurement of respiratory muscle strength as well as for respiratory muscle training, used mainly on athletes [16-18]. The RT2® device was first used in Brazil by Bien, et al. [17] on a sample of individuals in the ideal weight range with the aim of developing predictive equations for MIP for the Brazilian population. Considering the different equipment and methods and the fact that predictive MIP values are only found for individuals in the ideal weight range [14,17,19-21], the aim of the present study was to determine MIP in women with obesity using a manometer (MIPM) and the RT2 device (MIPRT) to contribute to clarifying MIP in this population.
Methods
Sample and Ethical Aspects
A cross-sectional study was conducted involving 103 women with obesity recruited from the community surrounding University Nove de Julho (São Paulo, Brazil). All volunteers received clarifications regarding the objectives and procedures of the study and agreed to participate by signing a statement of informed consent. This study received approval from the human research ethics committee of the university (certificate number: 2.560.684). The evaluations were performed at the Respiratory Functional Assessment Laboratory of the university between August 2017 and September 2018. The inclusion criteria were women aged 18 to 65 years with obesity (BMI ≥ 30 kg/m2). The exclusion criteria were infectious or inflammatory disease, respiratory infection in the previous two weeks, kidney disease, liver disease, uncontrolled arterial hypertension or diabetes, obstructive or restrictive lung condition detected by spirometry, physical limitations that would impede the execution of the tests and not signing the statement of informed consent.
Experimental Procedures
The evaluations were performed in a single session. After taking the patient histories, the anthropometric measures were determined with the volunteers standing barefoot and wearing light clothing. Weight was determined using a calibrated precision scale (Tanita®) with a maximum capacity of 180 kg and accuracy of 100 g. Height was measured using a stadiometer with an accuracy of 1 mm. The BMI was calculated as weight in kg divided by height in meters squared (kg/m2). For the exclusion of obstructive or restrictive lung conditions, forced vital capacity (FVC), forced expiratory volume in the first second (FEV1) and the FEV1/FVC ratio ≤ 80% of predicted [23] were determined using a computerized ultrasound spirometer with a flow sensor (Easy-One NDD® Medizintechnik, Switzerland), following the recommendations of the American Thoracic Society [23] and guidelines for lung function tests [24]. The values were expressed in liters and percentage of predicted values based on the reference values proposed by Knudson [25].
MIP was determined using a manometer (MIPM) and the RT2 device (MIPRT). The manometer was the Critical Med® device (USA, 2002) with an operational range of 0 to ± 300 cmH2O, duly equipped with an rigid plastic mouthpiece with a small orifice (internal diameter: 2 mm) serving as the relief valve to prevent the increase in pressure in the oral cavity generated exclusively by the contraction of the facial muscles with the closure of the glottis. MIPM was measured beginning with residual volume. The volunteer remained seated with feet on the floor wearing a nose clip. A minimum of three and maximum of five trials were performed, with a one-minute interval between trials. Those sustained for at least one second and with a difference of less than 10% compared to the immediately inferior result were considered technically acceptable and reproducible [12]. MIPRT was determined using the RT2® device (DeVilbiss Healthcare Ltd.) connected to a laptop or desk computer. The volunteer inhaled as deeply and fully as possible through an appropriate mouthpiece for the determination of MIPRT in cmH2O. Following the recommendations of the manufacturer, three to five trials were performed with a one-minute rest between trials to obtain accurate MIPRT values [16]. The largest value was used for the analysis. Both the MIPM, and MIPRT were compared to the values predicted using the equations proposed by Neder, et al. [14,17,19-21] and which are shown in the chart below.
Statistical Analysis
The sample size was calculated based on the findings of a crosssectional study [20]. Using a correlation coefficient considering weight (kg) and BMI correlated with MIP, with a respective effect size of r = 0.33 and 0.34, two-tailed α = 0.05 and 80% power [26] the minimum sample size was determined to be 85 participants.
The Shapiro-Wilk test was used to determine the normality of the data, which were expressed as mean and standard deviation values. The unpaired Student’s t-test was used for the comparison of the obtained MIP values to those predicted by the different equations. One-way analysis of variance (ANOVA) with Tukey’s post hoc test was used for the comparison of the different BMI categories and predicted MIP values. Pearson’s correlation coefficients (r2) were calculated and linear regression analysis was performed to identify the degree of interference of the BMI on MIP. The IBM® SPSS® Statistics 22 (SPSS, Chicago, Illinois, USA) was used for the statistical analysis, with the level of significance set to 5% (p < 0.05).
Results
Participants
Among the 107 women recruited, four were unable to complete the tests. Thus, the final sample was composed of 103 women with obesity. Figure 1 displays the flowchart of the study.
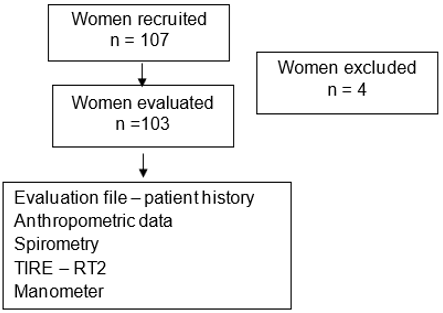
Figure 1: Flow chart.
Clinical Findings
Table 1 displays the anthropometric characteristics, age and spirometric values of the sample. There were no restrictive or obstructive lung findings indicative of abnormalities of the airways. Mean age was 32 ± 10.3 years (range: 19 to 65 years), mean BMI was 38.2 ± 5.6, distributed among the three grades of obesity. The spirometric findings revealed an absence of restrictive abnormalities of the thoracic cage and airways. Table 2 displays the mean FMI values obtained with the two methods employed in the present study and comparisons to the results of the equations proposed by other researchers. All values obtained with MIPM and MIPRT were lower than the predicted values for individuals in the ideal weight range. The exceptions were MIPC, which was lower than both MIPM and MIPRT, and MIPN, which was lower than MIPM. Table 2 also shows that MIPHK overestimates the predicted values for these women with obesity and differences are found among the values predicted by the equations for the same individuals. Considering the difference in the FMI of these women with obesity found when using different equipment (MIPM and MIPN) and the possible influence of body mass, FMI was compared considering the different grades of obesity (BMI 1, BMI 2 and BMI 3), as shown in Table 3.
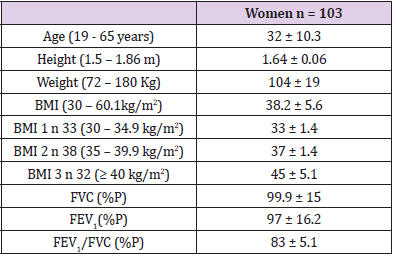
Table 1: Anthropometric characteristics, age and spirometric characteristics of sample.
Note: BMI = body mass index (kg/m2), BMI 1 = grade 1 obesity, BMI 2 = grade 2 obesity, BMI 3 = grade 3 obesity, FVC% (%P) = forced vital capacity in percentage of predicted, FEV1% (%P) = forced expiratory volume in first second in percentage of predicted, FEV1/FVC% (%P) = FEV1/FVC% ratio in percentage of predicted, data expressed as mean ± standard deviation.
Independently of the grade of obesity, the MIPRT remained only 70 to 80% of the MIP determined by the manometer. According to the data displayed in Table 2, significant differences are found among the values predicted by the different equations for the same obese women. According to the data displayed in Table 3 significant differences are found between the MIPM and MIPRT among the different degrees of obesity for the same obese women. Therefore, a correlation analysis was performed between the different MIP predictive equations and different grades of obesity (Table 4). The findings displayed in Table 4 demonstrate that the MIPHK and MIPSP equations are significantly negatively correlated with BMI, whereas the correlations with the other equations were nonsignificant. Respectively show the correlations with the MIPHK and MIPSP, especially for BMI 2 and 3, with the strongest correlation found for BMI 3. A linear regression analysis was performed to gain a better understanding of the correlations between BMI and both the MIPSP and MIPHK predicted values (Table 5).
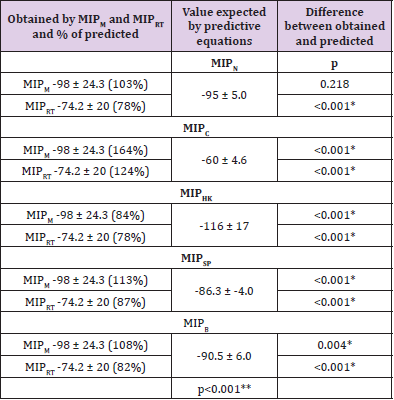
Table 2: Comparison of MIPM, MIPRT and values predicted using different equations.
Note: MIPM = maximum inpiratory pressure in cmH2O obtained by manometer; MIPRT = maximum inpiratory pressure in cmH2O obtained by RT2; MIPN = maximum inspiratory pressure in cmH2O predicted by Neder equation; MIPC = maximum inspiratory pressure in cmH2O predicted by Costa equation; MIPHK = maximum inspiratory pressure in cmH2O predicted by Harik-Khan equation; MIPSP = maximum inspiratory pressure in cmH2O predicted by Sgaribold & Pazzianotto-Forti equation; MIPB = maximum inspiratory pressure in cmH2O predicted by Bien equation; p = result of unpaired t-test with significance p < 0.05* and one-way ANOVA + Tukey’s test with significance p < 0.05**.
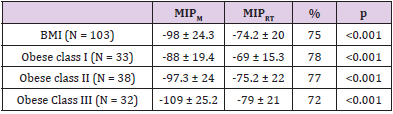
Table 3: Comparison of MIPM and MIPRT among different grades of obesity.
Note: MIPM= maximum inspiratory pressure in cmH2O obtained by manometer; MIPRT= maximum inspiratory pressure in cmH2O obtained by RT2; BMI= body mass index, p= result of unpaired t-test with significance p < 0.05.
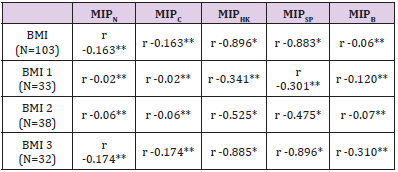
Table 4: Correlation between grades of obesity and equations for predicted values in the literature.
Note: BMI = body mass index (kg/m2), BMI 1 = grade 1 obesity, BMI 2 = grade 2 obesity, BMI 3 = grade 3 obesity, MIPN = maximum inspiratory pressure in cmH2O predicted by Neder et al., MIPC = maximum inspiratory pressure in cmH2 predicted by Costa et al., MIPHK = maximum inspiratory pressure in cmH2O predicted by Harik-Khan, Wise & Fozard, MIPSP = maximum inspiratory pressure in cmH2O predicted by Sgaribold & Pazzianotto-Forti, MIPB = maximum inspiratory pressure in cmH2O predicted by Bien et al., Pearson’s correlation with significance p < 0.05*; Pearson’s correlation with p > 0.05**.
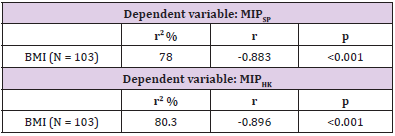
Table 5: Regression analysis considering MIPHK and MIPSP as dependent variables in relation to BMI.
Note: MIPHK = maximum inspiratory pressure in cmH2O predicted by Harik-Khan et al., MIPSP = maximum inspiratory pressure in cmH2O predicted by Sgaribold & Pazzianotto-Forti, linear regression analysis with significance p < 0.05.
In this analysis, strong significant correlations were found between BMI and the two equations, explaining 80.3% of the variation in MIP with the HK equation and 78% of the variation in MIP with the SP equation. Due to the significant difference between MIPM and MIPRT as well as the non-significant correlation between MIPB and the grades of obesity, the fact that the mean values predicted by MIPB were higher than those obtained for these women and the fact that the RT2 is a relatively new device that has been studied little in this population, the aim of the following analysis was to demonstrate the confidence intervals of the mean values obtained by the RT2 in obese women. Table 6 shows that the mean MIPRT values were lower than those predicted by the MIPB equation for the women with obesityin all categories of obesity, but the value was within the 95% confidence interval.
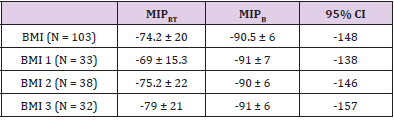
Table 6: Confidence intervals of means obtained by MIPRT according to grade of obesity.
Note: BMI = body mass index, BMI 1 = grade 1 obesity, BMI 2 = grade 2 obesity, BMI 3 = grade 3 obesity, MIPB = maximum inspiratory pressure in cmH2O predicted by Bien et al., MIPRT= maximum inspiratory pressure in cmH2O obtained by RT2, CI = confidence interval.
Discussion
Comparing the MIP values found for the women with obesity in the present study to those determined using different predictive equations for individuals in the ideal weight range, different values are found, with the predictive values either overestimating or underestimating MIP for these women. This demonstrates the lack of applicability of these equations for the population with obesity and underscores the need for new equations or adjustments to existing equations for this population. Contradictory findings are described in the literature with regard to respiratory muscle strength in individuals with obesity. Abdalla, et al. [13] found that MIP values were, on average, 21% higher among women with obesity in comparison to non-obese women. Campos et al. [6] found that MIP values were higher (102%) among women with grade 3 obesity in the preoperative period prior to bariatric surgery compared to values predicted for individuals in the ideal weight range. In contrast, Sant Anna Jr, et al. [27] found a 30 to 40% reduction in MIP in obese individuals compared to those in the ideal weight range and Sood, et al. [28] found MIP at 60% of the value predicted for individuals in the ideal weight range. These divergences may be due to the small number of studies and lack of a consensus on this subject as well as the fact that most predictive equations were proposed for non-obese individuals. Thus, there is a need for further studies involving individuals with obesity and a large sample size to ensure the adequate reproducibility of predictive equations for this population.
The differences in FMI found in individuals with obesity may be due to certain limitations in the ventilatory mechanics. Greater activity of the diaphragm is required for these individuals to produce adequate ventilatory work [29], since the excessive deposit of fat in the thoracic and abdominal cavities, elevates the diaphragm domes, causing an increase in final positive expiratory pressure due to the closure of small airways at the base of the lungs, leading to an increase in ventilatory work and a respiratory muscle disadvantage [30]. The present findings indicate that the deposition of body fat exerts an influence on MIP independently of the degree of obesity, as demonstrated by the results obtained with both the manometer and the RT2 device. While Magnani and Cataneo [7] found MIP values for individuals with grade 3 obesity within the values predicted using the equations proposed by Neder, et al. [14]. Castello, et al. [31] found lower MIP values in women with grade 3 obesity than the values expected using the same equations. Evaluating three equations for predictive values [Neder, et al. [14,21,19,22]] found three different values, although the equation proposed by Harik-Khan, et al. [19] proved to be the most appropriate for this population.
The present findings demonstrate that the anthropometric characteristics of individuals with obesity, especially grade 3 obesity, exert a direct influence on MIP, which is in agreement with data described by Harik-Khan, et al. [19] as respiratory muscle strength is associated with sex, age, weight, height and body surface. It should also be pointed out that among all the equations found in the literature, only those proposed by Harik-Khan, et al. [19,20] take body surface into account. The present findings demonstrate that women with obesity have a lower FMI in comparison to values predicted for individuals in the ideal weight range, with the MIPM lower than that predicted using the equation proposed by Harik- Khan, et al. [19]. Moreover, this difference was accentuated when FMI was measured using the RT2 device (MIPRT). The MIPRT of the women with obesity in the present study was also significantly lower than that predicted using the equation proposed by Bien, et al. [17], which was also developed to predict values in individuals in the ideal weight range using the RT2 device. This underscores the fact that body surface exerts an influence on FMI measures.
The values obtained using the manometer (MIPM) were, on average, 30% higher than those obtained using the RT2 device (MIPRT), which may be related to the different functioning mechanisms of these two devices. The analog manometer furnishes a value using a closed system in which a vacuum is generated, which requires a greater peak for its execution [12-15]. In contrast, the RT2 requires the individual to sustain inspiration for a few seconds more to obtain the FMI and is characterized as an open system with inspiratory flow resistive loading, requiring a lower mean peak of strength to generate pressure [16,18]. These are important aspects to consider for the establishment of possible predictive equations.
Limitations of the Study
The main limitation was the fact the sample was limited to women due to the small number of men available for participation. Another limitation was the lack of electrical bioimpediance analysis, which would have provided the respective percentages of fat mass, lean mass and water, as these elements may exert an influence on MIP in individuals with obesity.
Clinical Relevance
Equations for predicting MIP in individuals with obesity should take body mass into account. Considering the influence of obesity on the physical health of these individuals, this change in the prediction equation will allow more accurate results in the determination of inspiratory muscle strength and, consequently, a better based therapeutic approach, especially in terms of physical training and / or physical and functional rehabilitation for this population.
Conclusion
The women with obesity analyzed presented lower inspiratory muscle strength when compared to the predictive values using equations developed for individuals in the ideal weight range with the values obtained by the two methods employed in this study. In addition, the degree of obesity affected inspiratory muscle strength and the MIP value determined by the pressure gauge was higher than that determined by the RT2 device.
What is Already Known about the Subject?
There are differences in inspiratory muscle strengths in women with obesity compared with ideal weight. Adipose tissue influences these muscle forces. Existence of different predictive value equations for inspiratory muscle strength for ideal weight subjects.
What Does Your Study Add?
Need to develop a predictive equation for inspiratory muscle strength values for individuals with obesity. Take into consideration the weight and degree of obesity in developing such equations. Consider the device used to obtain inspiratory muscle strength data in women with obesity.
Acknowledgment
We would like to thank the study participants and the Research Director at Nove de Julho University. We also thank PHD Lawrence P. Cahalin (University of Miami Miller School of Medicine) for the grant the RT2 device (DeVilbiss Healthcare, Wollaston, UK) for MIP measurements. The data set used and / or analyzed during the current study are available from the corresponding author upon reasonable request.
Conflicts of Interest
The authors declare no conflicts of interest.
Authors Contributions
Involvement in the conception, hypothesis delineation, and design of the study: VCA and DC. Data acquisition: VCA; MCA and Bien UB. Data analysis and interpretation: VCA; ELFDG and MCBM. Writing the article: VCA; DC and LMMS. Involvement in its revision prior to submission: RPB-V
Financial Support
None.
ORCID
Viviane Cristina Alves: 0000-0002-4973-3219
Évelim Leal de Freitas Dantas Gomes: 0000-0002-0636-6041
Renata P Basso-Vanelli: 0000-0001-6523-6354
Umilson dos Santos Bien: 0000-0002-9205-4166
Marcela Cangussu Barbalho-Moulim: 0000-0001-5154-2457
Manoella Cavalcante de Andrade: 0000-0003-4715-0770
Luciana Maria Malosá Sampaio: 0000-0002-0110-7710
Dirceu Costa: 0000-0002-0334-3899
References
- Gregg EW, Cheng YJ, Cadw El BL, Imperatore G, Willians DE, et al. (2005) Secular trends in cardiovascular disease risk factors according to body mass index in us adults. JAMA 293(15): 1868-1874.
- (2017) World Health Organization (WHO). Obesity and overweight.
- Requist K (1997) Obesity classification. Obes Surg 7(6): 523.
- Marcelino LF, Patricio ZM (2011) The complexity of obesity and life after bariatric surgery: a public health issue. Cien Saúde Colet 16(1): 4767-4776.
- Mraz M, Haluzik M (2014) The role of adipose tissue immune cells in obesity and low-grade inflammation. J Endocrinol 222(3): 113-127.
- Campos EC, Peixoto-Souza FS, Alves VC, Vanelli RB, Moulim MB, et al. (2018) Improvement in lung function and functional capacity im morbidly obese women subjected to bariatric surgery. Clinics 73: e20.
- Magnani KL, Cataneo AJM (2007) Respiratory muscle strength in obese individuals and influence of upper-body fat distribution. São Paulo Med J 125(4): 215-219.
- Ochs-Balcom HM, Grant BJB, Muti P, Sempos CT, Freudenheim JL, et al. (2006) Pulmonary function and abdominal adiposity in the general population. Chest 129(4): 853-862.
- Teixeira CA, Dos Santos JE, de Silva GA, Souza EST, Martinez JAB (2007) Prevalence of dyspnea and pathophysiological outbreaks in the face of obesity grades 2 and 3. J Bras Pneumol 33(1): 28-35.
- Cieslak F, Milano GE, Lopes WA, Randominsk RB, Rosário NA Filho, et al. (2010) The effect of obesity on spirometric parameters in adolescents submitted to bronchoprovocation by physical exercise. Acta Scientiar, Health Scie 32(1): 43-50.
- Aguiar I, Reis IS, Apostolico N (2012) Pulmonary capacity and ventilatory force in morbidly obese patients. Ter Man 10(47): 71-74.
- Black LF, Hyatt RE (1969) Maximal respiratory pressures: normal values and relationship to age and sex. Am Rev Respir Dis 99(5): 696-702.
- Abdalla OAE, Ibrahim R, Musa AO (2018) Respiratory muscle power and lung function in health obese sudanese medical students. J of Lung, Pulm Res 5(4): 126-128.
- Neder JA, Andreoni S, Lerario MC, Nery LE (1999) Reference values for lung function tests. II. Maximal respiratory pressures and voluntary ventilation. Braz J Med Biol Res 32(6): 719-727.
- Montemezzo D, Velloso M, Britto R, Parreira VF (2010) Maximal respiratory pressures: devices and procedures used by Brazilian physical therapists. Fisioter Pesq 17(2): 147-152.
- Cahalin LP, Arena R (2015) Novel Methods of Inspiratory Muscle Training via the Test of Incremental Respiratory Endurance (TIRE). Exerc Sport Sci Rev 43(2): 84-92.
- Bien U, Sampaio LMM (2017) Determination of reference values for the population of the State of São Paulo in the Incremental Respiratory Endurance Test. Postgraduate Program at the University of Nove de Julho; PhD Thesis in Rehabilitation Sciences.
- Formiga M, Roach K, Vital I, Urdaneta G, Balestrini K, et al. (2018) Reliability and validity of the test of incremental respiratory endurance measures of inspiratory muscle performance in COPD. Int J Chron Obstruct Pulmon Dis 13: 1569-1576.
- Harik-Khan RI, Wise RA, Fozard JL (1998) Determinants of maximal inspiratory pressure. The Baltimore Longitudinal Study of Aging. Am J Respir Crit Care Med 158(5 Pt 1): 1459-1464.
- Sgaribold D, Pazzianotto-Forti EM (2016) Predictive Equations for Maximum Respiratory Pressures of Women According to Body Mass. Respir Care 61(4): 468-474.
- Costa D, Gonçalves HA, Lima LP, Ike D, Cancelliero KM, et al. (2010) New reference values for maximum respiratory pressures in the Brazilian population. J Bras Pneumol 36(3): 306-312.
- Pazzianotto-Forti EM, Peixoto-Souza FS, Piconi-Mendes C, Rasera-Junior I, Barbalho-Moulim MC (2012) Behavior of respiratory muscle strength of morbid obese by different predictive equations. Rev Bras Fisioter 16(6): 479-486.
- (2005) ATS\ERS. Task Force: Standardisation of lung function testing. Standardisation of Spirometry. Eur Respir J 26: 319-338.
- Pereira CAC, Sato TRSC (2007) New reference values for forced spirometry in adult white Brazilians. J Bras Pneumol 33(4): 397-406.
- Knudson RJ, Lebowitz MD, Holberg CJ, Burrows B (1983) Changes in the normal expiratory flow-volume curve with growth and aging. Am Rev Resp Dis 127(6): 725-734.
- Cummings SR, Browner WS, Grady DG, Newman TB (2015) Outlining clinical research. (4th)., Porto Alegre: Artmed, p. 84.
- Sant Anna Junior M, Oliveira JEP, Carneiro JRI, Guimaraes FS, Torres DFM, et al. (2011) Respiratory muscle strength in obese, morbid and eutrophic women. Fisioter Pesq 18(2): 122-126.
- Sood A (2009) Altered Resting and Exercise Respiratory Physiology in Obesity. Cli Chest Med 30(3): 445-454.
- Chaunchaiyakul R, Groeller H, Clarke JR, Taylor NA (2004) The impact of aging and habitual physical activity on static respiratory work at rest and during exercise. Am J Physiol Lung Cell Mol Physiol 287(6): L1098-L1106.
- Peixoto-Souza FS, Picone-Mendes C, Baltieri L, Junior IR, Moulim MCB, et al. (2013) Lung age in women with morbid obesity. Rev Assoc Med Bras 59(3): 265-269.
- Castello V, Simões RP, Bassi D, Catai AM, Arena R, et al. (2011) Impact of aerobic exercise training on heart rate variability and functional capacity in obese women after gastric bypass surgery. Obes Surg 21(11): 1739-1749.
