ABSTRACT
A new quantitative method to detect SNP heterozygosity was established. Four DNA templates with same sequences except for one SNP site (A/G/C/T) were synthesized. The DNA templates were prepared by mixing any two of those templates. One outsourcing company was entrusted to perform the whole sequencing. The final sequencing results were analyzed with the free software Chromas 2.6.5 to find the laws. It was found:
1. For all of the mixed templates, the signals from two kind of nucleotides overlapped.
2. With the changes of the ratios for the different SNP in each mixed template, the shape of the overlap changed specifically. The found laws could be used to determine the degree of SNP heterozygosity. This method could be used to perform the analysis of SNP heterozygous samples under the urgent situation with limited data resources or with limited judging time.
Keywords: SNP Heterozygosty; Sanger DNA Sequencing; New Quantitative Method
Introduction
Sanger DNA sequencing is the widely used “gold standard method” to verify the results of TaqMan qPCR and second generation DNA sequencing [1-5]. At the same time, with the technological and commercial advances, many outsourcing companies provide Sanger DNA sequencing services [6,7]: as long as the customer provide the sequencing materials and information, such as DNA template, amplification primers, sequencing primers, and sequencing requirements for the target DNA, the outsourcing companies can professionally perform the steps including the amplification of target DNA template fragments with ordinary PCR, electrophoresis, recovery of amplified DNA template fragments, mixing DNA templates, sequencing primers and sequencing dye mixture Big Dye, sequencing the DNA template on Sanger sequencer, and finally the DNA sequencing map is produced, which can be opened and analyzed by the open software Chromas.
SNP is the abbreviation of single nucleotide polymorphism. SNP exists widely in human genome [8,9]. For a specific SNP site, human beings have two sequence sources, one from father and the other from mother [10-12]. Therefore, for human SNP sites, there are homozygous and heterozygous genotypes: homozygous genotype refers to same SNP signals from father and mother, and heterozygous genotype refers to different SNP signals from father and mother. For the case of heterozygosity, the two SNP signals are usually equal in quantity, and the ratio is 1:1. The detection of heterozygous SNP samples is generally based on TaqMan PCR and second-generation DNA sequencing to find putative sites, and then further verified by Sanger DNA sequencing. Because the heterozygous SNP samples have different SNP signals of 1:1, there will be two overlapping signal peaks at the SNP sequencing map, so it can be judged that this person is heterozygous genotype for that SNP site. However, due to the process of DNA extraction or the existence of genomic chimerism in heterozygous SNP samples, the amount of two kinds of SNP signals is sometimes not 1:1, and there may be a variety of ratios such as 2:1, 5:1, 10:1, 20:1, etc. The sequencing maps for heterozygous SNP samples with those unconventional ratios have not been systematically studied, which will cause misjudgment or missed judgment.
In this study, we artificially simulated SNP heterozygous samples with nucleotides polymorphisms, mixed two of the DNA templates with different SNP in the ratio of 1:1, 2:1, 5:1, 10:1 and 20:1, and then analyzed the SNP sequencing map for the samples with different ratios, in order to establish the overlapping model map of nucleotide signals at different ratios, providing reference for correctly judging the SNP heterozygosity for different nucleotides.
Materials and Methods
DNA Templates and Primers for PCR and Sequencing DNA Templates:
(1) Template 1: P-ctDNA-1, the sequence is as follows, and the SNP site was heavily marked red: 5’-AGCAGAGGGGACATGAAATAGTTGTCCTAGCACCTGACGCCTCGT TGTACATCAGAGACAGAGCATTTT ACACCTTGAAGACGTACCCTG-3’;
(2) Template 2: P-ctDNA-2, the sequence is as follows, and the SNP site was heavily marked red: 5’-AGCAGAGGGGACATGAAATAGTTGTCCTAGCACCTGACGCCTCGTTGTACATCAGAGACGGAGCATTTT ACACCTTGAAGACGTACCCTG-3’;
(3) Template 3: P-ctDNA-C, the sequence is as follows, and the SNP site was heavily marked red: 5’-AGCAGAGGGGACATGAAATAGTTGTCCTAGCACCTGACGCCTCGT TGTACATCAGAGACCGAGCATTTT ACACCTTGAAGACGTACCCTG-3’;
(4) Template 4: P-ctDNA-T, the sequence is as follows, and the SNP site was heavily marked red: 5’-AGCAGAGGGGACATGAAATAGTTGTCCTAGCACCTGACGCCTCGT TGTACATCAGAGACTGAGCATTTT ACACCTTGAAGACGTACCCTG-3’;
(5) Preparation of SNP heterozygous sample templates: artificially mixed any two of P-ctDNA-1, P-ctDNA-2, P-ctDNA-C and P-ctDNA-T samples with the ratio of 1:1, 2:1, 5:1, 10:1 and 20:1, and the final concentration was 12 μM. PCR amplification primers: (1) Primer 1: forward primer, P-ctDNA-3: 5’-AGCAGAGGGGACATGAAATA- 3’;
(2) Primer 2: backward primer, P-ctDNA-4: 5’-CAGGGTACGTCTTCAAGGTG-3. Sequencing primer: P-ctDNA-3: 5’-AGCAGAGGGGACATGAAATA-3’.
Sequencing Outsourcing Services
Chengdu Branch of Nanjing Qingke Biotechnology Co., Ltd. (Qingke company) was selected as the sequencing service provider. All SNP heterozygous sample templates with different ratios, amplification primers and the sequencing primer, and sequencing requirements were provided to Qingke company. The target band size for sequencing was 90 base pairs. The sequencing operations were professionally carried out by Qingke company. Finally, we obtained the DNA sequencing maps, which were map files with suffix ab1.
Analysis of Sequencing Map
The software for sequencing map analyses was chromas 2.6.5, which is a freeware. The analysis method was as follows: using Chromas software to open the map file with suffix ab1, produce the map picture, focus on the picture details at the target SNP site, and eventually obtain the picture mode for the SNP heterozygosity.
Results
A: G = 1:1 in SNP Heterozygous Template
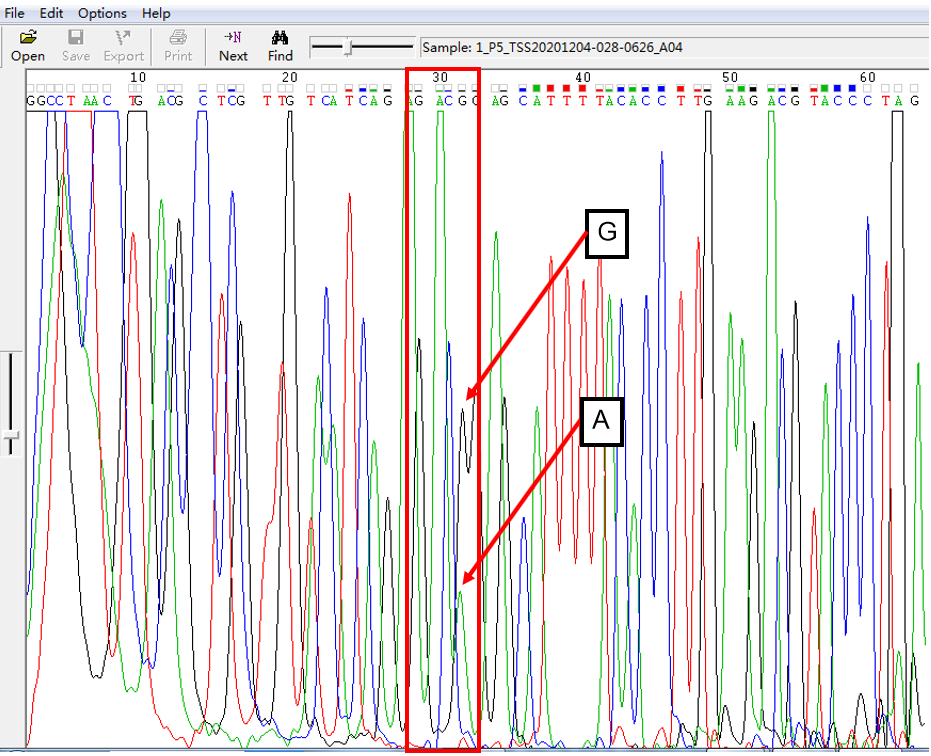
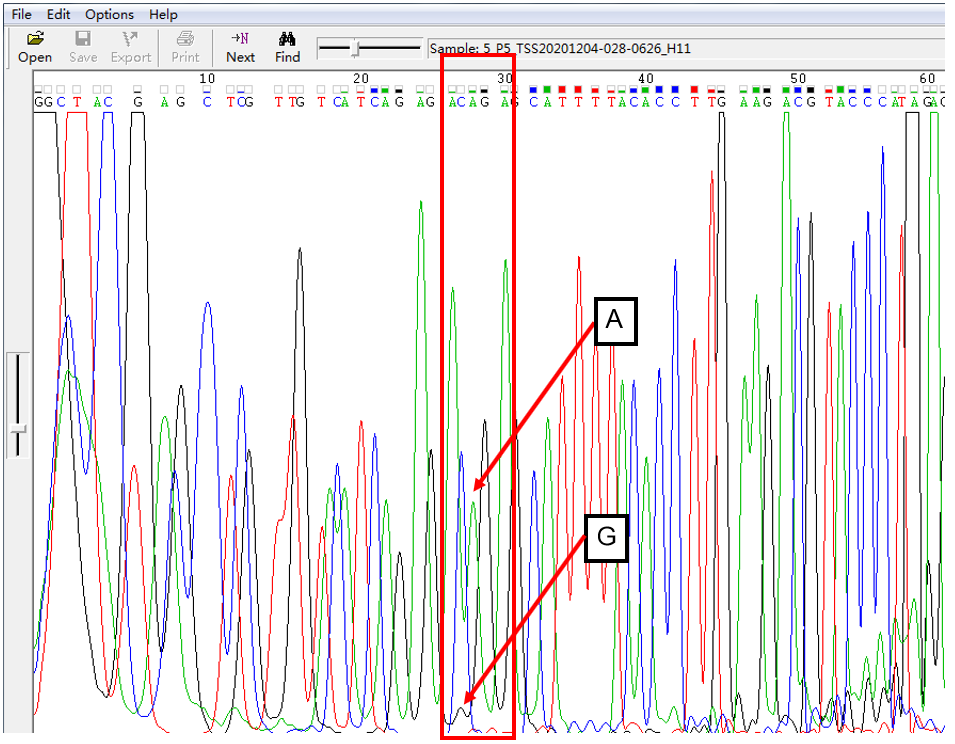
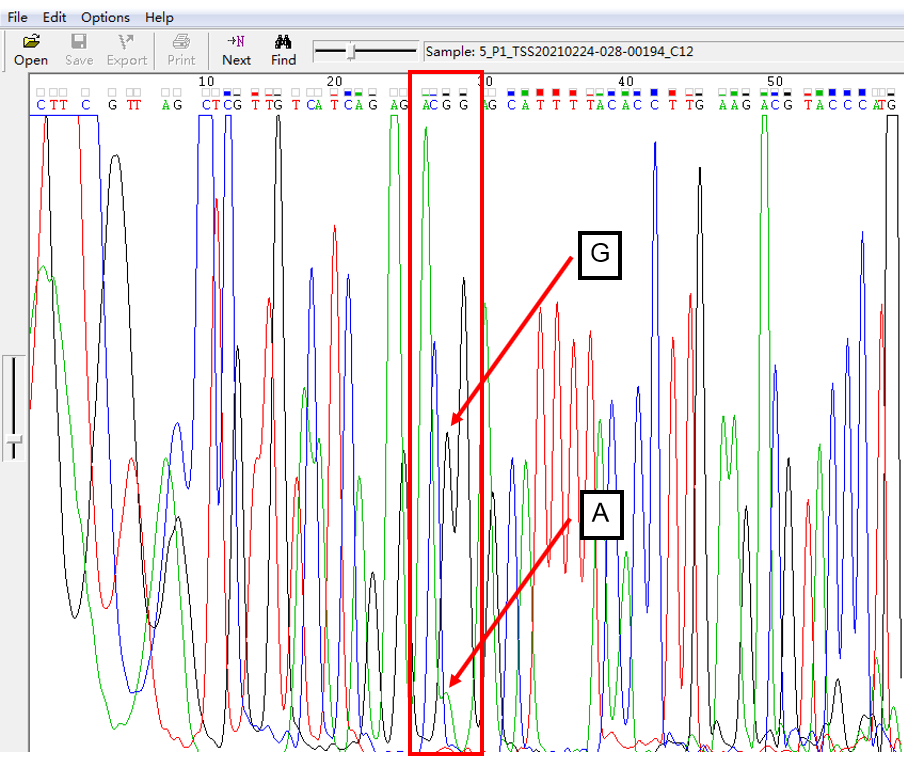
As shown in Figure 1, the signal of G overlapped with that of A, and the signal intensity of G was higher than that of A. This was the case of A: G = 1:1. The signal intensity is not only related to the amount of template, but also related to the fluorescent dye linked with different nucleotides.
A: G = 2:1 in SNP Heterozygous Template
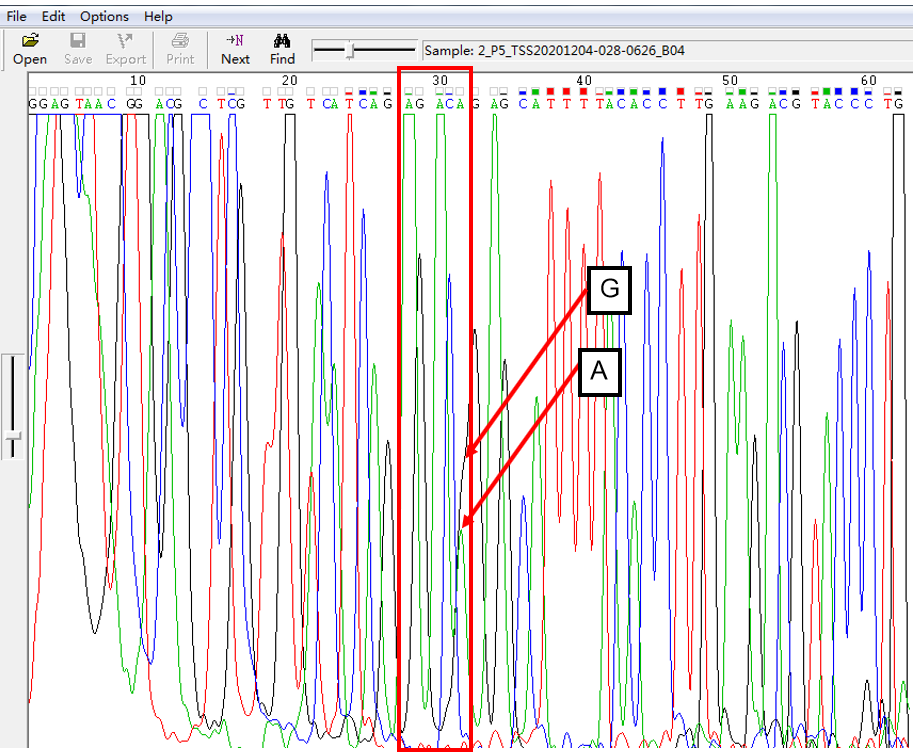
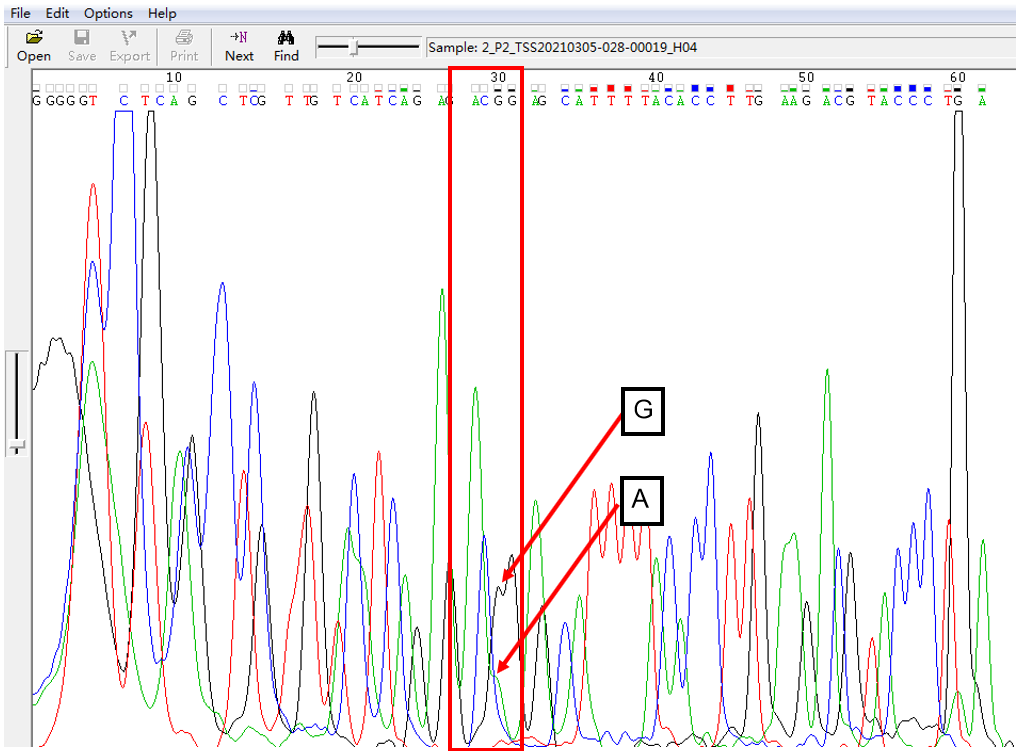
As shown in Figure 2, the signal of G overlapped with that of A, and the signal of G invaded the signal area of A in the form of a “big shoulder”. The signal intensity of G was higher than that of A, which was the case of A: G = 2:1.
A: G = 5:1 in SNP Heterozygous Template
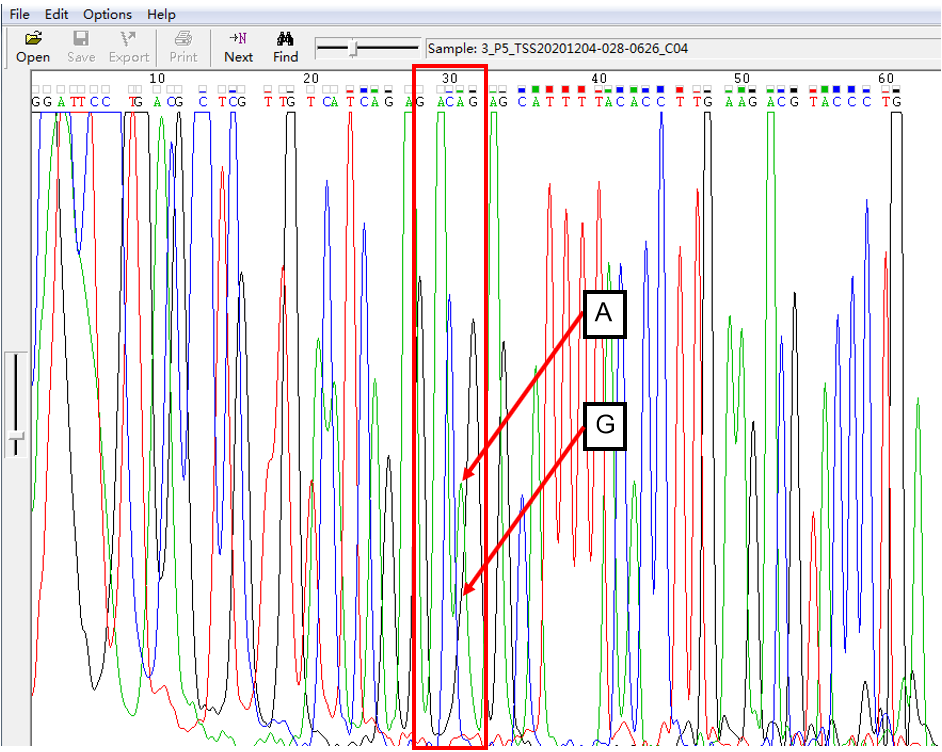
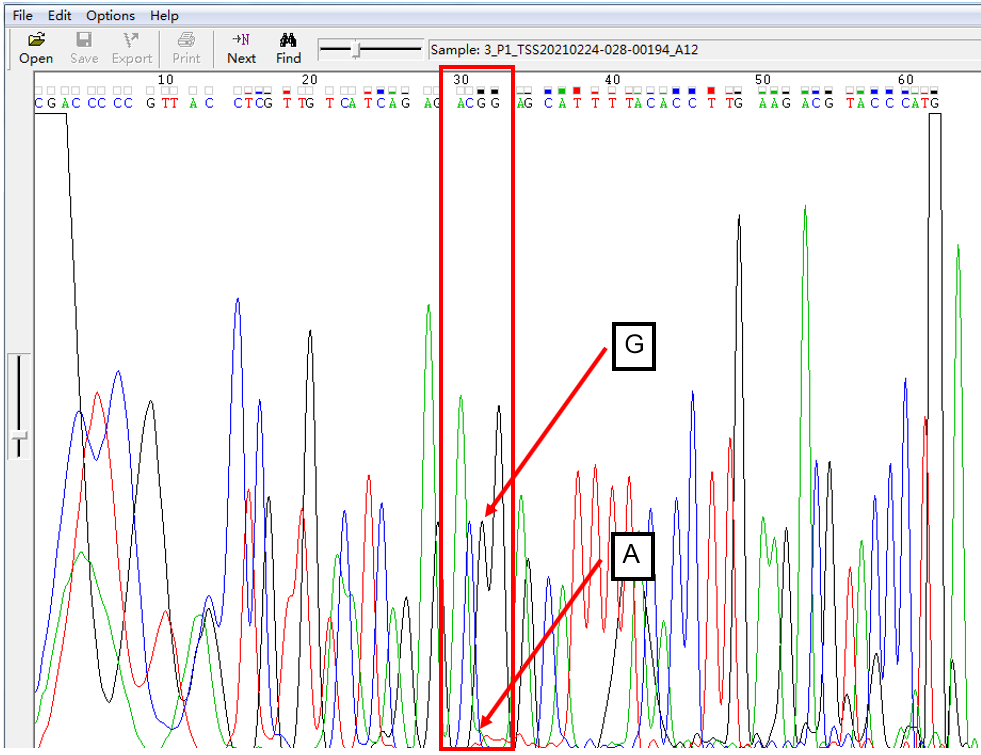
As shown in Figure 3, the signal of G overlapped with that of A, and the signal of G invaded into the signal area of A in the form of a “medium shoulder”. The signal intensity of G was lower than that of A, which was the case of A: G = 5:1.
A: G = 10:1 in SNP Heterozygous Template
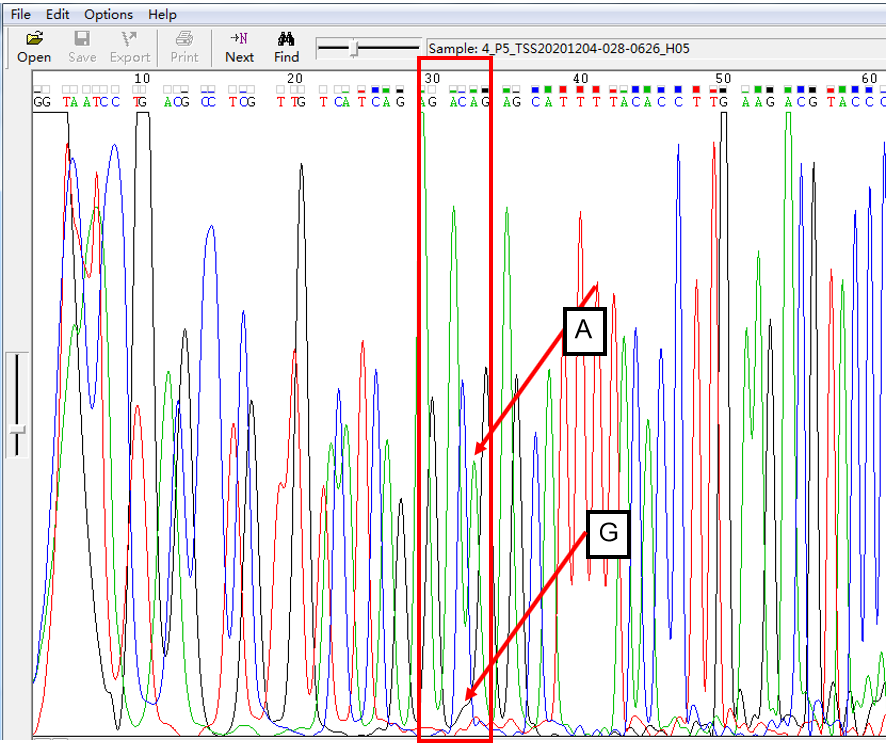
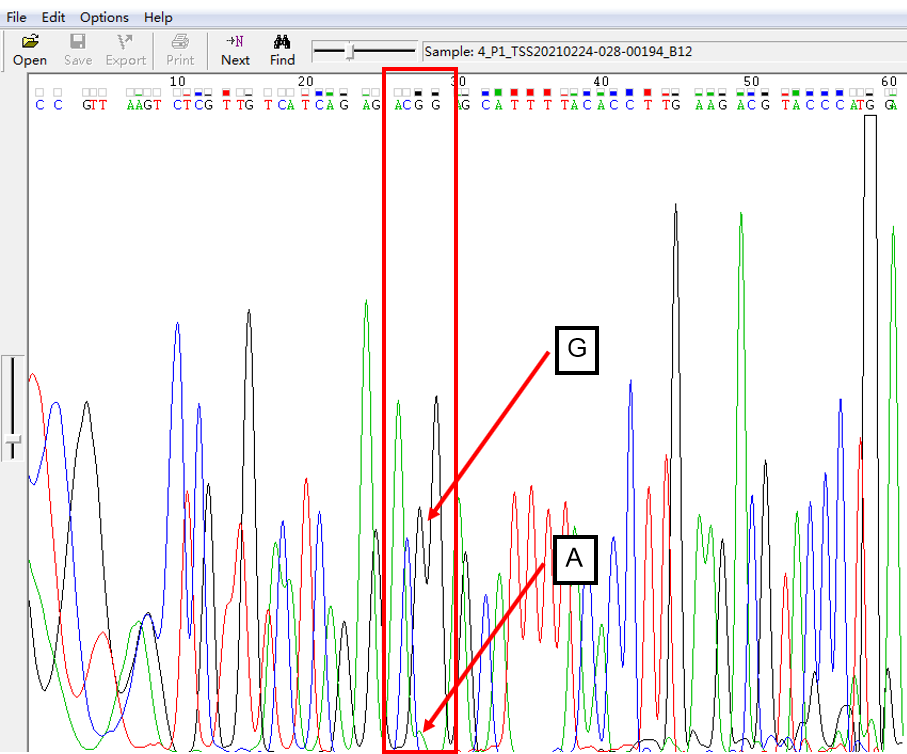
As shown in Figure 4, the signal of G overlapped with that of A, and the signal of G invaded into the signal region of A in the form of a “small shoulder”. The signal intensity of G was lower than that of A, which was the case of A: G = 10:1.
A: G = 20:1 in SNP Heterozygous Template
As shown in Figure 5, the signal of G overlapped with that of A, and the signal of G invaded into the signal region of A in the form of a “small shoulder”. The signal intensity of G was lower than that of A, which was the case of A: G = 20:1.
G: A = 2:1 in SNP Heterozygous Template
As shown in Figure 6, the signal of G overlapped with that of A, and the signal of A invaded the signal area of G in the form of a “big shoulder”. The signal intensity of G was higher than that of A, which was the case of G: A = 2:1.
G: A = 5:1 in SNP Heterozygous Template
As shown in Figure 7, the signal of G overlapped with that of A, and the signal of A invaded the signal area of G in the form of a “small shoulder”. The signal intensity of G was much higher than that of A, which was the case of G: A = 5:1.
G: A = 10:1 in SNP Heterozygous Template
As shown in Figure 8, the signal of G overlapped with that of A, and the signal of A invaded the signal area of G in the form of a “small shoulder”. The signal intensity of G was much higher than that of A, which was the case of G: A = 10:1.
G: A = 20:1 in SNP Heterozygous Template
As shown in Figure 9, the signal of G overlapped with that of A, and the signal of A invaded the signal area of G in the form of a “small shoulder”. The signal intensity of G was much higher than that of A, which was the case of G: A = 20:1.
Other SNP Heterozygous Templates
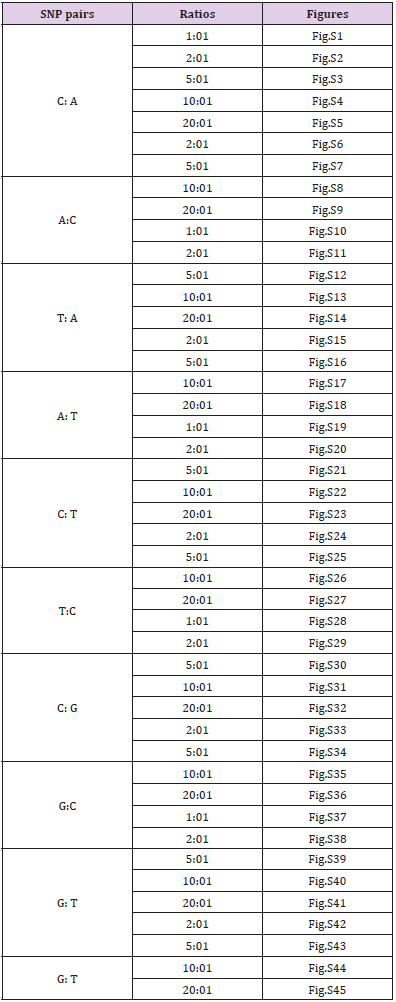
There were other pairs for SNP heterozygous templates summarized in the following Table 1 and supplementary materials.
Table 1: The summary of other pairs for SNP heterozygous templates.
Note: *p < 0.05 against CC, ^p < 0.05 against Post-HB, #p < 0.05 against Pre-HB.
Discussion
Through the analyses of SNP heterozygous samples with different proportions of samples, we could know the patterns of SNP heterozygous signals of different bases with various specific proportions, which could provide a judgment mode for using Sanger first generation DNA sequencing to verify SNP heterozygosity, which has not been systematically reported by all parties, so this study had the novelty. In conclusion, a new semi quantitative method for detecting SNP heterozygous samples solely by Sanger first generation DNA sequencing technology was established. This method can be used to guide the analysis of SNP heterozygous samples and is also suitable for the situation of limited data and the need for rapid SNP judgment in emergency.
Authors’ Contribution
Qian Wan led the research team, conceived the research plan, analyzed the data and prepared the manuscript. Jing Cai performed a major part of experiments and proof-read the manuscript. Junbei Xiang participated the investigation and proof-read the manuscript.
Acknowledgments
Not applicable.
Disclosure Statement
No potential conflict of interest was reported by the authors.
Funding
This study was supported by Scientifc Research Program of Sichuan Health Commission of China (No. 16PJ404).
References
- McGinn S, Gut IG (2013) DNA sequencing - spanning the generations. N Biotechnol 30: 366-372.
- Erwin L van Dijk, Yan Jaszczyszyn, Delphine Naquin, Claude Thermes (2018) The third revolution in sequencing technology. Trends Genet 34: 666-681.
- Tipu HN, Shabbir A (2015) Evolution of DNA sequencing. J Coll Physicians Surg Pak 25: 210-215.
- Sung Min Kim, Seong Yeon Yoo, Soo Hyun Nam, Jae Moon Lee, Ki Wha Chung (2016) Identification of Korean-specific SNP markers from whole-exome sequencing data. Int J Legal Med 130: 669-677.
- Jana Neupauerová, Dagmar Grečmalová, Pavel Seeman, Petra Laššuthová (2016) Massively parallel sequencing detected a mutation in the MFN2 gene missed by sanger sequencing due to a primer mismatch on an SNP site. Ann Hum Genet 80: 182-186.
- Smith DR (2015) The outsourcing and commercialization of science: Is the lab CEO the future of academic research? EMBO Rep 16: 14-16.
- Mattheakis L (2013) Outsourcing and contract services. J Biomol Screen 18: 1338-1339.
- Richard Redon, Shumpei Ishikawa, Karen R Fitch, Lars Feuk, George H Perry, et al. (2006) Global variation in copy number in the human genome. Nature 444: 444-454.
- Riva A, Kohane IS (2004) A SNP-centric database for the investigation of the human genome. BMC Bioinformatics 5: 33.
- Claus Børsting, Juan J Sanchez, Hanna E Hansen, Anders J Hansen, Hanne Q Bruun, et al. (2008) Performance of the SNPforID 52 SNP-plex assay in paternity testing. Forensic Sci Int Genet 2: 292-300.
- Zhen Qiao, Jie Zheng, Øyvind Helgeland, Marc Vaude, Stefan Johansson, et al. (2020) Introducing M-GCTA a Software Package to Estimate Maternal (or Paternal) Genetic Effects on Offspring Phenotypes. Behav Genet 50: 51-66.
- Kumar A, Agarwal S, Pradhan S (2015) Haplotype analysis and LD detection at DM1 locus. Gene 567: 45-50.

 Research Article