 Research Article
ABSTRACT
Due to the COVID-19 pandemic, many questions have been raised regarding the spread of the virus in public offices. In this type of environment, surfaces such as door handles, tables and screens are most susceptible to contamination. The potential of viral spreading via contaminated surfaces depends particularly on the ability of the virus to maintain infectivity whilst it is in the environment. This study focuses on the physical factors, specifically how indoor air flow influences the separation of viruses from the contaminated surfaces. Common building surfaces were modelled into two configurations of flat and cylindrical shapes. The finite difference method was utilized to numerically model the formation of laminar boundary layers, applied drag forces, and wall shear, which were resulted from five free stream velocities of airflows. The assessment of the indoor air potential for moving viruses is captured based on the comparison of adhesion force between the virus and solid surfaces and applied shear and drag forces on the viruses. Results are presented for both plain and rough surfaces. The effect of the roughness was considered for three different materials including glass, steel, and wood. Rough surfaces were modeled for a worst-case scenario of vulnerability of viruses against the airflow, in which an isolated virus exposed to the airflow on the bumps with a height equal to the mean roughness values. The results show that in most cases, the adhesion force of the virus to the surface is noticeably greater compared to the drag force caused by the airflow and it is very unlikely that the indoor air flow splits the viruses from the surface. The exception applies to the very unlikely high velocities (above 5 ms-1) on the edge of the flat surfaces, or at the specific angles (50°≤Φ≤51°) of the cylindrical model.
Keywords: Computational Fluid Dynamics (CFD); SARS-CoV-2; Adhesion Force; Surface Roughness; Indoor Air Flow; Resuspension
Nomenclature
Introduction
The Coronavirus disease 2019 (COVID-19) is a devastating challenge for many countries worldwide. A new class of Coronavirus, known as SARS-CoV-2 (Severe Acute Respiratory Syndrome Coronavirus 2) has been found to be responsible for the occurrence of this disease. According to the World Health Organization (WHO), the disease is rapidly spreading around the world, and, to date, the virus has affected more than 200 countries, causing severe health, economic, and social disruption to the entire human population [1]. There are two modes of transmission: the first is through respiratory droplets, while the second is through contact routes [2-4]. Respiratory droplet transmission is due to coughing or sneezing by an infected person to a healthy person. This type of transmission can be avoided by keeping a safe distance between people, and by not coughing or sneezing in open air [5] Another form of transmission is through contact route, in which the infected person somehow transmits the virus onto a surface and infects healthy persons through various mechanisms, such as the airborne contaminations considered in this investigation. This type of transmission depends upon surface stability, which is the duration of time a material can hold the virus. The Coronavirus can sustain itself up to 72 hours on surfaces like plastic and steel [6,1]. One of the principal uncertainties is related to how COVID-19 is transmitted, especially the factors which may accelerate or delay its spread. These factors include the mode and speed of transition, and interaction of Coronavirus with surfaces such as landing, attachment, survival and detachment. This is particularly important in indoor spaces, where density of people, availability of open surfaces, and circulating airstream can possibly increase the risk of infection. In this regard, World Health Organization (WHO) believes it is urgent to investigate the transmissibility of Coronaviruses from contaminated surfaces [7]. Very recent case studies in localized outbreaks of COVID-19, such as the Diamond Princess Cruise ship in Japan, some restaurants in China [8], and some Call Centers in South Korea [9], have shown that contaminated surfaces in indoor spaces are potential sources for spreading the Coronavirus. In the United States, Centers for Disease Control and Prevention (CDC) believes that because respiratory droplets can land and survive on some surfaces, it is possible that surfaces could be a real issue in transmission of COVID-19 (CDC, 2020). In fact, due to the lack of information, the mechanism by which a contaminated surface spreads the Corona virus is not clearly understood. It is crucially important to study whether the main cause of the Coronavirus spread is separation from surfaces by indoor airstream or touching of the contaminated surfaces.
The potential of viral spreading via contaminated surfaces depends particularly on the ability of the virus to maintain infectivity whilst it is in the environment. This is affected by a combination of biological, physical, and chemical factors. Rapid spread of viral infections through contaminated surfaces is common, particularly in crowded indoor establishments, such as schools, day-care facilities, nursing homes, business offices, hospitals, and transport systems [10]. Interactions that take place between viruses and surfaces are determined by their characteristics, which involve electrostatic, hydrophobic, and/or ionic strength of the virus [11,12]. Therefore, it is necessary to systematically investigate how ambient airflow influences the contaminated surfaces. Viruses are believed to be the most disinfection-resistant microbial pathogens [13]. Therefore, a better understanding of how they relocate and attach to surfaces is very important. In this regard, one of the significant factors that governs the spread of a virus is how it interacts with surrounding surfaces and the strength of the virussurface bond. This is especially important in indoor spaces such as hospitals, classrooms, offices, etc. When a virus lands on a surface, a variety of bonds can play role(s) in virus-surface interactions, such as electrostatic bonds, hydrophobic bonds, Van der Waals bonds, hydrogen bonds, charge-transfer bonds, and biospecific bonds [14]. In this list, electrostatic interaction has been recognized as the dominant factor for virus-virus or virus-surface interactions [15-19]. Viruses are colloid-sized particles composed of capsid proteins encapsulating infectious genetic material (nucleic acids). The surface charge on viruses is caused by ionization of the typical amino acid groups.
Surface functional groups on these amino acids are dominated by carboxyl and amine groups, which yield viruses with amphoteric surfaces and pH values ranging from 3 to 7. Therefore, viruses may be positively or negatively charged [20]. Many studies have been performed to measure the force needed to detach a virus from a surface. Several techniques have been developed for measuring forces between biological structures, including mechanical springs made from glass fibers [21], vesicle-based force transducers [22], optical tweezers [23], and surface–force apparatus [24]. These methods have sufficient sensitivity (0.01–1 nN ) to detect the intermolecular forces between protein bindings but lack spatial resolution. Atomic force microscopy (AFM) has been extensively used to measure the adhesive force of the protein-based structure of a virus to the surface. The major advantage of AFM over these other techniques is its spatial resolution and lateral resolution, which is of paramount importance at micron and nanoscales [25]. The average adhesion force of proteins (including Coronaviruses) to different surfaces has been reported from 44 up to 250 pN [26], 140 to 180 pN (ROHDE, 2020), and 257±25 pN [27]. The adhesion force between a surface and a protein-based structure can change due to a variation of many parameters such as the type of protein, pH, the morphology, and the materials of the surface. In this study, the average adhesion force of a virus to a surface (Fa) is considered between 40 and 140 pN . Moreover, Coronavirus virions are assumed spherical, with diameters of approximately 125 nm, as depicted in recent studies by cryo-electron tomography and cryo-electron microscopy [28-30].
SARS-CoV-2 viruses could be spread in the surrounding air due to the regular human activities such as exhaling, sneezing, coughing, talking etc. The virus can be considered airborne until the time that it deposits onto a surface. There have been several studies that investigated the motion and spread of the suspended viruses in air before their deposition on surfaces [31-34]. Deposition of the airborne particles on surfaces depend on different factors including the size, shape, and weight of the particles, and the velocity and direction of airflow (flow pattern) [35,36]. Numerous experimental and theoretical investigations have been conducted to study the conditions of particles’ deposition on solid surfaces [36-41]. Once the particles settled on a surface, the resuspension of the particles depend on the application of external force to detach the particle from the surface. Studies show that about 70% of the aerosol particles and droplets settle on the surfaces and walls. There have been several studies, which linked the transmission rate of SARS-CoV-2 viruses to the direct contact of the humans with contaminated surfaces [42-44]. However, if the indoor airflow could cause the resuspension of the SARS-CoV-2 viruses, then it increases the chance to be inhaled by the occupants in the vicinity of the surfaces.
This study focuses on the effect of airflow (the speed of air current flowing through indoor spaces) on transmissibility of the Coronavirus. Its aim is to investigate whether or not the Coronavirus can be dispersed from a contaminated surface into the air and transferred onto a new surface. The findings of this study can help us to have a better risk assessment of being in closed spaces, where Coronavirus contaminated surfaces exist. In this regard, regular surfaces in a typical building are simply modeled in two major categories, including flat plates and circular cylinders. Furthermore, the effect of surface roughness has been considered in the models. Three main categories of materials were considered in this study including glass, steel, and wood, with mean roughness values of 1,46, and 183 μm respectively [45]. Based on the ASHRAE standards [46], the velocity of air in a room depends on the various factors such as the floor area, height of the ceiling, cooling or heating purposes, number of occupants, and types of the buildings. However, regardless of the mentioned factors, generally, the goal is to keep the indoors air velocity below 0.25 ms-1 for cooling and less than 0.15 ms-1 for heating. Moreover, the duct design standards of ASHRAE, holds the limitation of 12.6 ms-1 of the maximum airflow through the ducts with different shapes [47]. A study by Gong et al. suggests that the acceptable air velocity range for local air movement, is between 0.3 and 0.9 ms-1 [48]. In this study, five different velocities including 0.1, 0.5, 1, 5, and 10 ms-1 were considered in order to cover the overall range of indoor airflows from regular applications to the very unlikely extreme cases. The indoor air flows have random directions, and the stagnant areas are also common; therefore, the exposure of the surfaces to the airflow varies with that regard. In this study, it was assumed a fan controlled the direction of the airflow with respect to the surface. In this regard, three conditions were considered: airflow parallel to a flat surface, perpendicular airflow toward a flat surface, and airflow over a circular cylinder.
Methodology
Airflow towards a Flat Plate
A condition can be considered, in which air flows toward a flat surface (e.g. fan blowing toward a screen, see Figure 1). If the direction of the airflow is perpendicular to the flat surface (Figure 1), the resulted momentum force on the surface is calculated from the following [49]:
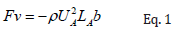
Figure 1: Schematic of the momentum impact of the fluid flow perpendicular to the plate.
Where, FV (N) is the normal momentum impact on the area
attacked by the fluid flow. The negative sign in Eq. 1 means that
FV is in opposite direction to the incoming fluid jet. UA (ms-1) is
the velocity of the air flow in x direction. ρ = 1.204 kgm-3, is the
air density at T = 20°C, LA (m) is the thickness of the jet, and b
(m) is the width of the plate in Z direction. Considering Eq. 1, FV is calculated based on the area of attack, LA×b. By assuming that
LA =b = 1cm (the approximate area of the tip of a fingerprint),
the calculated momentum impact with respect to the array of
the applied velocities, U = {0.1, 0.5, 1, 5, 10} ms-1, was calculated.
By modeling a Coronavirus as a sphere with diameter of D =
125 nm (Fehr and Perlman, 2015), the surface area of a virus is  Therefore,
  viruses
can be fitted in an area of the tip of a fingerprint (A=10-4 m2). By
assuming that, the whole area covered by n number of viruses, the
momentum impact on each virus was calculated by:
viruses
can be fitted in an area of the tip of a fingerprint (A=10-4 m2). By
assuming that, the whole area covered by n number of viruses, the
momentum impact on each virus was calculated by:
A viscous region with thickness of LB=LC forms along the flow in y direction in Figure 1.The analysis of the flow in those regions are similar to the boundary layer of a laminar flow parallel to the horizontal flat plate. If the airflow hits an inclined flat plate with the angle of β, the resultant momentum force is less or equal to the perpendicular air flow jet (β=0).
Airflow Parallel to the Flat Plate
Figure 2 shows the schematic of the flow over a flat plate. By assuming a one-dimensional flow (U>>V) over the plate, at room temperature as T = 20°C, and atmospheric pressure, the 2-D Naiver- Stokes equations for laminar, incompressible, steady state flow (Eq. 3) was solved with finite difference method.
Figure 2: A schematic of the parallel laminar airflow passes over a horizontal flat plate in macroscopic and microscopic scales (a model for a desk).
The nodal network considered as square with Δx=Δy=1μm. The boundary conditions were as in the following:
Boundary Conditions u(x,0) = v(0, y) = v(x,0) = 0 Eq. 3-d
u(0, y) = u(x, y→∞ =U
The assumption of non-slippery wall boundary condition was made based on the calculation of Knudsen number, Kn = λ/L, where λ is the mean free path of the gas (in current case, air at atmosphere pressure, λair = 68 nm) and L is the length-scale of the flow (in current case L=1cm). Based on theory [45], if Kn is significantly smaller than one (in current case, Kn =68×10-7), the wall can be considered nonslippery. The wall shear stress can be calculated with the Blasius exact solution for laminar boundary layer as the following:
The production of the surface area of a virus and the wall shear stress resulted from the airflow provides a good estimation of the amount of force applied to a single virus attached on a flat plate. Two assumptions were applied in this calculation (Eq. 5); first, the wall shear was calculated without considering the existence of a virus. Moreover, it was assumed the shear wall was applied 62.5 nm above of the flat surface at the equator of the sphere (see Figure 3).
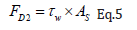
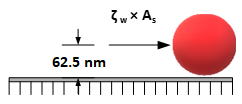
Figure 3: Force acted on the virus attached on a flat surface.
The Effect of the Surface Roughness on the Force Applied on a Single Coronavirus
The mean roughness value is specifying and comparing the height difference between the peaks on an otherwise smooth surface or troughs of the same amplitude. The nanometer-scale viruses with unknown numbers can randomly occupy the entire peaks and valleys of a surface. On the other hand, the shape, height, and the number of micrometer-scale bumps and troughs are random on a rough surface (Figure 4). In order to investigate the effect of the roughness on vulnerability or resistance of an attached virus against the airflow, two models are considered. The models were considered based on Dejaguin method [50], which has been widely practiced for particle resuspension studies [51,52].
a) Model 1: Ziskind showed that particles tend to occupy stable positions. Therefore, if the roughness of the surface is greater than the particle sizes, the particles mainly occupy the vacant areas between the peaks. Those picks which surrounded the particles were actually protect the particles from the applied external flow rates and decrease the resuspension rate of the particles significantly. We assumed that the viruses were accumulated in a sharp corner or valley and attached there (Figure 5). Based on the Falkner-Skan solution of the inviscid flow passing corners [45,53], the maximum velocity that a fluid can reach into a valley is umax=0.9999 uin. The velocity in the valley depends on θ as shown in Figure 5; however, regardless of the shape of the valley, it cannot reach a value higher than umax. This means the viruses will be protected against the airflow inside the valley and will be less vulnerable to the airflow in comparison to the situation in which the virus are attached on the plane plate. Deeper in the valley, the re-circulating eddies form making the velocities even smaller in comparison with the velocity on the flat plate ().
b) Model 2: In this model, it is assumed that an isolated virus attached to a single peak next to a perfect plane plate under the influence of the air flow. The peaks and valleys of a rough surface work like obstacles and decrease the velocity of the flow passing through them. It can be concluded the most vulnerable condition for a virus against the attacking flow occurs when it is sitting at the top of a peak. (See Figure 6). The solutions of 2-D Naiver-Stokes equations with finite difference method, provide the value of the velocity vectors at each node with any desirable height. Moreover, by assuming the height of a peak (H) is equal to the mean roughness (Ra) value of a material, the amount of the drag force, which is applied on an isolated virus at the peak can be calculated by Stokes’ sphere-drag equation:
Figure 4: The random number of valleys and peaks with different heights and depths form a rough surface,
a) smooth surface of a glass sample
b) rough surface of a steel sample.
Figure 5: The schematic of the viruses attached in a shallow crevice.
Figure 6: The schematic of an assumption that a single virus attached at the peak of a rough surface just next to a perfect plane plate in order to guarantee the extreme possible vulnerability of a virus against an undisturbed airflow.
where U is the applied velocity, μ=1.825×10⁻⁵ Pa.s is the
dynamic viscosity of air at T=20°,P=1 atm, and r=62.5 nm is the
radius of a Coronavirus. The Stokes’ equation is valid if ; however,
for the airflow over a Coronavirus the Knudsen number is . In this
situation, a slip correction factor is needed to be considered to
adjust the Stokes’ drag force [53,54]. By calculating the Cunningham
slip correction factor (Cs) [54,55], the corrected drag force is equal to  is as the following:
Where A1=1.257, A_2=0.4, and A3=0.55 are empirically determined constants [56,57] Cs is 2.53 and therefore, the calculated drag forces are needed to be divided by 2.53 to count for non-slippery condition; however, in order to increase the margin of safety and work with the higher values of applied forces on a modeled virus and roughness, the Cunningham correction is not considered in the current study.
Flow Over a Cylinder
Door handles are among the most touched surfaces in a room
and their contamination with Coronaviruses are very likely. A
typical door handle can be modeled as a circular cylinder with
the diameter of 2.5 cm. It was assumed that the freestream wind
velocity in x direction, U∞, is much greater than two other velocity
components, V and W. The Reynolds number  of the
different air flows pass the cylinder with applied velocities of U∞
= {0.1, 0.5, 1, 5, 10} ms-1, at T = 20°C (ν = 1.516×10⁻⁵ m2s-1), are
far less than the critical Reynolds number, ReD,C = 250,000, which
guaranties the laminar flow regime around the cylinder. The
Hiemenz’s polynomial velocity distribution [46] was considered for
calculating the boundary layer with finite difference method.
of the
different air flows pass the cylinder with applied velocities of U∞
= {0.1, 0.5, 1, 5, 10} ms-1, at T = 20°C (ν = 1.516×10⁻⁵ m2s-1), are
far less than the critical Reynolds number, ReD,C = 250,000, which
guaranties the laminar flow regime around the cylinder. The
Hiemenz’s polynomial velocity distribution [46] was considered for
calculating the boundary layer with finite difference method.
Where, x^*=x⁄r is the dimensionless arc length and r is the
radius of the cylinder. By considering x as the tangential and y as
the vertical directions on the surface of the cylinder, a domain was
defined like shown in Figure 5. The domain was considered for 2-D
finite different solution of Naiver-Stokes equations on the cylinder.
Based on Hiemenz model, the separation point takes place at ∅_
sep≈80.5°; therefore, the domain in x direction was considered as  while
while  and Δy=1 μm. Higher freestream
velocities result in smaller thickness of boundary layers; therefore,
the domain of 0 ≤ y ≤ 25 mm was considered for U∞=0.1,0.5 ms-
1,while 0 ≤ y ≤ 2.5 mm was taken for U∞=1,5 and 10 ms-1. The
two-dimensional, steady, laminar, incompressible boundary layer
equations at constant temperature and pressure are the same as
Eq. 3-a and 3-b. The boundary conditions of the system were as the
following:
and Δy=1 μm. Higher freestream
velocities result in smaller thickness of boundary layers; therefore,
the domain of 0 ≤ y ≤ 25 mm was considered for U∞=0.1,0.5 ms-
1,while 0 ≤ y ≤ 2.5 mm was taken for U∞=1,5 and 10 ms-1. The
two-dimensional, steady, laminar, incompressible boundary layer
equations at constant temperature and pressure are the same as
Eq. 3-a and 3-b. The boundary conditions of the system were as the
following:
Boundary Conditions u(0, y) = u(x,0) = v(x,0) = 0 Eq. 9
Result and Discussion
Momentum Impact of the Airflow Perpendicular to a Plane and Rough Plate
The adhesion force (Fa) between a Coronavirus and a solid surface is estimated as 40 140 a N ≤ F ≤ p . The applied forces on a Coronavirus with respect to the jet velocities are shown in Table 1. Considering the values of the applied forces due to the perpendicular airflow jets, even for the extreme case of , is far less than . Therefore, it is very unlikely that such vertical airflowjets cause any movement or removal of a Coronavirus from a plane plate. Since the direction of the jet flow is perpendicular to the surface, the two roughness models in this study do not play a significant role. If model 1 is considered, the airflow should impact a virus in a sharp corner which is less vulnerable to the applied force at the plane plate. On the other hand, if model 2 is considered, the condition of a virus located just a few micrometers closer to the airflow jet makes no difference in compression with the condition of the attached virus on a plane plate.
Table 1: Momentum impact of the vertical airflow jet on the 1 cm2 of a plane plate and a sphere-modeled Corona virus with D=125 nm.
The Force Applied to an Isolated Virus Resulted from the Parallel Airflow to a Plane and Rough Plate
Considering the exact solution of Blasius for a laminar flow over a flat plate (Eq. 4), the wall shear stress leads to infinity at x=0. This means if a virus is attached to the edge of the plate x=0, it will be removed from the surface regardless of the free stream velocity of air. If a Coronavirus is attached at x=1 nm on a plane plate, then the wall shear for the highest velocity of airflow, U=10 ms-1, is W τ =1.56 kPa which leads into FD2=76.4 pN . This value indicates that the movement of a Coronavirus at x=1 nm is still possible with such an applied velocity. However, 3 nm further, at x=4 nm, the movement of virus becomes very unlikely since FD2 (x=4 nm) =38.2 pN for U=10 ms-1. It is also very important to consider the fact that experiencing velocities like U=5 or 10 ms-1, is extremely unlikely in a building and such velocities exist only inside the big air canals. Even for the extreme case of U=10 ms-1, only at the first 3 nm from the plates’ edge, an isolated virus is vulnerable to movement or removal from the surface. Figure 7 shows the magnitude of the force, D2 W s F =τ × A , applied on an isolated virus due to the wall shear at the first 100 nm of a plate from its edge for 2 free stream velocities of U=5 and 10 ms-1. The max value of FD2 for different applied freestream velocities at x=1 nm are shown in Table 2.
Figure 7: Magnitude of the forces applied on an isolated virus due to the shear stress on a plane plate in the first 100 nm from the edge of the plate.

Table 2: Force applied on an isolated virus located at x=1 nm from the edge of the plane plate due to shear stress.
Considering Figure 6, since the peak-height of the smoothest material, glass, with Ra=1 μm, stands outside of the boundary layer at x=0, the applied free stream velocity will hit the isolated virus at tip of the bump (see Figure 8a). The Stokes drag forces (Eq. 6), which applied on a virus due to the different applied free stream velocities are shown in Table 3. The force values in Table 3 show that even for the unreal extreme model 2 case (considering an isolated virus at the peak of a rough surface), at unlikely position of the edge of a plate (x=0), it is impossible for regular air velocities in a building to overcome the adhesion force (Fa) between a single Coronavirus and a solid surface. However, the results show that for extreme applied velocities with consideration of all extreme assumptions, it is possible for the airflow to move the virus from the edge of a flat surface. In this study, the highest peak of a rough surface is wood with Hwood=183 μm. The thickness of a boundary layer depends on the applied free stream velocity. Higher velocities result in boundaries with steeper edges and smaller thicknesses, δ. Therefore, in order to keep the peak of the rough surfaces inside the boundary layer, the peaks should be considered further far away from x=0 with respect to the applied free stream velocities. For U=10 ms-1, the first point at which the wood-peak will be located inside the boundary layer is at x=346 μm.
This is the furthest point among all applied velocities. Inside the boundary layer, the velocity of each node can result in a drag force applied on a single Coronavirus at the peak of a rough surface (see Figure 8b). The x-component velocities (u) versus x are depicted in Figure 9 at y=183 μm through the entire domain, 0 ≤ x ≤10 mm, for U=1 and 10 ms-1. The trends of the graphs for the other applied velocities are the same, but the (u) values are different. It is clear in Figure 10b that during the first 346 μm, the peak of a rough wooden surface stands outside the boundary layer u=U=10 ms-1. The average applied drag forces due to the x-component velocities at y=1,46 and 183 μm for all cases in the domain of 0 ≤ x ≤10 mm are summarized in Table 4. The possibility of the movement of an isolated virus from the peak of a modeled rough surface is relatively high for the free stream velocities of U=5 and 10ms-1 in 1 cm distance from the edge of the plate. However, it is very unlikely the other applied velocities cause the removal of the virus from the peak in that domain. The applied drag forces with respect to the free stream velocities in Model 2 of the roughness at x=10 mm, are summarized in Table 5. It is obvious that the movement of the virus is only possible for U=10ms-1 on the wooden-surface at x=10 mm. This means that within 1 cm distance from the edge of the plate, the displacement of an isolated virus is possible for freestream velocities equal or higher than U=10 ms-1, which exceeds the common indoors air velocities.
Figure 8: The condition of the peak of a rough surface with respect to the boundary layer.
a) at x =0, the green peak, all the peaks stand outside of the boundary layer.
b) The peaks (e.g. the orange one) of all three materials are inside the boundary layer at x ≥ 346 μm for all the applied free stream velocities.
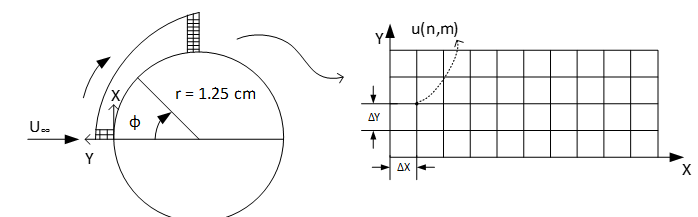
Figure 9: Schematic of the laminar airflow passes the circular cylinder and the defined domain in order to study its boundary layer.
Figure 10: The velocity components in x direction at y=186 μm above the flat surface, representing the peak of a wooden rough surface, for two applied velocities
a) U=1 ms-1, and
b) U=10 ms-1

Table 3: The magnitude of force applied on an isolated virus attached at the peak of a rough surface at the edge of the plate (x=0 nm) outside the boundary layer.
Table 4: The average applied drag force due to the x-component velocities at y=1, 46 and 183 μm for all applied free stream velocities in the domain of 0≤x≤10 mm.
Table 5: The applied drag force due to the x-component velocities at y=1,46 and 183 μm for all applied free stream velocities at x=10 mm.
The Force Applied to an Isolated Virus Resulted from Airflow Over Plane and Rough Circular Cylinder
he Hiemenz velocity distribution model (Eq. 8) indicates that the maximum free stream velocity, U(x*), takes place at ∅=71.2° regardless of the applied U∞; however, the maximum wall shear stress forms between ∅=50°-60° for different applied U∞. Figure 11 shows how the boundary-layer profile forms along the curve from the stagnation point for every Δ∅=20° until it reaches its separation point at ∅sep=81°. The favorable gradient increases the wall shear stress up to ∅=60°. Figure 12 shows the shear wall profile of the U∞=1 ms-1 over the cylinder model. The trends of the shear wall profiles around the cylinder are as the same as Figure 12 for all five applied U∞, but the maximum values and their point of occurrences are different (Table 6). Even for the highest applied velocity U∞=10 ms-1, the drag force on an isolated Coronavirus is less than the adhesion force. Considering Figure 6, it would be necessary to figure out about the velocity profiles at y= 1,46 and 183 μm, which represent the peak of the glass, steel and wood surfaces inside the boundary layer around the cylinder (model 2). Having the velocity profile at each height, the max velocity will be considered in order to calculate the highest possible applied drag force on an isolated virus at the peak of a rough surface (FD3). Figure 13 Error! Reference source not found. shows the velocity profile of U∞=1 ms-1 at three desirable heights. The maximum velocity takes place around Φ=50°. The trends of the graphs for the other applied incident velocities (U∞) are the same with U∞=1 ms-1; however, the resulted velocities at each peak inside the boundary layer varies with respect to the applied incident velocities.
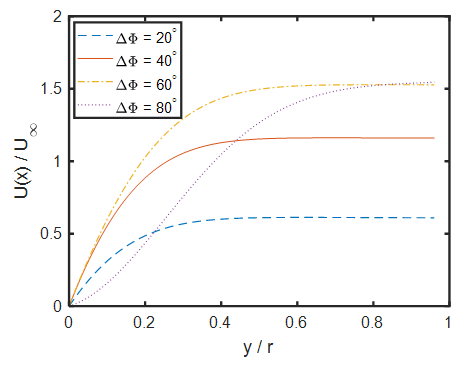
Figure 11: Velocity profile of the laminar flow pass a cylinder with free stream velocity of U∞=1 ms-1 based on Hiemenz model at four different arc ranges Δ∅ = 20°,40°,60°,80°.
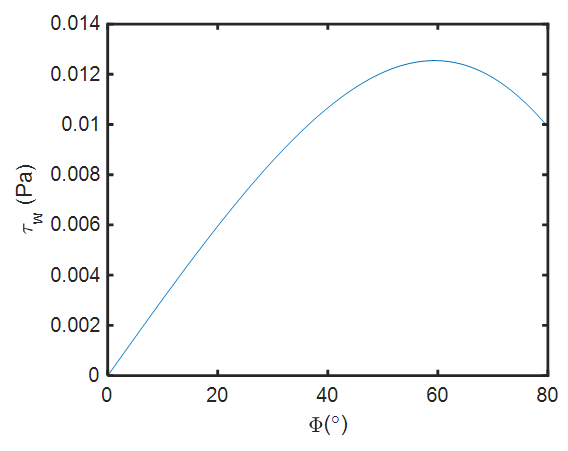
Figure 12: Wall Shear profile on a cylinder exposed to the laminar external air flow with U∞=1 ms-1.
Figure 13: Velocity profiles in x direction at y= 1, 46, and 183 μm, representing the applied velocity at the peak of the three rough surfaces: glass, steel, wood consequently.

Table 6: The locations where the maximum wall shear stress takes place on the surface of a cylinder exposed to the laminar airflows with the various U∞ and its representative force with respect to the surface area of an isolated corona virus modelled as a sphere (AS).
Table 7 shows D3,max F values, it also indicates that only in the case of U∞=10ms-1, the maximum velocity at y=186 μm (wood model) within the boundary layer will result in a drag force of D3,max F =55.75 pN . Such a drag force may cause the removal of an isolated Coronavirus from the peak. Considering the extreme rareness of such an incident velocity in a room, it can be concluded that it is very unlikely that the regular airflows over the cylindrical shape objects (e.g. door handle) can cause the movement or removal of Coronaviruses from a surface.3.4 Verification of the obtained results. The mean roughness value of the surface in addition to the size of the particles specify the adhesion force between the particle and the surface and also determine the effect of external flow on the particles. However, it has shown in several research papers that when the size of particles are reduced from micro- to nano-scale, the topography of surfaces and the dimension of the particles play more important role in determination of required drag force for resuspension rather than the types and materials of the particles [58].

Table 7: Maximum possible drag forces, which resulted from the velocity profiles around the circular cylinder, applied at an isolated virus at the peak of three rough surfaces: glass, steel and wood.
Ziskind, Ibrahim et al, Jiang et al, Mukai et al., and Soltani and Ahmadi showed that for given flow and surface conditions the size of the particle plays the most important role in detachment [59-62]. Kim, and Corn and Stein showed that by decreasing the size of the particles the required drag force for resuspension of them increases significantly [63,64]. Therefore, due to the very small size of the SARS-CoV-2 viruses, it is justifiable to consider the experimental studies which conducted on the particles with the same sizes as the virus. Hubbe showed in his experimental studies that the required shear stress for detachment of TiO2 particles with diameter of 144 nm is about 200 Pa [65]. Considering the diameter of a Coronavirus, dp =125 nm, it can be concluded the applied shear must be greater than 200 Pa in order to detach the Coronavirus from the plane surface. Based on the analytical calculation provided in our study, the wall shear stresses resulted from the applied free stream velocities of U = 10 and 5 ms-1 can only reach over 200 Pa at the first 20 nm of the edge of the flat plate.
Such a conclusion can be made by only comparing the wall shear values and the obtained experimental results from other studies. In our studies, we concluded that the only first 4 nanometers from the edge of the flat plane can be regarded as a potential region for resuspension when U=10 ms-1 was applied [66]. showed in their experimental studies that the glass particles with the diameter of between 1-10 μm on hardwood and vinyl flooring were not detached by the applied freestream velocities less than 18 ms-1 [66]. Corn and Stein observed that the velocity up to 117 ms-1 was required for resuspension of glass particles with the diameter of 10.6 μm on smooth glass surfaces and Jiang et al. found that velocities greater than 50 ms-1 were necessary to resuspend 11 μm poly (methyl methacrylate) (PMMA) particles [67,68] gathered a wide range of experimental studies indicating that an average velocity of 25 ms-1 is required for resuspension of micro-scale particles from different surfaces [69]. Such experimental results support the provided conclusion in our study since for nano-scale size of a Coronavirus even greater applied velocities are required than the ranges suggested based on experiments in previous studies for micro-scale particles.
In addition to the technical fluid mechanics studies, the new experimental studies in real situations are in strong agreement with the conclusions of our model. For example, [70]. investigated the risk assessment of viral transmission of SARS-CoV-2 viruses from the contaminated surfaces due to the indoor airflows [70]. In their comprehensive study of Shanghai Public Health Clinical Center with 115 rooms, they concluded that the indoor airflow could not resuspend the SARS-CoV-2 viruses from various contaminated surfaces. They collected samples from floors, walls, washbasins, furniture, medical and personal protective equipment surfaces, as well as air samples, from airborne infectious isolation rooms. They also collected air samples from 15 rooms and areas close to the surfaces. They found no SARS-CoV-2 virus in the air close to the surfaces which all exposed to air supply from the air conditioning system in the rooms. Moreover, they collected surface samples from air exhaust and HEPEA filters and failed to detect any virus. Similarly, air samples collected in the corridor or the changing rooms of the semi-contaminated area did not show any presence of the virus. They finally concluded the risk of airborne transmission of SARS-CoV-2 in airborne infectious isolation rooms was low (1.62%) due to the directional airflows.
Many other studies have been conducted since the beginning of the pandemic, which do not directly verify the obtained results of our model; however, they show almost no evidence of the resuspension and spread of SARS-CoV-2 viruses due to the indoor airflows. For example, in a research study regarding the virus transmission in plane cabins, [71] concluded that in the regularly ventilated cabin, those who seated near the windows were subject to less infectious particles. [72] In their review and interpretation of [73]. investigation showed that despite the existence of the contaminated surfaces like windows, seats, laptops etc., the nearby passengers did not get infected by the viruses, while the direct air supply from the ceiling air inlets continuously reached those surfaces [74]. Some other studies like modeling study of the COVID-19 outbreak on the Diamond Princess cruise ship by Huang, et al. [75], or the epidemiological and modelling study of the COVID-19 transmission in train passengers by Hu et al. show no evidence of resuspension of the SARS-CoV-2 viruses due to the indoor airflows [76-80].
Conclusion
In this study, the effect of the indoor air circulation on the separation of a Coronavirus from surfaces was investigated. For this purpose, different configurations of the surface models with respect to the directions of airflows were considered. Regarding to the results, the following conclusions were made. In the case, where airflow applied perpendicularly on a flat plate, even for the highest applied velocity (10 ms-1), the separation of a Coronavirus is unlikely. The indoor parallel airflows to the flat surfaces have low potential to remove attached viruses in most of the conditions. In the case of the plane plates, at the edge of the plate, the applied shear is infinity due to the Blasius equation. At locations more than 4 nm away from the edge, even for the highest applied velocity (U=10 ms-1), the drag force applied on an isolated Coronavirus is less than the minimum adhesion force. In the case of the rough plates, at the edge of the plates, all of the modeled peaks are protruding out of the boundary layer. Therefore, the drag force was calculated on an isolated Coronavirus considering the freestream velocity. For three cases, where the free stream velocities were 0.1, 0.5 and 1 ms-1, the separation of a Coronavirus was unlikely. For two other cases, U=5 and 10 ms-1, the drag forces were 107.5 and 215 pN , respectively. Therefore, the viruses were vulnerable to removal. In the regions, a few micrometers away from the edge of the plate, where the peak of a rough model stood in the boundary layer, the applied drag forces were negligible for all the rough models except for U=5 and 10 ms-1. In the case of U= 10 ms-1 applied on the wooden-surface; the possibility of the virus movement was high since the minimum drag force in the domain of 1 cm from the edge was more than 100 pN .
For plane surface of a cylinder, the calculated drag forces were less than 1 pN for all applied velocities; therefore, the separation of an isolated Coronavirus was extremely unlikely. In the case of the airflow over the rough circular cylinders, most of the calculated drag forces were less than 40 pN, except for U= 10ms-1) applied on the wooden-rough model at ϕ=50°, which was 55.75 pN . Therefore, the separation of a Coronavirus from a rough cylindrical surface is very unlikely. Overall, it is very unlikely that typical indoor airflows could remove Coronavirus from different surfaces. The separation of viruses may take place at very high air velocities (e.g. 5 and 10 ms-1), at locations such as edges of flat plates or at specific angles with respect to the horizontal plane (ϕ=50°) on cylindrical surfaces.
References
- (2019) WHO Situation Report, 2020a. Coronavirus disease 2019 (COVID-19) (No. 78).
- Huang C, Wang Y, Li X, Ren L, Zhao J, et al. (2020) Clinical features of patients infected with 2019 novel coronavirus in Wuhan, China. The Lancet 395(10223): 497-506.
- Li Q, Guan X, Wu P, Wang X, Zhou L, et al. (2020) Early Transmission Dynamics in Wuhan, China, of Novel Coronavirus–Infected Pneumonia. N Engl J Med 382: 1199-1207.
- Liu J, Liao X, Qian S, Yuan J, Wang F, et al. (2020) Community Transmission of Severe Acute Respiratory Syndrome Coronavirus 2, Shenzhen, China, 2020 - Volume 26, Number 6—June 2020 - Emerging Infectious Diseases journal - CDC.
- Van Doremalen N, Bushmaker T, Morris DH, Holbrook MG, Gamble A, et al. (2020) Aerosol and Surface Stability of SARS-CoV-2 as Compared with SARS-CoV-1. N Engl J Med 382: 1564-1567.
- (2020) World Health Organization. transmission of SARS-CoV-2: implications for infection prevention precautions: No. WHO/2019-nCoV/ Sci_Brief/ Transmission_modes/ 2020.3.
- Liu Z, Zhuang W, Hu L, Rong R, Li J, et al. (2020) Experimental and numerical study of potential infection risks from exposure to bioaerosols in one BSL-3 laboratory. Build Environ 179: 106991.
- Lu J, Gu J, Li K, Xu C, Su W, et al. (2020) COVID-19 Outbreak Associated with Air Conditioning in Restaurant, Guangzhou, China, 2020 - Volume 26, Number 7—July 2020 - Emerging Infectious Diseases journal - CDC.
- Park SY, Kim YM, Yi S, Lee S, Na BJ, et al. (2020) Coronavirus Disease Outbreak in Call Center, South Korea - Volume 26(8)—August 2020 - Emerging Infectious Diseases journal - CDC.
- Barker J, Stevens D, Bloomfield SF (2001) Spread and prevention of some common viral infections in community facilities and domestic homes. J Appl Microbiol 91(1): 7-21.
- Hurst CJ, Gerba CP, Cech I (1980) Effects of environmental variables and soil characteristics on virus survival in soil. Appl Environ Microbiol 40(6): 1067-1079.
- Lacroix-Gueu P, Briandet R, Lévêque-Fort S, Bellon-Fontaine MN, Fontaine-Aupart MP, et al. (2005) In situ measurements of viral particles diffusion inside mucoid biofilms. France 24 & 25 mars 328(12): 1065-1072.
- Berger P, Zoller (1994) Ground Water Contamination and Control. Marcel Dekker, New York.
- Hjertén S (1976) Zone Electrophoresis, Isoelectric Focusing, and Displacement Electrophoresis (Isotachophoresis) in Carrier-Free Solution. In: Catsimpoolas N (Edt.)., Methods of Protein Separation, Biological Separations. Springer US, Boston, MA, pp: 219-231.
- Armanious A, Aeppli M, Jacak R, Refardt D, Sigstam T, et al. (2016) Viruses at Solid–Water Interfaces: A Systematic Assessment of Interactions Driving Adsorption. Environ Sci Technol 50(2): 732-743.
- Li L, Jia Z, Peng Y, Godar S, Getov I, et al. (2017) Forces and Disease: Electrostatic force differences caused by mutations in kinesin motor domains can distinguish between disease-causing and non-disease-causing mutations. Sci Rep 7: 8237.
- Li L, Wang L, Alexov E (2015) On the energy components governing molecular recognition in the framework of continuum approaches. Front Mol Biosci 2: 5.
- Siber A, Podgornik R (2007) Role of electrostatic interactions in the assembly of empty spherical viral capsids. Phys Rev E 76: 061906.
- Van der Schoot P, Bruinsma R (2005) Electrostatics and the assembly of an RNA virus. Phys Rev E Stat Nonlin Soft Matter Phys 71: 061928.
- Gerba CP (1984) Applied and Theoretical Aspects of Virus Adsorption to Surfaces. In: Laskin AI (Edt.)., Advances in Applied Microbiology. Academic Press 30: 133-168.
- Svoboda K, Block SM (1994) Biological applications of optical forces. Annu Rev Biophys Biomol Struct 23: 247-285.
- Israelachvili (2011) Intermolecular and Surface Forces (3rd).,
- Lee CK, Wang YM, Huang LS, Lin S (2007) Atomic force microscopy: determination of unbinding force, off rate and energy barrier for protein-ligand interaction. Micron Oxf Engl 38(5): 446-461.
- Wiegand T, Fratini M, Frey F, Yserentant K, Liu Y, et al. (2020) Forces during cellular uptake of viruses and nanoparticles at the ventral side. Nat Commun 11: 32.
- Florin EL, Moy VT, Gaub HE (1994) Adhesion forces between individual ligand-receptor pairs. Science 264(5157): 415-417.
- Moy VT, Florin EL, Gaub HE (1994) Intermolecular forces and energies between ligands and receptors. Science 266: 257-259.
- Seah I, Su X, Lingam G (2020) Revisiting the dangers of the coronavirus in the ophthalmology practice. Eye 34: 1155-1157.
- Dimmock NJ, Easton AJ, Leppard KN (2007) Introduction to modern virology (6th)., ed. Blackwell Pub, Malden, MA.
- Fields BN (2007) Principles of Virology (5th)., Wolters Kluwer, New York.
- Kendall K, Kendall M, Rehfeldt F (2011) Cell, Virus and Nanoparticle Adhesion: Significance and Future. In: Kendall K, Kendall M, Rehfeldt F (Eds.)., Adhesion of Cells, Viruses and Nanoparticles. Springer Netherlands, Dordrecht, pp. 265-275.
- Deng X, Gong G (2021) Investigation of exhaled pollutant distribution in the breathing microenvironment in a displacement ventilated room with indoor air stability conditions. J Environ Sci China 99: 336-345.
- Deng X, Gong G, Chen S, He X, Ou Y, et al. (2021) Assessment of personal exposure to infectious contaminant under the effect of indoor air stability. Environ Sci Pollut Res 28: 39322-39332.
- Deng X, Gong G (2020) Comparison of Mixing and Displacement Ventilation under Limited Space Air Stability Conditions in a Space Capsule. Microgravity Sci Technol 32: 749-759.
- Mei X, Gong G (2018) Predicting airborne particle deposition by a modified Markov chain model for fast estimation of potential contaminant spread. Atmos Environ 185: 137-146.
- Ahmadzadeh M, Farokhi E, Shams M (2021a) Investigating the effect of air conditioning on the distribution and transmission of COVID-19 virus particles. J Clean Prod 316: 128147.
- Kohanski MA, Lo LJ, Waring MS (2020) Review of indoor aerosol generation, transport, and control in the context of COVID-19. Int Forum Allergy Rhinol 10(10): 1173-1179.
- Ahmadzadeh M, Farokhi E, Shams M (2021b) Investigating the effect of air conditioning on the distribution and transmission of COVID-19 virus particles. J Clean Prod 316: 128147.
- Miguel AF, Reis AH, Aydin M (2004) Aerosol particle deposition and distribution in bifurcating ventilation ducts. J Hazard Mater 116(3): 249-255.
- Tsai R, Lin ZY (1999) An approach for evaluating aerosol particle deposition from a natural convection flow onto a vertical flat plate. J Hazard Mater 69(2): 217-227.
- Zhang H, Ahmadi G (2000) Aerosol particle transport and deposition in vertical and horizontal turbulent duct flows. J Fluid Mech 406: 55-80.
- Zhao B, Wu J (2007). Particle deposition in indoor environments: Analysis of influencing factors. J Hazard Mater 147(1-2): 439-448.
- K Lai AC, Nazaroff WW (2000) Modeling Indoor Particle Deposition from Turbulent Flow onto Smooth Surfaces. J Aerosol Sci 31(4): 463-476.
- Zhang Z, Chen Q (2009) Prediction of particle deposition onto indoor surfaces by CFD with a modified Lagrangian method. Atmos Environ 43(2): 319-328.
- Zhao B, Wu J (2009) Effect of particle spatial distribution on particle deposition in ventilation rooms. J Hazard Mater 170(1): 449-456.
- White FM (2006a) Viscous fluid flow, 3rd ed. McGraw-Hill, New York, p. 46, 241: 269- 432.
- (2019) ANSI/ASHRAE Standard 62.2.2019Ventilation and Acceptable Indoor Air Quality in Residential Buildings.
- A S H R A E H (2020) Chapter 21. Duct design, in: HVAC Systems and Equipment.
- Gong N, Tham KW, Melikov AK, Wyon DP, Sekhar SC, et al. (2006) The Acceptable Air Velocity Range for Local Air Movement in The Tropics. HVACR Res 12(4): 1065-1076.
- Durst F (2008) Fluid Mechanics: An Introduction to the Theory of Fluid Flows. Springer-Verlag, Berlin Heidelberg.
- Hopf L (1923) The measurement of hydraulic roughness. Math Mech 3: 329-339.
- Suresh L, Walz JY (1996) Effect of Surface Roughness on the Interaction Energy between a Colloidal Sphere and a Flat Plate. J Colloid Interface Sci 183(1): 199-213.
- Perry AE, Schofield WH, Joubert PN (1969) Rough wall turbulent boundary layers. J Fluid Mech 37(2): 383-413.
- Hadjiconstantinou NG (2006) The limits of Navier-Stokes theory and kinetic extensions for describing small-scale gaseous hydrodynamics. Phys Fluids 18(11): 111301.
- Tsuda A, Henry FS, Butler JP (2013) Particle transport and deposition: basic physics of particle kinetics. Compr Physiol 3(4): 1437-1471.
- Cunningham E, Larmor J (1910) On the velocity of steady fall of spherical particles through fluid medium. Proc R Soc Lond Ser Contain. Pap Math Phys Character 83: 357-365.
- Davies CN (1945) Definitive equations for the fluid resistance of spheres. Proc Phys Soc 57: 259-270.
- Millikan RA (1923) Coefficients of Slip in Gases and the Law of Reflection of Molecules from the Surfaces of Solids and Liquids. Phys Rev 21: 217-238.
- Prokopovich P, Starov V (2011) Adhesion models: From single to multiple asperity contacts. Adv Colloid Interface Sci Surface forces and thin liquid films 168(1-2): 210-222.
- Ibrahim AH, Dunn PF, Qazi MF (2008) Experiments and validation of a model for microparticle detachment from a surface by turbulent air flow. J Aerosol Sci 39(8): 645-656.
- Jiang Y, Matsusaka S, Masuda H, Qian Y (2008) Characterizing the effect of substrate surface roughness on particle–wall interaction with the airflow method. Powder Technol 186(3): 199-205.
- Mukai C, Siegel JA, Novoselac A (2009) Impact of Airflow Characteristics on Particle Resuspension from Indoor Surfaces. Aerosol Sci Technol 43(10): 1022-1032.
- Soltani M, Ahmadi G (1995) Direct numerical simulation of particle entrainment in turbulent channel flow. Phys Fluids 7(3): 647-657.
- Corn M, Stein F (1965) Re-entrainment of Particles from a Plane Surface. Am Ind Hyg Assoc J 26(4): 325-336.
- Kim Y, Gidwani A, Wyslouzil B, Sohn C (2010) Source term models for fine particle resuspension from indoor surfaces. Building and Environment 45(8): 1854-1865.
- Hubbe MA (1985) Detachment of colloidal hydrous oxide spheres from flat solids exposed to flow 2. Mechanism of release. Colloids Surf 16(3-4): 249-270.
- Goldasteh I, Ahmadi G, Ferro AR (2013) Wind tunnel study and numerical simulation of dust particle resuspension from indoor surfaces in turbulent flows. J Adhes Sci Technol 27(14): 1563-1579.
- Boor BE, Siegel JA, Novoselac A (2013) Monolayer and Multilayer Particle Deposits on Hard Surfaces: Literature Review and Implications for Particle Resuspension in the Indoor Environment. Aerosol Sci Technol 47: 831-847.
- (2020) SARS-CoV-2 is transmitted by exposure to infectious respiratory fluids. CDC Last viewed:11/15/2020.
- Fehr AR, Perlman S (2015) Coronaviruses: an overview of their replication and pathogenesis. Methods Mol Biol Clifton NJ 1282: 1-23.
- G Ziskind (2006) Particle Resuspension from Surfaces: Revisited and Re-Evaluated. Rev Chem Eng 22: 1-123.
- Henry C, Minier JP (2014) Progress in particle resuspension from rough surfaces by turbulent flows. Prog. Energy Combust. Sci 45: 1-53.
- Hjertén S (1973) Some general aspects of hydrophobic interaction chromatography. J Chromatogr 87(2): 325-331.
- Hu M, Lin H, Wang J, Xu C, Tatem AJ, et al. (2021) Risk of Coronavirus Disease 2019 Transmission in Train Passengers: an Epidemiological and Modeling Study. Clin. Infect. Dis Off Publ Infect Dis Soc Am 72(4): 604-610.
- Huang LS, Li L, Dunn L, He M (2021) Taking account of asymptomatic infections: A modeling study of the COVID-19 outbreak on the Diamond Princess cruise ship. PLOS ONE 16: e0248273.
- Khatib AN, Carvalho AM, Primavesi R, To K, Poirier V, et al. (2020) Navigating the risks of flying during COVID-19: a review for safe air travel. J Travel Med 27, taaa212.
- ROHDE R (2020) Novel coronavirus lab protocols and responses.
- Song ZG, Chen YM, Wu F, Xu L, Wang BF, et al. (2020) Identifying the Risk of SARS-CoV-2 Infection and Environmental Monitoring in Airborne Infectious Isolation Rooms (AIIRs). Virol Sin 35: 785-792.
- Speake H, Phillips A, Chong T, Sikazwe C, Levy A, et al. (2020) Flight-Associated Transmission of Severe Acute Respiratory Syndrome Coronavirus 2 Corroborated by Whole-Genome Sequencing - Volume 26, Number 12—December 2020 - Emerging Infectious Diseases journal - CDC.
- (2019) WHO Situation Report, 2020b. Coronavirus disease 2019 (COVID-19) (No. 78).
- Xu P, Qian H, Miao T, Yen HL, Tan H, Kang M, et al. (2020) Transmission routes of Covid-19 virus in the Diamond Princess Cruise ship.
