 Research Article
Abstract
Background: Coronary CT Angiography (CCTA) is an established noninvasive
method to evaluate coronary stenosis. Whether it could provide additional information
about acute myocardial infarction has critically important implications for clinical
management.
Objective: To investigate the ability of coronary spectral CT angiography (S-CCTA)
for the assessment of myocardial infarction.
Methods: An occlusion-reperfusion mini-pig model of acute myocardial infarction
was used. S-CCTA was performed to evaluate acute myocardial infarction 4±1 days later.
The CT value, iodine concentration, and spectral curve were measured or calculated in
infarcted myocardium (referred to Triphenyl Tetrazolium Chloride (TTC) stain), risk
area (the adjacent segments of infarction) and remote myocardium. The infarcted
myocardial segments on S-CCTA and TTC stain were visually assessed and compared
by Kappa test. Diagnostic ability of S-CCTA to differentiate infarcted segments was
tested by receiver operating characteristic curve. In addition, iodine concentration and
TUNEL stain was analyzed and correlated in mini-pigs with no-reflow phenomenon.
Results: Finally, successful model establishment, S-CCTA and histological
examination underwent in 9 mini-pigs. Significant differences of density were found
among infarction, risk area and remote myocardium (p<0.05), especially on 70keV
images with higher signal to noise ratio and contrast to noise ratio. The S-CCTA and
TTC stain had good agreement (κ=0.821) in infarct segment differentiation. The iodine
concentration and cardiomyocyte apoptosis were both statistically significant among
no-reflow region, infarction and remote myocardium. There was significant inverse
correlation between iodine concentration and cardiomyocyte apoptosis (r2=0.879,
p<0.001).
Conclusion: The S-CCTA could be used to assess acute myocardial infarction,
especially for monochromatic 70keV images. The iodine quantification on S-CCTA may
add valuable information for myocardial infarction in the future.
Keywords: Spectral CT; Myocardial Infarction; Coronary CT Angiography; TUNEL Stain
Abbreviations: MI: Myocardial Infarction; ECG: Electrocardiography; CCTA: Coronary CT Angiography; S-CCTA: Coronary Spectral CT Angiography; IC: Iodine Concentration; PCI: Percutaneous Coronary Intervention; LAD: Left Anterior Descending Artery; ROI: Region of Interest; CNR: Contrast to Noise Ratio; SNR: Signal to Noise Ratio; TTC: Triphenyl Tetrazolium Chloride; TUNEL: Terminal Deoxynucleotidyl Transferase-Mediated dUTP Nick-End Labeling; ANOVA: One- Way Analysis of Variance; LSD: Least Significant Difference; ROC: Receiver Operating Characteristic
Introduction
Acute Myocardial Infarction (MI) is one of the major causes
of morbidity and mortality in western countries [1]. Noninvasive
imaging for MI detection, patient risk stratification and treatment
monitoring is needed especially when Electrocardiography (ECG)
and myocardial enzyme with no clinical clue. Multidetector CT has
been used for heart morphology and coronary stenosis evaluation
for many decades [2,3]. However, even mild coronary stenosis
could not always exclude vessel-specific myocardial ischemia [4].
In addition, additional contrast material and radiation exposure
limit the use of CT perfusion to evaluate myocardium [5]. In clinical
practice, comprehensive evaluation of coronary artery stenosis
and myocardial perfusion in one examination is desirable [6]. The
advent of dual energy spectral CT has sparked renewed interest
in clinical applications for many organs [7-10]. The strength
of monochromatic energy image in improving image quality at
optimal keV and increasing Contrast to Noise Ratio (CNR) at high
keV was outlined; [11,12] the iodine density image was highlighted
for the capability to quantify Iodine Concentration (IC) [11,13].
Consequently, our study aims to evaluate the myocardial infarction
by Coronary Spectral CT Angiography (S-CCTA) based on the
advantages mentioned above to discuss its strength, potential and
limitations. The purpose of the current study was in three folds:
1. To investigate whether S-CCTA could assess MI
2. To define the best parameters of S-CCTA for MI delineation
3. To discuss the correlation between myocardial IC and
cardiomyocyte apoptosis.
Methods
Experimental Protocol
Twelve Chinese mini pigs (5 males; weight, 20.23 ±1.23 kg; age, 6.0±0.7 months) underwent Percutaneous Coronary Intervention (PCI) to produce acute ischemia/reperfusion MI model by balloon dilatation. In compliance with the NIH guidelines for the use of laboratory animal, these mini pigs received human care. After premedication with ketamine (20 mg/kg), Xylazine Hydrochloride (1.5mg/kg) and atropine (0.02mg/kg), the pigs were intubated, anesthetized and mechanically ventilated with an admixture of 2.5%-3.5% sevoflurane and 100% oxygen. Baseline heart rate, ECG, and weight of animals were acquired before modeling. Before PCI, heparin was administered at an initial dose of 10,000IU intravenously, followed by additional 4,000IU/h to maintain anticoagulation throughout the PCI procedure [14]. The angioplasty balloon was positioned in the Left Anterior Descending Artery (LAD) just distal to the first diagonal artery. Acute MI was confirmed by ECG. After 90-minutes occlusion, the angioplasty balloon was drawn back.
Spectral CT
After 4±1 days of MI model establishment, the pigs underwent S-CCTA. Induced anesthesia was the same as above during PCI. Anesthesia was maintained by intravenous disoprofol (5mg/ kg/h). Respirator was used to help and control the breathing. All pigs underwent S-CCTA on a single-source dual energy spectral CT (Discovery CT750 HD CT Freedom Edition scanner, GE Healthcare, USA). The parameters were as following: Gemstone spectral imaging mode with fast peak tube voltage switching between 80 and 140 kVp during a single rotation, axial plane with 64 × 0.625 mm collimation, 350-msec gantry rotation time, 175-msec x-ray exposure time. All pigs received 1.5 ml/kg contrast material (Ultravist 370, Bayer Schering Pharma, Germany) followed by 30 ml saline at a flow rate of 3.0ml/s. Bolus tracking with a Region of Interest (ROI) was placed in ascending aorta and was used to synchronize the arrival of contrast material to start the image acquisition (trigger threshold of 120 HU). The radiation dose was recorded.
S-CCTA Images Processing
The monochromatic S-CCTA images were reconstructed in standard short axial plane with slice thickness of 2.00 mm. The density of infarction area (referred to the myocardium in tan or white color on TTC stain mentioned later), remote myocardium (myocardium in an unaffected coronary artery territory, usually the inferior wall) and the noise were measured. Identical ROIs on S-CCTA images of different energy were adopted by adjusting monochromatic energy from 40keV to 140 keV at a 5keV interval. The optimal keV was chosen based on the CNR, signal to noise ratio (SNR) and noise.
CNR = (HUremote – HUinfarct) / noise
SNR = HUinfarct / noise.
Where H Uremote represented the mean CT value of remote
myocardium, and HUinfarct indicated the mean CT value of
infarction. The noise was derived from the standard deviation of CT
value in the remote myocardium.
In addition, the mean CT value of infarction area, risk area (the
adjacent segments of infarction) and remote myocardium was
recorded respectively to observe the density change from 40keV to
140 keV at a 5keV interval (spectral curve).
The optimal keV and iodine density images of S-CCTA were
reconstructed in short axis. Thereafter, the CT value and IC
were measured in the infarction region, risk area and remote
myocardium of each pig. To maintain the consistency of the size,
shape and position of ROIs among different CT images, the ROIs
were automatically copied by the software and adjusted slightly by hand if necessary. Images were assessed in consensus by two
experienced readers (A and B, with 5 and 11 years of experience
in CCTA, respectively). For infarction observation, the CNR and
SNR were calculated as mentioned above. Finally, objects with noreflow
phenomenon at late enhancement imaging were recorded.
The IC in no-reflow region (persistent hypo-enhancement on late
enhancement images), infarction and remote myocardium was
measured on S-CCTA.
Histopathology
At the conclusion of radiologic examinations, the animals were euthanized with overdose vecuronium bromide. The hearts were sliced into short axises of about 4mm and incubated in the triphenyl tetrazolium chloride (TTC) (1mg/100ml) at a temperature of 37℃ by water bath. Remote normal myocardium was delineated as the living tissue and is colored with red, while the infarcted tissue is colored in pale tan. With consideration of S-CCTA images and gross specimen, serial cutting sections in the no-reflow region, infarction and remote myocardium were used for immunofluorescent staining. Terminal deoxynucleotidyl transferase-mediated dUTP Nick-End Labeling (TUNEL) stain of myocardium was used to observe cardiomyocyte apoptosis. The TUNEL positive nuclei were counted by image analysis system “Image-Pro Plus Version 6.0”. The mean values of positive nuclei count/area were recorded [15].
Infarcted Segment Evaluation of S-CCTA and TTC Stain
MI of all the 17 segments according to standardized myocardial segmentation was evaluated by the two points scoring systems. (15) S-CCTA image analysis was performed by using dedicate visual evaluation on optimal energy images. For S-CCTA, score 0 indicated no hypo-perfusion, score 1 represented hypo-perfusion observed. For TTC stain, myocardium in tan color was classified as infarction (score 1) and viable myocardium in red color was regard as score 0 (Figure 1) [16].
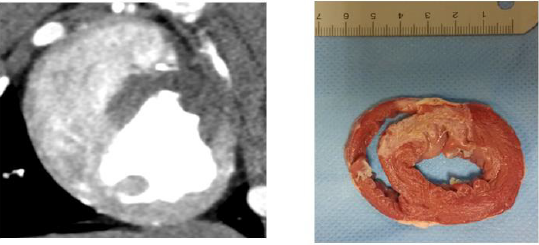
Figure 1: Both S-CCTA
A. TTC Stain
B. Showed myocardial infarction (the 7th and 8th segments).
Statistical Analysis
The differences among or between groups were compared by using one-way Analysis of Variance (ANOVA) and Least Significant Difference (LSD) test or t test. The spectral curve of different regions was fitted by the best regression model on curve estimation provided by PASW. Accordingly, the value of slope was derived from the preferred curve. For comparing among different regions, the value of slope underwent logarithmic transformation [17]. The categorical inter-method agreement between S-CCTA and TTC stain was calculated by using the Cohen κ [16]. Receiver Operating Characteristic (ROC) curve was used to investigate the ability of S-CCTA on differentiating infarcted myocardial segments taking the TTC stain as gold standard. The correlation between IC and cardiomyocyte apoptosis of no-reflow region, infarction and remote myocardium was tested by Pearson correlation analysis. P<0.05 was considered statistically significant.
Results
Acute MI models were performed in 12 pigs. However, 2 of them died of ventricular fibrillation soon after PCI, 1 of them died during the S-CCTA examination. Finally, 9 Chinese mini-pigs (6 females; weight, 20.17±1.35kg; age, 5.3±0.6months) were included in current study. The heart rate during S-CCTA was 87±6 per minute. The radiation dose of S-CCTA was about 18.45mGy (CTDI), 193.70- 258.27 mGy.cm (DLP).
Spectral Curve
As the monochromatic energy increase from 40keV to 140keV, the CT value steadily decreased in remote myocardium, risk area and infarction (396.08~58.01HU, 61.30~344.62HU, and 86.80~36.90HU, respectively) (Figure 2). Significant differences of CT value among three regions at 40keV were observed (ps≤0.001). The exponential regression model was optimal for the spectral curve after comparison by curve estimation.16 The logarithmic transformed slopes of remote myocardium, risk area and infarct myocardium were 5.06±0.26, 4.71±0.27 and 2.78±1.03 respectively. Significant difference was detected among them (ps<0.001) (Figure 2).
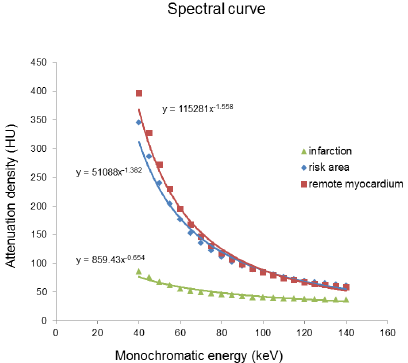
Figure 2: The spectral curve of the mean attenuation density in the remote myocardium, risk area and infarction myocardium.
CT Value or IC Differences
The CT value or IC difference among infarction, risk area and remote myocardium was shown in Table 1 (ps<0.05).
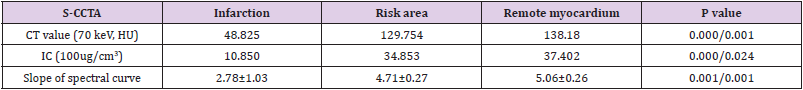
Table 1: The CT Value, IC or slope of spectral curve difference among Infarction, Risk Area and Remote Myocardium.
Optimal Kev Setting for Differentiation
The scatterplot showed that 70keV ~75keV were the optimal monochromatic energies to observe infarction region on S-CCTA with higher CNR, SNR and lower noise (Figure 3). 70keV was chosen as the optimal monochromatic energy in our study for the following measurement and comparison. The 70 keV multiplanar reconstruction images could be overlaid with iodine density images; it could provide intuitionistic observation for the location and margin of MI (Figure 4).
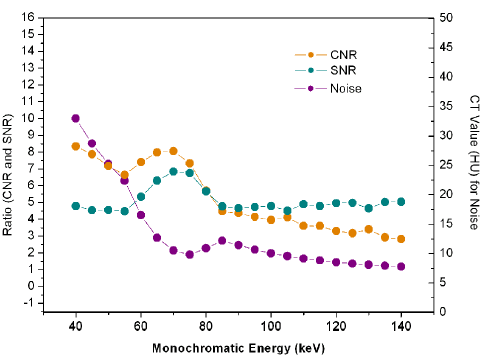
Figure 3: The CNR, SNR and noise change from 40keV to 140keV.
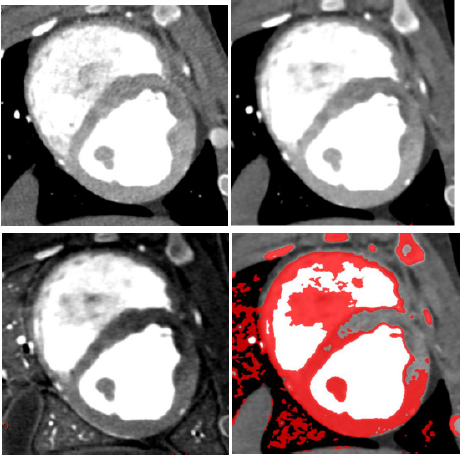
Figure 4: A 7-month female pig with acute MI. The anterior and anterior septal hypo-perfusion was demonstrated in A. High voltage B. 70keV C. Iodine density D. 70keV overlay with iodine density images. D depicted the hypo-perfusion more clearly.
Diagnostic Ability of S-CCTA to Differentiate Infarct Segments
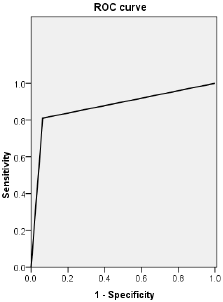
Figure 5: ROC curve of CT value obtained by S-CCTA to distinguish infarct segments from normal myocardial segments confirmed by TTC stain.
Categorical inter-method agreement between S-CCTA and TTC stain was almost perfect (κ= 0.821, 95%CI=0.729~0.913, p<0.001). 53 of 153 segments (34.64%) were considered as infarction on S-CCTA, compared with 64 segments (41.83 %) that were confirmed as infarcted on TTC stain (Table 2). ROC curve showed high diagnostic accuracy of S-CCTA to differentiate myocardial infarct segments (sensitivity, 0.813; specificity, 0.989; positive predictive value, 0.981; negative predictive value, 0.880 and accuracy, 0.901, p<0.001) (Figure 5).
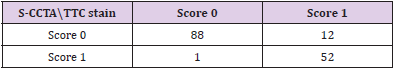
Table 2: Inter-method agreement between S-CCTA and TTC stain.
Correlation Between IC and Apoptosis
The ICs of no-reflow region, infarction and remote myocardium were (1043±282) ug/cm3, (1867±344) ug/cm3, and (3507±331) ug/cm3 respectively. There were significant differences among them (p<0.001). The mean number of apoptosis cells in no-reflow region, infarction and remote myocardium were (2661±231)/mm2, (2270±241)/mm2 and (74±41) /mm2 respectively (Figure 6). There was significant difference among them (p<0.001). A significant inverse correlation was found between IC and cardiomyocyte apoptosis (r2=0.879, p<0.001).
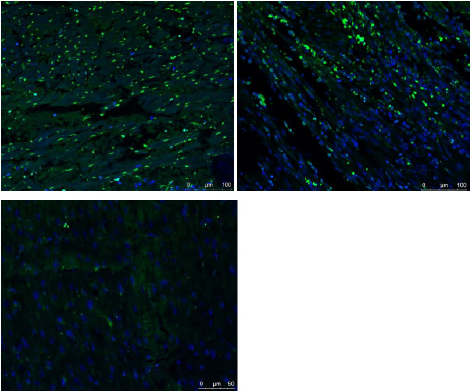
Figure 6: Fused images of TUNEL stain and DAPI stain.
A. There were few normal cells (blue cell: indicated cells with normal double-stranded DNA) but a lot of cardiomyocyte
apoptosis in the no-reflow region
B. There were abundant of apoptosis cells and normal cells in the infarction area.
C. A large number of normal cells but few apoptosis cells were detected in the remote myocardium.
Discussion
S-CCTA for Myocardial Infarction Assessment
The spectral CT may improve its ability to differentiate myocardial infarction from remote myocardium. This may be due to three following factors: its high CNR of higher photon energy (70keV) images, its higher photon energy (140keV) images and its ability to alleviate of beam hardening artifacts [8,11]. Previous studies have similar results with our study no matter for the myocardial perfusion or delayed enhancement [18,19] The 70keV images was selected as optimal monochromatic image to evaluate acute myocardial infarction due to with high CNR, SNR and low noise. And previous study also confirmed that The CT value of 70keV monochromatic image was similar to those of 120kVp CT images with lower noise [12,20].
IC and Cardiomyocyte Apoptosis
TUNEL stain aims to detect apoptotic cell and necrotic cell
[21,22]. Apoptosis, necrosis and, possibly, autophagy determined
the ultimate number of viable cardiomyocytes following MI
[23,24]. Persistent ischemia without reperfusion eventually causes
cardiomyocytes to die by a necrotic pathway. While, following
myocardial ischemia/reperfusion, apoptosis is one of the major
pathways that lead to the process of cell death [25]. In the current
study, we correlated the IC of myocardium with TUNEL stain to
investigate the capability of spectral CT to assess MI. The results
showed that both the IC calculated on S-CCTA and cardiomyocyte
apoptosis measured by TUNEL stain could differentiate no-reflow
region from infarction or remote myocardium. Furthermore,
the myocardial IC on S-CCTA correlated with the TUNEL stain
of apoptosis cell in acute MI mini-pig models. Cardiomyocyte
is permanent cell, no cardiomyocyte apoptosis detected in the
normal heart. Previous study confirmed this point [26]. However,
few apoptotic cells were found in the remote myocardium in our
study which is probably caused by the overall ischemia situation.
Significant difference of the number of cardiomyocyte apoptosis in
no-reflow region and infarction area was detected.
No-reflow phenomenon reflects severe reperfusion injury.
Ischemia/reperfusion injury (no-reflow phenomenon) initiates a
wide and complex array of inflammatory responses that aggravate
local injury [27-29]. It explains why apoptotic and necrotic
cells was much more prominent in no-reflow region compared
with infarction area without no-reflow phenomenon. The IC
calculated on S-CCTA images reflected the myocardial perfusion
and distribution of blood flow. Following ischemia/reperfusion,
the higher the myocardial perfusion, the fewer the apoptotic and
necrotic cells induced. This may be responsible for that the IC had
a negative correlation with the TUNEL stain of apoptosis cell in
acute MI. The iodine quantification on S-CCTA may add valuable
information for risk stratification in the future.
Limitations
There were some limitations in the current study. First, the number of pigs enrolled was relatively small and with similar habitus, further study is necessary to determine whether our results are applicable to patients with larger and various figures. Second, this model only investigates early hypo perfused myocardial infarctions and the results cannot be extrapolated to later time points of infarct healing. Finally, for the mandatory use of prospective triggering and high heart rate of the pigs, we did not conduct the analysis including coronary artery stenosis and stress myocardial perfusion assessment.
Conclusion
S-CCTA could assess MI by CT value on 70keV images, IC and spectral curve. In addition, IC calculated on S-CCTA may indirectly reflect myocardial damage which could potentially add valuable information for risk stratification in the future.
Acknowledgment
This study was supported by grants from the National Natural Science Foundation of China (81800214,81873888,81301217), Natural Science Foundation of Anhui Province (1808085QH236). The authors thank Dr. Haoran Sun, Zheng Wan, Fengtan Li, Xu Lang, Qiang Jia, Jiaojiao Li, Qingqing Lu, Huiting Liu, Wenjia Zhang, Jian Yin for their important contributions.
Conflict of Interest
None.
References
- White HD, Chew DP (2008) Acute myocardial infarction. Lancet 372(9638): 570-584.
- Shaw LJ, Hausleiter J, Achenbach S, Al Mallah M, Berman DS, et al. (2012) Coronary computed tomographic angiography as a gatekeeper to invasive diagnostic and surgical procedures: results from the multicenter CONFIRM (Coronary CT Angiography Evaluation for Clinical Outcomes: an International Multicenter) registry. J Am Coll Cardiol 60(20): 2103-2014.
- Nasis A, Mottram PM, Cameron JD, Seneviratne SK (2013) Current and evolving clinical applications of multidetector cardiac CT in assessment of structural heart disease. Radiology 267(1): 11-25.
- Norgaard BL, Hansson NC, Christiansen EH, Kaltoft A, Botker HE, et al. (2015) A "normal" invasive coronary angiogram may not be normal. J Cardiovasc Comput Tomogr 9(4): 264-266.
- Nieman K, Balla S (2020) Dynamic CT myocardial perfusion imaging. J Cardiovasc Comput Tomogr 14(4): 303-306.
- Magalhaes TA, Kishi S, George RT, Arbab Zadeh A, Vavere AL, et al. (2015) Combined coronary angiography and myocardial perfusion by computed tomography in the identification of flow-limiting stenosis The CORE320 study: An integrated analysis of CT coronary angiography and myocardial perfusion. J Cardiovasc Comput Tomogr 9(5): 438-445.
- Kikano EG, Rajdev M, Salem KZ, Laukamp K, Felice CD, et al. (2020) Utility of Iodine Density Perfusion Maps From Dual-Energy Spectral Detector CT in Evaluating Cardiothoracic Conditions: A Primer for the Radiologist. AJR Am J Roentgenol 214(4): 775-785.
- Machida H, Tanaka I, Fukui R, Shen Y, Ishikawa T, et al. (2016) Dual-Energy Spectral CT: Various Clinical Vascular Applications. Radiographics 36(4): 1215-1232.
- Adam SZ, Rabinowich A, Kessner R, Blachar A (2021) Spectral CT of the abdomen: Where are we now? Insights Imaging 12(1): 138.
- Li WX, Miao F, Xu XQ, Zhang J, Wu ZY, et al. (2021) Pancreatic Neuroendocrine Neoplasms: CT Spectral Imaging in Grading. Acad Radiol 28(2): 208-216.
- Silva AC, Morse BG, Hara AK, Paden RG, Hongo N, et al. (2011) Dual-energy (spectral) CT:applications in abdominal imaging. Radiographics 31(4): 1031-1046.
- Matsumoto K, Jinzaki M, Tanami Y, Ueno A, Yamada M, et al. (2011) Virtual monochromatic spectral imaging with fast kilovoltage switching: improved image quality as compared with that obtained with conventional 120-kVp CT. Radiology 259(1): 257-262.
- Kaza RK, Platt JF, Cohan RH, Caoili EM, Al Hawary MM, et al. (2012) Dual-energy CT with single- and dual-source scanners: current applications in evaluating the genitourinary tract. Radiographics 32(2): 353-369.
- Zhang Z, Takarada S, Molloi S (2011) Quantification of coronary microvascular resistance using angiographic images for volumetric blood flow measurement: in vivo Am J Physiol Heart Circ Physiol 300(6): H2096-2104.
- Cerqueira MD, Weissman NJ, Dilsizian V, Jacobs AK, Kaul S, et al. (2002) Standardized myocardial segmentation and nomenclature for tomographic imaging of the heart. A statement for healthcare professionals from the Cardiac Imaging Committee of the Council on Clinical Cardiology of the American Heart Association. Circulation 105(4): 539-542.
- Nensa F, Poeppel TD, Beiderwellen K, Schelhorn J, Mahabadi AA, et al. (2013) Hybrid PET/MR imaging of the heart: feasibility and initial results. Radiology 268(2): 366-373.
- Packard GC, Boardman TJ (2008) Model selection and logarithmic transformation in allometric analysis. Physiol Biochem Zool 81(4): 496-507.
- Fahmi R, Eck BL, Levi J, Fares A, Dhanantwari A, et al. (2016) Quantitative myocardial perfusion imaging in a porcine ischemia model using a prototype spectral detector CT system. Phys Med Biol 61(6): 2407-2431.
- Rodriguez Granillo GA, Campisi R, Deviggiano A, de Munain MNL, Zan M, et al. (2017) Detection of Myocardial Infarction Using Delayed Enhancement Dual-Energy CT in Stable Patients. AJR Am J Roentgenol. 209(5): 1023-1032.
- Pessis E, Campagna R, Sverzut JM, Bach F, Rodallec M, et al. (2013) Virtual monochromatic spectral imaging with fast kilovoltage switching: reduction of metal artifacts at CT. Radiographics 33(2): 573-583.
- Luo G, Jian Z, Zhu Y, Zhu Y, Chen B, et al. (2019) Sirt1 promotes autophagy and inhibits apoptosis to protect cardiomyocytes from hypoxic stress. Int J Mol Med 43(5): 2033-2043.
- Yu SY, Dong B, Fang ZF, Hu XQ, Tang L, et al. (2018) Knockdown of lncRNA AK139328 alleviates myocardial ischaemia/reperfusion injury in diabetic mice via modulating miR-204-3p and inhibiting autophagy. J Cell Mol Med 22(10): 4886-4898.
- Kang PM, Izumo S (2003) Apoptosis in heart: basic mechanisms and implications in cardiovascular diseases. Trends Mol Med 9(4): 177-182.
- Kim NH, Kang PM (2010) Apoptosis in cardiovascular diseases: mechanism and clinical implications. Korean Circ J 40(7): 299-305.
- Zhao ZQ (2004) Oxidative stress-elicited myocardial apoptosis during reperfusion. Curr Opin Pharmacol 4(2): 159-165.
- Sharov VG, Sabbah HN, Shimoyama H, Goussev AV, Lesch M, et al. (1996) Evidence of cardiocyte apoptosis in myocardium of dogs with chronic heart failure. Am J Pathol 148(1): 141-149.
- Dorweiler B, Pruefer D, Andrasi TB, Maksan SM, Schmiedt W, et al. (2007) Ischemia-Reperfusion Injury: Pathophysiology and Clinical Implications. Eur J Trauma Emerg Surg 33(6): 600-612.
- Caiazzo G, Musci RL, Frediani L, Uminska J, Wanha W, et al. (2020) State of the Art: No-Reflow Phenomenon. Cardiol Clin 38(4): 563-573.
- Allencherril J, Jneid H, Atar D, Alam M, Levine G, et al. (2019) Pathophysiology, Diagnosis, and Management of the No-Reflow Phenomenon. Cardiovasc Drugs Ther 33(5): 589-597.
