 Research Article
Abstract
A simple, rapid, precise, sensitive, economical, robust and QbD based RP -HPLC method has been developed for Naftidrofuryl oxalate and validated as per ICH guidelines. The response surface methodology employed with a 3-factor, 3- level Box-Behnken statistical design and used to facilitate method development and optimization. The response surface methodology and multiple response optimizations utilizing a polynomial equation were used to select suitable mobile phase combination. The independent variables studied were the Organic phase (X1), Aqueous phase(X2) and (X3) and the responses was Retention time (Y1), Resolution (Y2) and Tailing factor (Y3). Chromatographic separation was achieved on Zodiac C18 column (100mm×4.6, 3μm),using optimized mobile phase Acetonitrile and pH-7 Tetrabutyl-ammonium buffer solution (90:10), at 282nm. The flow rate and injection volume were 1.0 mL-1 min and 20 μL, respectively. Analysis of variance (ANOVA) confirmed that the three factors were significant. The method was validated for linearity, system suitability, recovery (accuracy), precision, robustness, ruggedness, limit of quantitation (LOD) and detection (LOQ) as per the ICH guidelines. The precision, ruggedness and robustness values were also within the prescribed limits. Calibrations curves were linear (r2= 0.997) at the concentration range of 10 to 50μg/mL. LOD and LOQ values were 12.914μg/mL and 39.132μg/mL respectively. The proposed method was successfully developed by applying QBD based concept and proposed method can be used for routine analysis of Naftidrofuryl oxalate in quality control laboratories.
Keywords: Naftidrofuryl Oxalate; Box-Behnken Design; RP-HPLC Method Development; Validation
Introduction
Naftidrofuryl, chemically it is a (RS)-2-(diethylamino) ethyl-3-
(1-naphthyl)- 2-(tetrahydro furan-2-ylmethyl) propanoate and it is
available in the form of oxalic acid. It is also known as nafronyl, INN,
NF, NAFTI or as the oxalate salt nafronyl oxalate [1]. The chemical
formula of Naftidrofuryl oxalate is (C26H35NO7) with molecular
weight is 473.56 as shown in Figure 1 [2]. Naftidrofuryl oxalate
shows smooth muscle relaxation, increases cerebral blood flow
as well as peripheral blood flow, cerebral adenosine triphosphate
concentrations and glucose utilization properties attracts its
pharmacological applications in the treatment of senile brain
diseases a vasodilator. Therefore, it is widely used in the treatment
of peripheral and cerebral vascular disorders [3,4].
The British Pharmacopoeia (BP) describes a potentiometric
non-aqueous titration and high-performance liquid
chromatography (HPLC) methods for the assay of NF in bulk
form and capsules, respectively [5,6]. The literature survey
reveals that few analytical methods have been reported for the
determination of Naftidrofuryl oxalate in biological fluids and/or pharmaceutical preparations by using high-performance liquid
chromatography [7], high- performance liquid chromatography
with fluorescence detection [8,9], RP-HPLC fluorimetry [10],
phosphorimetry [11], phosphorescence [12,13], Phosphorimetric
determination [14], ion-selective membrane electrodes method
[15], spectrophotometric analysis [16], Spectrophotometric,
spectrofluorimetric and voltammetric analysis [17] and Stability
Indicating Methods [18] were reported till date. Naftidrofuryl
oxalate molecule,is composed with the ester linkage associates
naphtha- lene propionic acid and diethylaminoethyl moieties
and easily hydrolysis in aqueous solutions by either acid-or basecatalyzed
reaction to form 3-(1-naphthyl)-2-tetrahydro furfuryl
propionic acid, (Naftidrofurylacid, NFA) and diethylaminoethanol.
Figure 2 shows the degradation reaction pathway of Naftidrofuryl
oxalate. NFA is the metabolite of naftidrofuryl oxalate has been
found in human plasma [4,19].
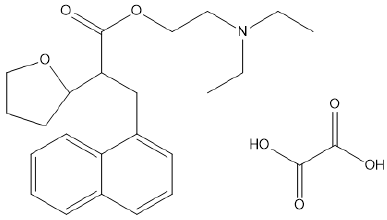
Figure 1: Structure of Naftriduroyl Oxalate.
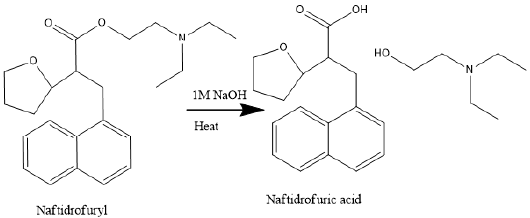
Figure 2: Hydrolysis rection of Naftidrofuryl.
It is desirable to develop a simple, precise, robust and fast
procedure that could be applied in quality control laboratories
for the selective determination of Naftidrofuryl oxalate in the
pharmaceutical product. The developed method can be utilized
for the determination of drug content in its pharmaceutical dosage
form is also demonstrated. For this we select QbD based RP-HPLC
method development. In a olden days, one factor at a time (OFAT)
and keeping the others fixed as a traditional approach used for
optimization of HPLC methods, results in achievement of narrow
robust, precise and rugged behavior of the method for instrumental
variables used in method development phase. This approach may
cause high risk in method failure and always requires revalidation
protocol after method transfer or alternative method development
used to ensure the consequences; thereby it has been increasing
the cost of the method, regulatory burden, recall of drugs and batch
failure cost [20,21].
Nowadays, QbD is used as a systematic, scientifically
based, holistic and proactive approach and powerful tool for
chromatographic method development. In this approach we can
understand process parameters that influence chromatographic
separation by determination of critical ones, their positive or
negative effect on the selected responses, and the multidimensional
interaction between them. In addition, the change in variable of
QbD facilitates the purposeful variables changes will gives desired
response and suggests the optimal solution with variables value
that best gives the maximum, minimum or target response, while at
the same time it finds the spot with the minimum error transmitted to the responses. So, this should represent robust process
conditions that not affected by slight variations in factor settings. It
also suggests a mathematical model that relates the response and
the experimental variables, thus allowing response prediction with
minimum error transmitted to the response [22-26].
Application of DoE principles facilitates understanding of
multiple method parameters and variables that tend to affect CMAs,
while unravelling the prevalence of (any) interactions and reducing
intricacies. For the successful execution of DoE study, the knowledge
of response variables or CMAs, CMVs, their ranges, and best fitting
of the mathematical model(s) is mandatory. DoE-based Response
Surface Methodology (RSM) is helpful in systematic development
of analytical methods involving significant nonlinearity between
CMV-CMA relationship(s) using diverse experimental designs like
Factorial design, Central Composite design, Box Behnken design,
Optimal design, etc. The experimental designs help in mapping
the responses on the basis of the studied objective(s), CMAs being
explored, at high (coded as +1), medium (coded as 0), or low
(coded as -1) levels of CMVs. It tends to unearth the mechanistic
understanding of CMVs and CMAs relationship, and associated
interactions among them. Various 3D and 2D-plots like response
surface plots, contour plots, perturbation charts, linear correlation
plots, outlier plot and Box-Cox plot are some of the key pictorial/
graphical tools of the experimental designs useful for the purpose
[27,31].
The literature survey reveals that the BBD was one of the
design strategies employed for selection and optimization of
mobile phase during chromatographic analysis. The BBD is
different from all screening designs as it contains combinations
or midpoints of edges of the process space and at the center, i.e.,
variables at their highest or lowest levels, so that the designs will
avoid all factors which affects method. These designs are useful
in avoiding experiments performed under extreme conditions as
these may give unsatisfactory results [32-34]. In the RSM design,
Box–Behnken statistical design is an independent, rotatable or
nearly rotatable, quadratic design, requires fewer experimental
runs and less time and thus provides a far more effective and costeffective
technique than the conventional processes of formulating
and optimization of dosage forms [35].
Literature survey revealed that there is no previously reported
analytical QbD based RP- HPLC method for NF. Thus, the main goal
of this work was to establish a precise, accurate and sensitive QbD
based RP-HPLC method for NF using RSM and Multiple responses
optimization utilizing quadratic polynomial equation. Screening
of the critical factors was achieved using BBD, the independent
variables for the present study was Organic phase (X1), Aqueous
phase(X2) and (X3) and the responses was Retention time (Y1),
Resolution (Y2) and Tailing factor (Y3). The developed method
was validated for linearity, system suitability, recovery (accuracy),
precision, robustness, ruggedness, limits of quantitation (LOD) and
detection (LOQ) as per the ICH guidelines [36,37].
Experimental
Materials
Naftidrofuryl oxalate was obtained as a gift sample from
Zim Lab, Nagpur, India. All the chemicals such as Methanol and
Acetonitrile (HPLC grade), Ammonium acetate, Tetra butyl
ammonium hydroxide and Concentrated Nitric acid (AR grade),
procured from Merk life science private limited Mumbai and Final
limited Ahemdabad.
Instrumentation and Chromatographic Conditions: HPLC
analysis was carried out using Shimadzu HPLC series 1100.
Separation was carried out on Zodiac column (C18 100mm×4.6 I.D.,
3μm particle size column), Detection was achieved using SPD-10UV
detector and LC 10 ADVP-pumps connected to a hp computer. The
mobile phase was prepared by mixing Tetrabutyl- ammonium buffer
and Acetonitrile (adjusted to pH7 with concentrated Nitric acid) in
a ratio of 10:90 v/v, then filtered through 0.45μm membrane filter
(Millipore, Milford, MA, USA). The injection volume was 20μL with a
flow rate of 1.0mL/min and UV detection at 282nm. The wavelength
of maximum absorbance was detected by UV-Visible spectrometer
(double beam), Shimadzu UV-1700 model and wavelength scanning
range was 200-400nm was exercised using UV probe software. For
applying quality by design Design Expert® 11.0 – trial version
software was used.
Preparation of Standard Solutions: A stock solution of 1000
μg/mL was prepared by dissolving 10mg of Naftidrofuryl oxalate
standard in 10mL of a mixture Tetrabutyl- ammonium buffer and
Acetonitrile (adjusted to pH7 with Concentrated Nitric acid) in a
ratio of 10:90 v/v. Standard solutions were prepared by further
dilution of stock solution with the same solvent to get 30 μg/mL.
Experimental Design
Scouting Step: This step included some trials of the mobile
phase that gives an acceptable well resolved chromatographic peak
of analyte. At the beginning, different mobile phases containing
Tetrabutyl ammonium buffer and Acetonitrile as the aqueous/
organic part of the mobile phase were tried. In addition, change in
ratio of Tetrabutyl- ammonium buffer and Acetonitrile were tested.
Finally, the variables that may affect the selected CQA were selected.
Screening Design: In the present study, 3-factor, 3-level Box-
Behnken statistical design was used to evaluate the effect of selected
responses, to characterize the drug contents and to optimize the
developed method. BBD is efficacious for exploration of quadratic response surfaces, mathematical screening and thus helping to
optimize the process by using a small number of experimental
runs. The dependent and independent variables selected are given
Table 1 along with their low, medium and high levels, which were
selected based on the results from preliminary experimentation.
The observed responses are given in Table 2.

Table 1: Variables in Box Behnken Design.

Table 2: The observed responses in Box-Behnken Design for Naftidrofuryl Oxalate.
Note: *Variables X=Organic phase (X1), Aqueous phase(X2) and Flow rate (X3). Responses Y= Retention Time (Y1), Resolution (Y2) and Tailing factor (Y3).
BBD a also used to optimize and evaluate the main effects, interaction effects and quadratic effects of the independent factors on the dependent factors as 3-factor, 3-level Box- Behnken statistical design suitable for exploring quadratic response surfaces and constructing second order polynomial model with Design Expert® 11.0 – Trial Version software. The nonlinear computer-generated quadratic model is given as

where Yo is the dependent variable; bo is an intercept; b1–b33 are
regression coefficients computed from the observed experimental
values of Y; and X1–X3 are the coded levels of independent variables.
The terms X1, X2 and Xi(i=1,2or3) represent the interaction and
quadratic terms, respectively
Optimization Data Analysis: The responses Retention Time
(Y1), Resolution (Y2) and Tailing factor (Y3) of were treated by
Design-Expert software design such as BBD which consist of three
components include linear, quadratic and special cubic models.
The best fitting mathematical model such as ANOVA method and
Good fit evaluation were selected based on the comparisons of
several statistical parameters including the coefficient of variation
(C.V.), the multiple correlation coefficient (R2), adjusted multiple
correlation coefficient (adjusted R2); and the predicted residual
sum of square (PRESS), proved by Design-Expert software. Among
them, PRESS indicates how well the model fits the data, and for
the chosen model it should be small relative to the other models
under consideration.Also various 3-D response surface graphs
and counter plots were provided by the Design- Expert software. By intensive grid search performed over the whole experimental
region, the optimum checkpoint mobile phase composition was
selected to validate the chosen experimental domain and polynomial
equations. The optimized checkpoint mobile phase composition
was prepared and evaluated for various response properties. The
resultant experimental values of the responses were quantitatively
compared with that of the predicted values. Also, linear regression
plots between actual and predicted values of the responses were
produced using MS- Excel version 2019.
Validation: The method was validated in accordance with the
International Conference on Harmonization (ICH) requirements
[37], which involved linearity, system suitability, recovery
(accuracy), precision, robustness, ruggedness, limits of quantitation
(LOD) and detection (LOQ).
Linearity, LOD, and LOQ: The linearity of the method was
assessed at five concentrations within the appropriate range.
To construct the calibration curves the peak areas were plotted
against concentrations. For an analyte in a sample, LOD is the
lowest concentration which can be detected, not quantified. On the
other hand, LOQ is the lowest concentration was calculated.
System Suitability: The system suitability parameters area,
retention time, tailing factor, theoretical plates and resolution were
calculated by injecting standard Naftidrofuryl oxalate solution.
Accuracy: The accuracy of the proposed method was indicated
by % recovery of the five different concentrations of Naftidrofuryl
oxalate.
Robustness: In addition to identifying the design space that
represents a robustness zone, the insensitivity of the proposed
method to small changes in the optimized conditions such as
deliberate changes in the method were done i.e., Change in flow rate
(1.0 ± 0.2mL/min), change in mobile phase concentration (organic
portion of 90% ± 5%), change in column and change in pH of Buffer
solution (7.0± 0.2 pH) in mobile phase.
Ruggedness: The studies were carried out for two different
parameters i.e., Days (Intraday and Interday) and Analyst to Analyst
variation. Single concentration level was selected and analyzed
as described before three times within the same day (intra-day
precision) by different analysts, and on successive three days
(inter-day precision). The % RSD was calculated as a measure for
method precision.
Results and Discussion
Scouting Step
An isocratic mobile phase consisting of Tetrabutyl- ammonium buffer 20% and acetonitrile 80% was applied at the beginning. This mobile phase gave strong tailing and no well resolved peak shape. When % of Tetrabutyl- ammonium buffer was increased and % of acetonitrile reduced, tailing increased strongly. Then we reduced % of tetrabutyl-ammonium buffer and % of acetonitrile increased in order to have better resolution. In this case, good peaks shape was obtained. In this step, three factors were chosen: the % aqueous part of the mobile phase, % of organic phase and flow rate.
Screening with BBD
The significance of model so obtained can be evaluated by two ways i.e. ANOVA method and Good fit evaluation. ANOVA is a statistical method based on F-test to estimate the significance of model. It involves subdividing total variation into variation due to Residual error, Main effects and Interactions.
ANOVA Technique
The ANOVA (one-way Analysis of Variance) is used to ensure about the significant differences between the means of three or more independent groups. The results of ANOVA of Variance for Retention time (Y1), Resolution (Y2) and Tailing factor (Y3) shown in Table 3. The Model F-value of Retention time (Y1), Resolution (Y2) and Tailing factor (Y3) was found to be 16.69, 10.72 and 7.11 respectively and it implies that the model is significant. There is only a 0.01% chance that an F-value this large could occur due to noise. P-values less than 0.0500 indicate model terms such as -A, C, AC in Retention time(Y1), - A, B, A², B², C² in Resolution (Y2) and -A², B², C² in Tailing factor (Y3) are significant model terms. Values greater than 0.1000 indicate the model terms are not significant. If there are many insignificant model terms.The Lack of Fit F-value of 66.01 and 32.46 in Retention time (Y1) and Tailing factor (Y3) respectively implies that the Lack of Fit is significant. Whereas in the Resolution (Y2), Lack of Fit F-value of 3.02 implies the Lack of Fit is not significant relative to the pure error. There is a 15.69% chance that a Lack of Fit F-value this large could occur due to noise. The average values obtained from the software are given in Table 4.
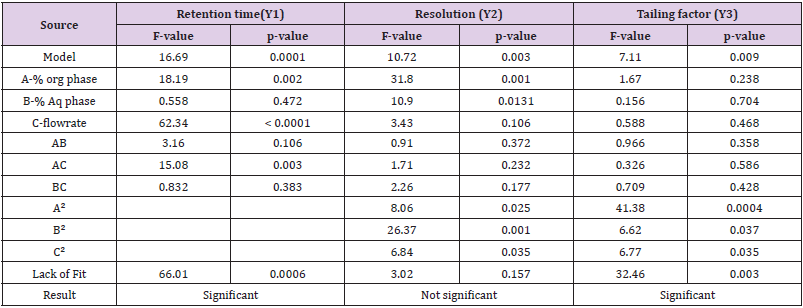
Table 3: ANOVA results of the Box Behnken design for response surface quadratic model.
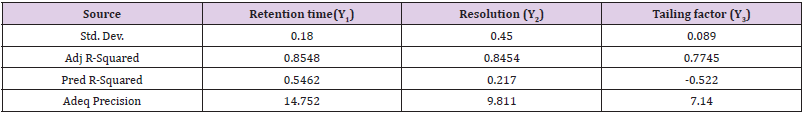
Table 4: Table for average values obtained from the software.
Main Effects (Lack of Fit)
The Lack of Fit is one of the components of partition of the sum of squares in an ANOVA which can tell that that purpose model is fit or not. The results of Lack of Fit Test and Model Summary Statistics of Retention time (Y1), Resolution (Y2) and Tailing factor (Y3) showed in Table 5.
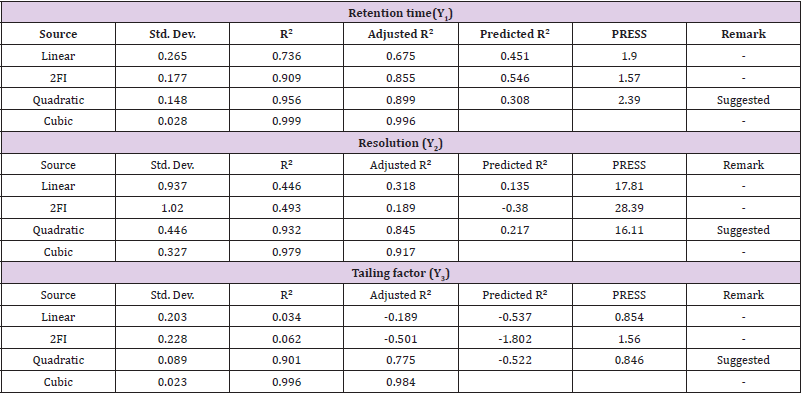
Table 5: Model Summary Statistics for Lack of Fit Test.
Interactions
The equation in terms of actual factors can be used to make predictions about the response for given levels of each factors are given in Table 6.
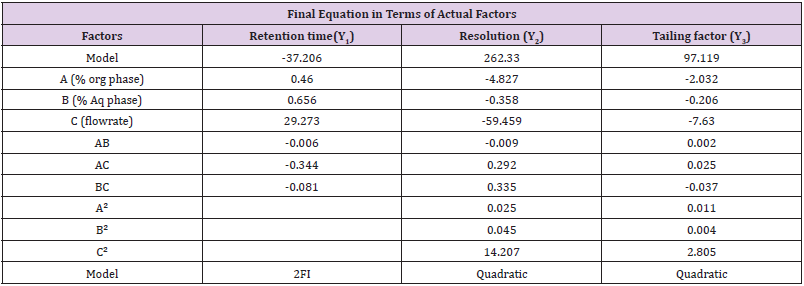
Table 6: Table for final Equation in Terms of Actual Factors.
Contour Plots and Response Surface Analysis
The graphical optimization was another tool used to specify the design space or sweet spot where the desired CQAs meet. The goal of graphical optimization was to maximize both responses after speci- fying their lowest acceptable limits. 3D plot showed the interaction effect of the critical factors. Two-dimensional contour plot of Retention time (Y1), Resolution (Y2) and Tailing factor (Y3) shown in Figures 3a-3c and three- dimensional response surface plot are presented in Figures 4a-4c which is very useful to study the interaction effects of the factors on the responses. These types of plots show the effects of two factors on the response at a time.
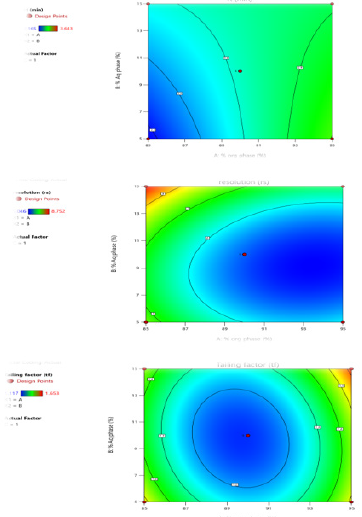
Figure 3:
a. Counter Plot for Response Retention Time.
b. Counter Plot for Response Resolution.
c. Counter Plot for Response Tailing factor.
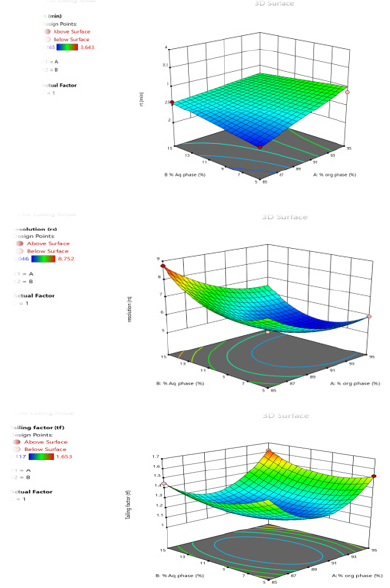
Figure 4:
a. Surface Response Curve for Response Retention Time.
b. Surface Response Curve for Response Resolution.
c. Surface Response Curve for Response Tailing factor.
Validation
Linearity, LOD, and LOQ
Linearity study was performed on Naftidrofuryl oxalate under the optimized chromatographic conditions; a good linearity was obtained between the peak areas and the concentration ranging from 10 to 50μg/mL. The observations are shown in Table 7, from the data, a plot concentration (μg/mL) Vs Area Under Curve (AUC) was constructed for the Naftidrofuryl oxalate (Figure 5). The study of graphical plots represents correlation coefficient of Naftidrofuryl oxalate was found to be 0.997.
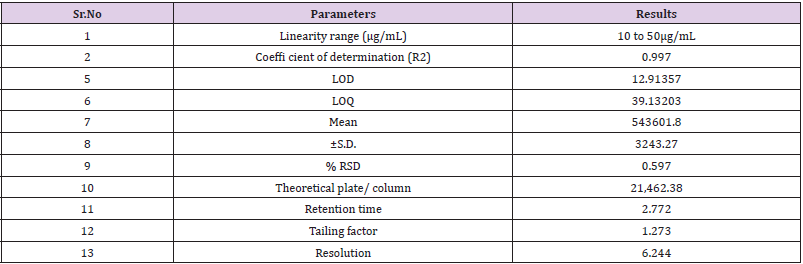
Table 7: Regression data and System suitability data.
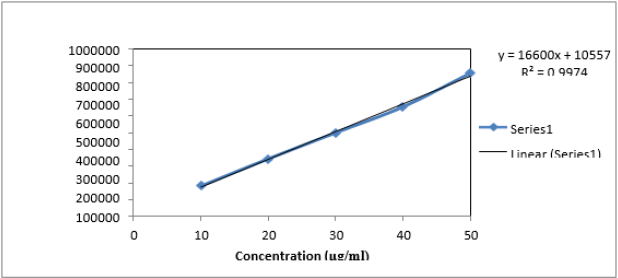
Figure 5: Plot of Linearity Curve.
System Suitability
The study of chromatogram reveals that the Naftidrofuryl oxalate was well resolved hence, resolution of the same needs to be studied. The system suitability was performed by preparing the 30 μg/mL solution of standard Naftidrofuryl oxalate performed under optimized condition. From the observation of results, all the obtained results are in under the acceptance limit. Hence, according to acceptance criteria the system is suitable for analysis. The results for system suitability parameters are given in Table 7 and standard chromatogram is given in Figure 6. The correlation coefficient was found to be 0.997 for the drug.
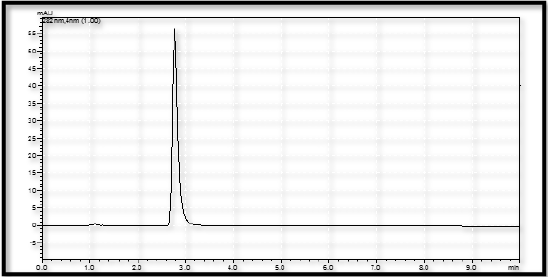
Figure 6: Chromatogram of Std NF.
Accuracy
Accuracy of proposed method was as certain on the basis of recovery studies performed by standard addition method. Percent Recovery was performed by preparing the 30 μg/mL solution of Standard Naftidrofuryl Oxalate. The ±S. D and % RSD was calculated and the results for % Recovery is given in Table 8.
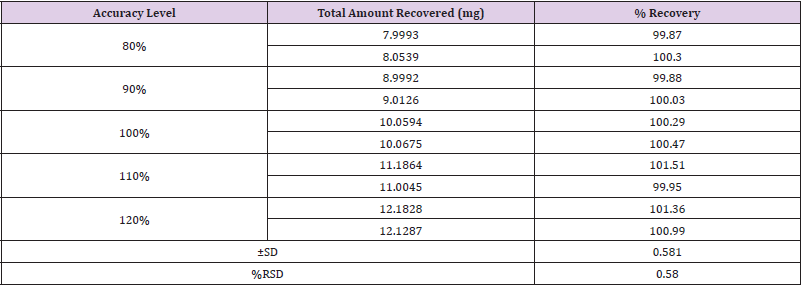
Table 8: Observation and Results of Recovery Study.
Robustness
In these study deliberate changes in the method were done i.e. Change in flow rate (1.0 ± 0.2mL/min), change in mobile phase concentration (organic portion of 90% ± 5%), Change in column (Agilent ZORBAX and ZODIAC) and change in pH of Buffer solution (7.0 ± 0.2 pH) in mobile phase. The robustness results Mean, SD and %RSD of series of measurement were found to be within limit as shown in Table 9.
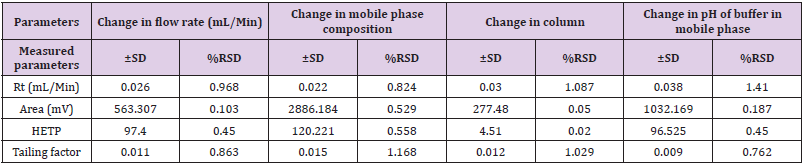
Table 9: Table for summary data of Robustness results.
Ruggedness
The studies were carried out for two different parameters i.e., Days (Intraday and Interday) and Analyst to Analyst variation. In intraday and inter-day variations, results of estimation by proposed methods were found to be varying. In inter-day study% RSD and % estimation was found to be increased after one day storage suggest that the NF is unstable in solution form while in intraday study, solution was found to be stable up to 3 h. The result of estimation for Naftidrofuryl oxalate by different analysts was very much reproducible. This indicates the ruggedness of the method in the hands of different analysts. The results of Ruggedness study for the proposed method is given in Table 10.
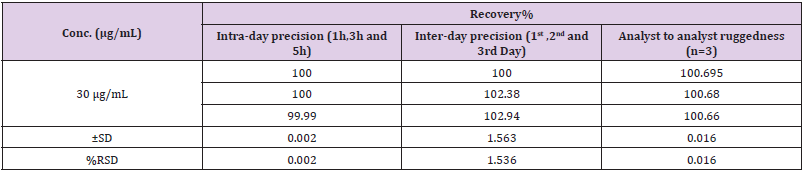
Table 10: Results of Ruggedness study for the proposed method.
Conclusion
A validated QbD based RP-HPLC method has been developed for Naftidrofuryl oxalate utilizing “Analytical Quality by Design” (AQbD)- DOE approach. Multivariate regression analysis was successfully applied to study the main effects of three factors on the of retention time, resolution and tailing factor. BBD was employed for optimization of chromatographic conditions and used to analyse the analytical target profile by studying the interaction and quadratic effects on the factors for three selected responses. The models used for screening and optimization steps were found to be significant and confirmed method predictability. The developed method was validated for linearity, accuracy, robustness of test method, ruggedness, intermediate precision, recovery study, LOD and LOQ. The method is simple, robust, accurate and can be successfully applied to the analysis of Naftidrofuryl oxalate.
Conflict of Interest
No conflict of interest with any institution/organization.
References
- El-Sayed MA (2013) The use of calixarene as ionophores in potentiometric ion-selective electrodes of naftidrofuryl oxalate using microsized membrane sensors for kinetic study of naftidrofuryl (NFT) degradation. European Journal of Chemistry 4:124-131.
- (2009) British Pharmacopoeia (14th )., Her Majesty’s Stationary office, London on behalf of MHRA, Vol. I&II, London, UK, 373.
- Khorshid AF (2014) Chemically Modified Carbon Sensors Mixed or Single for the determination of Cardiovascular Drug Nafronyl Oxalate in Bulk, Praxilene and Human Fluids. J Biosens Bioelectron 5(153): 2.
- Garrett ER, Barbhaiya R (1981) Prediction of Stability in Pharmaceutical Preparations XVIII: Application of High‐Pressure Liquid Chromatographic Assays to Study of Nafronyl Stability and Bioanalysis. Journal of Pharmaceutical Sciences 70: 39-45.
- Gordillo AR (1999) Lucha contra el dopaje como objetivo de salud. Adicciones 11(4): 299-310.
- (1998) British Pharmacopoeia. Her Majesty’s stationary office. London, UK 1: 2011416.
- Waaler PJ, Mueller BW (1992) Solid-phase extraction of naftidofuryl from human plasma for high-performance liquid chromatography analysis. Int J Pharm 87: 223.
- Walmsley LM Brodie RR, Chasseaud LF (1985) Note Determination of naftidrofuryl in human plasma by high-performance liquid chromatography with fluorescence detection. Journal of Chromatography: Biomedical Science and Applications 338: 433-437.
- Brodie RR, Chasseaud LF, Taylor T, Hunter JO, Ciclitira PJ (1979) Determination of naftidrofuryl in the plasma of humans by high- performance liquid chromatography. J Chromatogr Biomed Appl 164: 534.
- Yu C, Zhang H, Hong Y, Cui G, Xia F (1997) RP-HPLC fluorimetry of naftidrofuryl in serum. Zhongguo Yiyao Gongye Zazhi 28: 311.
- Beyer KH, Hildebrand M (1982) Naftidrofuryl (Dusodril) Possible uses of gas chromatography and high-pressure liquid chromatography for analysis. Deutsche Apotheker Zeitun 122: 1709.
- Cruces-Blanco C, Segura Carretero A, Fernandez Sanchez JF, Fernandez Gutierrez A (2000) Facile and selective determination of the cerebral vasodilator nafronyl in a commercial formulation by heavy atom induced room temperature phosphorimetry. J Pharm Biomed Anal 23: 845.
- Munoz de la Pena A, Espinosa Mansilla A, Murillo Pulgarin JA, Alanon Molina A, Fernandez Lopez P (1998) Determination of nafronyl in pharmaceutical preparations by means of stopped-flow micellar- stabilized room temperature phosphorescence. Analyst 123: 2285
- Segura Carretero A, Cruces Blanco C, Canabate B, Diaz JF, Fernandez Sanchez A Fernandez Gutierrez (2000) Heavy-atom induced room-temperature phosphorescence: A straightforward methodology for the determination of organic compounds in solution. Anal Chim Act 417: 19.
- Murillo Pulgarin JA, Alanon Molina A, Fernandez Lopez P (1999) Phosphorimetric determination of nafronyl in pharmaceutical preparations. Anal Chim Acta 382: 77.
- Ionescu MS, Badea V, Baiulescu GE, Cosofret VV (1986) Nafronyl ion- selective membrane electrodes and their use in pharmaceutical analysis. Talanta 33: 101.
- Belal TS, Barary MH, Sabry SM, Ibrahim MEA (2009) Kinetic spectropho- tometric analysis of naftidrofuryl oxalate and vincamine in pharmaceutical preparations using alkaline potassium permanganate. J Food Drug Anal 17: 415.
- Sabry SM, Belal TS, Barary MH, Ibrahim MEA (2009) Spectrophotometric, spectrofluorimetric and voltammetric analyses of naftidrofuryl oxalate in its tablets. Int J Biomed Sci 5: 283.
- Abbas SS, Zaazaa HE, El-Ghobashy MR, Fayez YM, Fattah SA (2012) Stability Indicating Methods for Determination of Naftidrofuryl Oxalate: Analytical Chemistry An Indian Journal 11: 329-334.
- Garrett ER, Barbhaiya R (1981) Prediction of stability in pharmaceutical preparations XVIII: application of high-pressure liquid chromatographic assays to study of nafronyl stability and bioanalysis. J Pharm Sci 70: 39.
- Moffat AC, Osselton MD, Widdop B (2004) Clark’s Analysis of Drugs and Poisons (3rd)., The Pharmaceutical Press, London, UK, pp. 1311-1312.
- Alhakeem MA, Ghica MV, Pîrvu CD, Anuța V, Popa L (2019) Analytical Quality by Design with the Lifecycle Approach: A Modern Epitome for Analytical Method Development. Acta Medica Marisiensis 65: 37-44.
- Peraman R, Bhadraya K, Padmanabha Reddy Y (2015) Analytical quality by design: a tool for regulatory flexibility and robust analytics. International journal of Analytical Chemistry.
- Yadav NK, Raghuvanshi A, Sharma G, Beg S, Katare OP, et al. (2016) QbD-based development and validation of a stability-indicating HPLC method for estimating ketoprofen in bulk drug and proniosomal vesicular system. J Chromatogr Sci 54: 377-389.
- Garg NK, Sharma G, Singh B, Nirbhavane P, Katare OP (2015) Quality by design (QbD)-based development and optimization of a simple, robust RP-HPLC method for the estimation of methotrexate. J Liq Chromatogr Relat Technol 38: 1629-1637.
- Thakur D, Kaur A, Sharma S (2017) Application of QbD based approach in method development of RP-HPLC for simultaneous estimation of antidiabetic drugs in pharmaceutical dosage form. J Pharm Investig 47: 229-239.
- Bhusnure OG, Shinde NG, Gholve SB, Giram PS (2015) QbD approach for analytical method development of anti-pschotic drug, Pharm. Lett 7: 62-70.
- Elkhoudary MM, AbdelSalam RA, Hadad GM (2016) Development and optimization of HPLC analysis of metronidazole, diloxanide, spiramycin and cliquinol in pharmaceutical dosage forms using experimental design. J Chromatogr Sci 54: 1701-1712.
- Bhutani H, Kurmi M, Singh S, Beg S, Singh B (2017) Quality by design (QbD) in analytical sciences: an overview. Quality Assurance 46: 71-75.
- Ganorkar AV, Gupta KR. Analytical Quality by Design: A Mini Review. Biomedical Journal of Scientific & Technical Research 1(6): 1555-1559.
- Fukuda IM, Pinto CF, Moreira CD, Saviano AM, Lourenço FR (2018) Design of Experiments (DoE) applied to pharmaceutical and analytical Quality by Design (QbD). Brazilian Journal of Pharmaceutical Sciences 54(SPE).
- Rakic T, Kasagic-Vujanovic I, Jovanovic M, Jancic-Stojanovic B, Ivanovic D (2014) Comparison of full factorial design, central composite design, and box-behnken design in chromatographic method development for the determination of fluconazole and its impurities. Analytical letters 47(8): 1334-1347.
- Tak JW, Gupta B, Thapa RK, Woo KB, Kim SY, et al. (2017) Preparation and optimization of immediate release/sustained release bilayered tablets of loxoprofen using Box–Behnken design. AAPS Pharm SciTech 18: 1125-1134.
- Ganorkar SB, Shirkhedkar AA (2017) Design of experiments in liquid chromatography (HPLC) analysis of pharmaceuticals: Analytics, applications, implications and future prospects. Reviews in Analytical Chemistry 36: 1-43.
- Ferreira SC, Bruns RE, Ferreira HS, Matos GD, David JM, et al. (2007) Box-Behnken design: an alternative for the optimization of analytical methods. Analytica chimica acta 597: 179-186.
- Box GE, Behnken DW (1960) Some new three level designs for the study of quantitative variables. Technometrics 2: 455-475.
- (2007) Validation of compendial Procedures, United State Pharmacopoeia USP-NF 2007, Pharmacopoeial Convention Inc., General chapter 5: 1225.
