 Research Article
Abstract
Background: Poor air quality and its negative impact on health is currently one
of the civilizational problems in Poland. The aim of this study was an attempt to verify
and examine, on the basis of data on the number and causes of deaths registered in
Bielański Hospital in Warsaw, the increase in the number of deaths in Poland in January
2017 recorded by Statistics Poland [1].
Material And Methods: We analysed the data on the number and causes of deaths
in the hospital from 2013 to 2018 using the methods of searching for anomalies and
building models of the number of deaths depending on ambient temperature and air
pollution levels.
Results: We found that the increase in the number of deaths observed in the hospital
in January 2017 was caused by respiratory system-related deaths. A model utilizing air
temperature is not enough to explain the increase, but adding PM10 air pollution levels
to the temperature model was sufficient to achieve this. Such a model attributes 11.1 ±
4.1 of all deaths to air pollution, which is 8.3% of all considered deaths in January 2017.
Conclusions: Based on the hospital data, the analysis is in line with the findings of
Statistics Poland on the increased number of deaths in January 2017 and fully confirms
the opinions of specialists about the high level of harm caused by poor air quality. It
also indicates respiratory system complications as the main cause of the increase in the
number of deaths.
Keywords: Air Pollution; Cause of Death; Respiratory Tract Diseases; Smog
Abbreviations: NHF: National Health Fund; PM: particulate matter; HER: Electronic Health Records; GESD: Generalized Extreme Studentized Deviate; AIC: Akaike Information Criterion
Introduction
According to Statistics Poland (GUS) report for the first quarter
of 2017, about 13,3 thousand (13%) more deaths were registered
in this period than in the corresponding period of 2016 (Table 1)
[1]. This was confirmed and elaborated by data published by the
National Health Fund (NHF) in 2018 [2]. The analyses conducted
showed that in January 2017 the number of deaths in Poland
increased by 23.5% compared to January 2016 (number of deaths
in this analysis was corrected for age standardized death rate per
100,000 residents, relative to the structure of society in 2010). In
the discussed period, lower temperatures were recorded in Poland
than in the corresponding months of previous years, as well as
extremely high concentrations of PM10 particulate matter in most of the country, reaching an average of 80 μg/m3, were noticed [2].
Research in the United Kingdom, Germany, Spain, the United States
and Brazil showed that an average increase in particulate matter
of 10μg/m3 increases hospital visits by 1-4% and early all-cause
deaths by 0.5–1.5%, which are delayed by 1-2 days in relation to
unfavourable aero-sanitary conditions [3,4].
The later effects of such anomalies distributed over subsequent
years are quantitatively difficult to estimate. Based on conducted
research, it is also believed that in cities with high concentrations
of suspended particulates, the risk of death is 15-25% higher than
in cities with low particulate pollution [3]. A report by the WHO
(2002) states that 800,000 premature deaths of people per year are
caused by air pollution [4]. Recently Liu et al. showed that 10μg/m3
increase in mean particulate matter (PM) air concentration causes
a 0.44% higher short-term all-cause, a 0.36% higher cardiovascular
and 0.47% higher respiratory mortality [5]. Since January 2013, the
causes of in-hospital deaths have been analysed in the hospital [6].
The analysed data consists of thousands of patient cases in the form
of death records and their causes extracted from the Electronic
Health Records (EHR) database. The analyses showed an increase
in the number of deaths in January 2017 compared to previous
years (Table 1). This study allowed us to examine and compare the
association of PM10 air concentration and temperature with allcause,
cardiovascular and respiratory mortality in the hospital.
Material and Methods
Bielański Hospital is one of the largest multi-profile hospitals in
Warsaw with its own Emergency Department (ED) and about 600
beds, with approximately 100,000 patients hospitalized every year.
The analysed data consisted of cases of patient deaths of persons
who were admitted to the hospital between January 1, 2013 and
June 30, 2018. All medical patient data, including records indicating
the causes of death, are stored in the EHR database. Prior to the
analysis, all data used for this study were thoroughly anonymized
by the Information Technology department of the hospital, so that
no personal information was available to the data analysts from the
NCBJ. Moreover, all data processing was performed on a dedicated
server located inside the hospital. Between January 2013 and June
2018, 6783 death cases were recorded in the EHR of the hospital.
For the analysis, we considered only death cases that began as
emergencies, i.e. the patient was admitted resulting from a decision
made by ED personnel. This requirement was met by 95.7% of
cases. Air temperature data was obtained from the archive of
meteorological reports of the local, closest to the hospital, weather
station [7].
Air pollution data was retrieved from the Polish Chief
Inspectorate of Environmental Protection [8]. We used the daily
recorded PM10 averages from the measurements performed by the
two stations closest to the hospital (with distance to the hospital of
1 and 6.3 km). The reason we concentrated on PM10 levels and not
PM2.5 in our analysis is that only PM10 data were available with full
coverage for the period under study. For the sake of the analysis,
measurements from both stations were averaged for any given
day. In cases when only data from a single station were available,
this measurement was used instead of the average. There were no
analysed days for which data was missing simultaneously from
both stations.
Statistical Analysis
An analysis of the anomalies of the variable describing the
distribution of deaths over time was conducted on hospital data to
determine whether there was an increased number of deaths in the
hospital in January 2017 compared to January 2016, as was reported
in the nationwide data [1]. To assess the statistical significance of
this effect we performed an anomaly detection analysis using the anomalize R library [9]. For this analysis, we used the Seasonal
Decomposition of Time Series by Loess (STL) [10] algorithm for
decomposing the time series data representing the number of
deaths into the trend and seasonality, and the Generalized Extreme
Studentized Deviate Test (GESD) [11] for finding anomalies in the
remainders. In order to find a possible reason for the increase
indeed seen in the data, we used the registered initial cause of
death to try to identify which classes of ICD-10 codes contributed
significantly to the data of the 2016/2017 winter. Two classes of
causes of death were considered: respiratory and cardiovascular,
corresponding to Chapters X and IX of the ICD-10 classification.
Next, an identical analysis of the anomalies was also performed for
the variable describing the concentration level of PM10 particulates
in the air.
A cross-check analysis of the anomalies of the number of deaths
categorized by the above-mentioned causes was also performed
using permutation tests [12]. Next, a generalized linear model with
the response variable errors modelled with Poisson distribution
was constructed in an attempt to explain the confirmed number
of deaths by the ambient temperature, and then the results of this
model were compared with another linear model, in which apart
from ambient temperature, air pollution levels were also taken into
account.
Results
The results of this analysis are presented for all, respiratory and
cardiovascular classes defined above (Figures 1A-1C). The analysed
data allow to set a threshold of significance level of the anomaly
equal to 10-4, which is illustrated by the grey area in the presented
figures. The algorithm identifying anomalies found an excess
number of deaths caused by respiratory system diseases at the 10-4
significance level in January 2017, while no excess deaths at this
level of significance were noted for those relating to cardiovascular
causes. To try to find the reason for this excess of deaths caused
by respiratory system diseases, we looked at the registered PM10
air pollution data. We used the same algorithm with the same
parameters to search for anomalies in these data (Figure 1D). At
the 10–4 significance level, an anomaly was found in January 2017,
coinciding with the excess number of deaths caused by respiratory
system diseases. In order to gain a better understanding of the
anomalies detected with the STL/GESD algorithm, additional
verification was performed using permutation tests.
Observed number of deaths for each month was compared
to data from a similar period observed in the remaining years
over a 3-month window. In such approach January 2017 yet
again was considered the most anomalous month within the
respiratory-related category (with p-value = 0.000064). Moreover,
it was observed, that when considering all deaths excluding the
respiratory-related ones, January 2017, with p-value=0.154, can
by no means be considered anomalous. Therefore, we conclude
that the January 2017 excess was caused by respiratory systemrelated
deaths. As the next step of the analysis, we decided to
check the correlation of the number of deaths with the average
daily temperature as this is a well-known effect [3]. We wanted to
determine if this effect alone was enough to explain the presented
anomaly. In order to do so, a generalized linear model with the
response variable errors modelled with Poisson distribution was
constructed, linking average daily temperature to the observed
number of deaths on a given day.
For each considered case of death, the hospital admission date is
used, since time of death approach resulted in a significantly worse
data description. The model was constructed using the Maximum
Likelihood method and allowed us to calculate the monthly onesided
p-values. A low p-value indicates that the observed excess
in the number of deaths in a given month is inconsistent with the
obtained model, i.e. it should be considered anomalous. The lower
the obtained p-value for a given data point is, the more anomalous
it should be considered. In such approach, January 2017 is still the
most anomalous month, with a p-value of 0.014. Therefore, we
conclude that the average daily air temperature alone is not enough
to explain the excess of deaths in January 2017. The next step was
to consider the model utilizing both temperature and air pollution
as input variables. Because there is no known direct mechanism of
the impact of air pollution on the human body, the model included
the possibility of its interaction within a certain time interval, which
remained a free parameter of the model.
In addition, we decided to take into account the possibility
that air pollution affects the observed number of deaths only
after exceeding a daily threshold of 50 μg/m3, corresponding to
the threshold set by EU on daily PM10 mean [13]. Optimal input
variables transformations (e.g. window sizes) and models (i.e.
the variable sets) were selected using the grid search method and
Akaike Information Criterion (AIC) [14]. The best-performing model
(the final model) utilized the following variables: 5 days windowed
daily air temperature with 12 days of delay 8 days windowed PM10
air pollution average with a threshold of 50 μg/m3 applied after
calculating the windowed average The second-best model, utilizing
only the windowed temperature-based variable, was rejected, since
the Akaike probability that this model does in fact better describe
the data than the final model was only 0.077.
Monthly predictions of the average number of deaths obtained
with the final model are shown in Figure 2. The observed monthly
numbers of deaths are provided for comparison. It can be seen
that the predictions of the final model follow the observed values.
In the windowed temperature-only based model (i.e. the rejected,
second-best model), the p-value obtained for January 2017 (0.02)
stops being the most extreme, but is still small (i.e. this month
still could be considered anomalous with respect to this model).
On the contrary, the p-value obtained with the final model for
the same month (0.3) does not allow this month to be considered
anomalous any more. Therefore, we conclude that the excess of
deaths observed in January 2017 is explained by the observed air
temperature and excessive air pollution levels. As the final result,
we present the monthly estimated numbers of deaths caused by
air pollution (Figure 3). In order to calculate the values shown,
the difference was determined between the final model-obtained
values presented in Figure 2 and the final model predictions, when
applied to the input data with the air pollution-related values
zeroed.
The estimated, with the final model, mean number of air pollution-related deaths for the period of January 2017 is 11.1 ± 4.1, which is 8.3% of all deaths observed in that period if the date of hospital admission is taken as the time variable. The total number of air pollution-related deaths in the whole analysed period (January 2013 - June 2018) is estimated to be 70 ± 26, which is 1.1% of all observed deaths in the whole analysed period.
Discussion
The analysis broadens the conclusions presented in the
Statistics Poland and NHF reports suggesting a connection between
the observed number of deaths with low temperature and high air
pollution, confirming at the same time the relationship between
high PM10 concentrations in the air and the increased deaths
in January 2017, especially those associated with respiratory
diseases. It seems that a characteristic feature of the period with
the significantly higher number of deaths registered by GUS
(January 2017) was the persistence of air pollution levels at a
very high level over an exceptionally long (up to ten days) time
period without interruptions that would have allowed the body to
regenerate, especially in the case of people particularly susceptible to respiratory disorders. It is also important to note that the key
aspect of the analysis was to use the emergency hospital admission
date as the time variable, not the date of in-hospital death.
One can speculate that the admission date was the same time
as the moment the patient was isolated from the adverse impact
of the atmosphere: low temperature and air pollution, as well as
from the chemical agents accompanying the contamination of the
suspended PM. This construct has also ruled out the influence of
the hospital environment, which, especially with the elderly and
chronically ill, can be an additional risk factor. The study authors
and observers of the effects of air pollution emphasize that its
short-term effect is observed within hours, and at most days, from
the observed contamination [15-17]. The increase in the number of
hospitalizations and deaths due to cardiovascular and pulmonary
causes was observed both in short and longer time ranges [15-19].
The literature contains comparative analyses of the influence of
pollution found inside homes with outdoor air pollution [15,16].
These studies show that the use of air filters in homes reduced the
concentration of pollutants by 60-70%, which was accompanied by
a significant improvement in vascular endothelial function, after
just two days of isolation from the contaminated air [16,20].
This was connected to a change in the influence of inflammatory
reactions arising from exposure to air pollution components. It
should be emphasized that, until recently, both: the information
level about PM10 pollution and alarm level were liberal in Poland
when compared to the standards applied in the vast majority of
other European countries. Standards for PM10 are set based on
the average daily value. In Poland, a level not exceeding 50 μg/
m3 was considered acceptable, whereas the information level was
set at 200 μg/m3, and the alarm level at 300 μg/m3, while in most
EU countries, the alarm level is set below 150 μg/m3 [21]. In this
context, it is interesting to note that on the one hand, the data
presented in the analysis best explained the models which assumed
that only after exceeding a threshold of 50 μg/m3 for the daily
average value of PM10, air pollution affects the number of deaths
observed, but on the other hand, this value is several times lower
than the alarm value adopted in Poland for the analysed period
(300 μg/m3). Recently, the alarm and information levels in Poland
were lowered to 150 μg/m3 and 100 μg/m3 respectively [22].
Considering that the best explanations for the anomalies in the
increased number of deaths were those models that assumed an
already exceeded threshold of 50μg/m3 for the average daily value
of PM10 air pollution influences the observed number of deaths, it
seems reasonable to take early precautionary measures to isolate
patients from air pollutants at levels lower than the current PM10
alarm levels. Has recently been shown to affect mortality also in low
PM concentrations, below the current air-quality guidelines, which
confirms earlier suggestions that there are no safe thresholds for
particulates matters [5,23]. It is also advisable that announcements
about the increased risk of severe, often lethal diseases are provided
to the public and to health care centres when the combination of
risk factors occurs. Among the recommendations repeated in the
specialist literature on prevention is the avoidance, particularly by
vulnerable people, of the outdoors and to stay indoors with tightly
closed egresses during periods of intensified smog.
Experiences from Australia and Japan prove enormous social
and economic benefits resulting from a significant and long-lasting
reduction in air pollution levels in large cities [4,15]. The presented
work draws attention to an important health problem regarding
large populations exposed to adverse atmospheric conditions. In
light of the presented data, air pollution should be considered a
risk factor for premature deaths for various reasons. The literature
particularly emphasizes its impact on morbidity and mortality
due to cardiovascular problems, which we didn’t confirmed in this
study with the small population of hospitalized patients in a short
time span.
The Expert Panel on Population and Prevention Science of the
American Heart Association 2004 report highlights the risks of
exposure to high concentrations of PM in the air, mainly myocardial
infarctions, strokes, heart failure and arrhythmias [24-26]. At first,
this relationship was defined as mainly relating to the inhalable
particles with aerodynamic diameter of 2.5μm or less (PM2.5)- small
enough to penetrate deep to alveoli.
Toxic effects of PM2.5 fraction, can be seen very quickly- in a
matter of hours or weeks, resulting in cardiovascular and respiratory
complications [24,26,27]. Examining the short- term impact of
particulate matter on all-cause, cardiovascular and respiratory
mortality in 652 cities of the world Liu et al. showed that although
the impact of PM2.5 on mortality is slightly greater than PM10, there
is a strong correlation between the influence of these two PM
fractions (Person correlation coefficient 0.78) [5]. The long-term
effects of PM were expressed by a shorter than expected longevity
of age groups [28]. At the same time, the influence of the PM10
fraction was determined within very short time periods, counted
in days from the occurrence of peak air pollution. It was expressed
by an increase in the risk of cardiovascular death by 0.6-1.8% for
an increase in the concentration of these particulates by 20μg/m3
[28,29]. Liu et al. analysing almost 60 million deaths in 652 cities
in 25 countries around the world showed that enlargement in
concentration of PM10 by 10μg/m3 causes increase daily all-cause
mortality by 0.44%, cardiovascular by 0.36% and respiratory by
0.47% [5,23].
For PM2.5, this value was 0.6-1.3% for the concentration increase
in the air by 10μg/m3 [28] and recently, increase of daily all- cause
mortality by 0.68%, cardiovascular by 0.55% and respiratory
by 0.74% [5,23]. European studies covered 43 million residents of large cities, showing a 1.5% increase in daily mortality due to
cardiovascular problems as a consequence of the increase in PM10
by each subsequent 20μg/m3 [29].
Conclusion
Based on data from the hospital, the analysis is in line with the findings of Statistics Poland on the increased number of deaths in January 2017 and fully confirms the opinions of specialists about the high level of harm caused by poor air quality. It also indicates respiratory system complications as the main cause of the increase in the number of deaths.
Funding
The authors received no specific funding for this work.
Conflict of interest
None declared.
Acknowledgment
The authors express their sincere gratitude to Barbara Przybylska for linguistic proofreading the text.
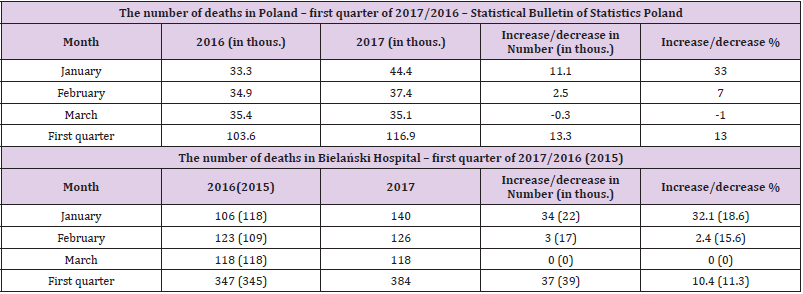
Table 1: The number of deaths in Poland according to Statistics Poland [1] and in the hospital. Values in parentheses refer to 2015.
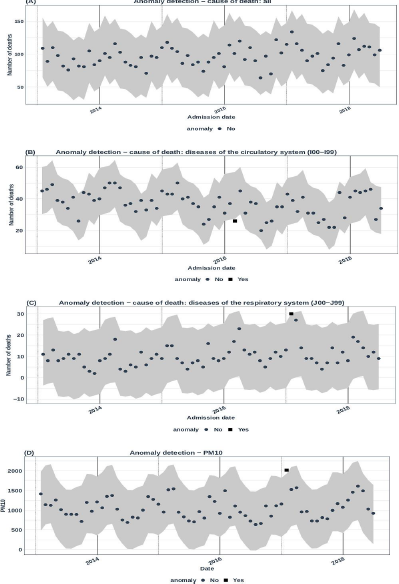
Figure 1: Analysis of anomalies (circles indicate no anomaly in the studied months, squares indicate an anomaly) in the number of deaths in the hospital (A-C): A – lack of anomalies in the analysis of all deaths, B – anomaly associated with a low number of cardiovascular deaths in the first quarter of 2016, C – anomaly associated with a significant number of deaths caused by respiratory diseases in the first quarter of 2017. D - Anomaly analysis of the levels of monthly aggregated PM10 levels averaged for the two stations closest to the hospital. On all figures the significance level of the anomaly (indicated by grey bands) is equal to 10-4.
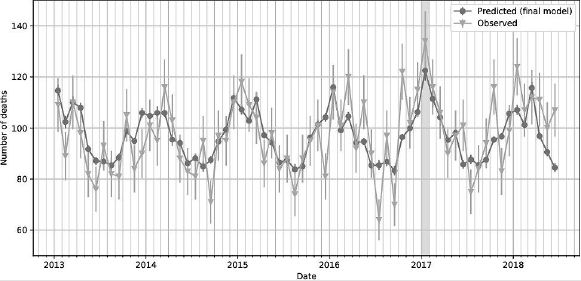
Figure 2: Monthly predictions of the average number of all deaths obtained with the final model (error bars are equal to standard deviation and were estimated with the bootstrap method) along with the observed number of deaths (Poissonian errors). The shaded region highlights January 2017.
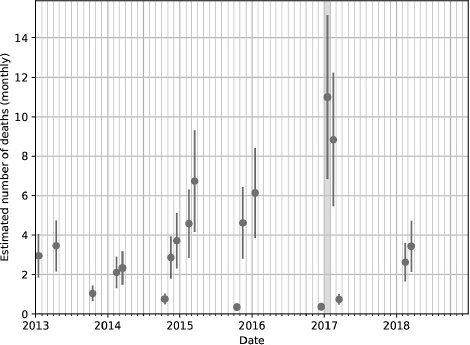
Figure 3: Estimated number of monthly deaths due to air pollution. Error bars are equal to standard deviation and were estimated with the bootstrap method. Data points, corresponding to months with 0 deaths attributed to air pollution, were omitted. The shaded region highlights January 2017.
References
- Statistics Poland Report (GUS). Biuletyn Statystyczny Nr.5/2017.
- Report from the Polish National Health Fund (NFZ). Analiza przyczyn wzrostu liczby zgonów w Polsce w 2017 roku - NFZ.
- Kozlowska-Szczęsna T, Krawczyk B, Kuchcik M (2004) The influence of atmospheric environment on the human health and well-being. Polish Academy of Sciences. Stanislaw Leszczycki Institute of Geography and Spatial Organisation. Monographs 4 Warsaw.
- Martinelli N, Olivieri O, Girelli D (2013) Air particulate matter and cardiovascular disease: a narrative review. Eur J Inter Med 24: 295-302.
- C Liu, R Chen, F Sera, Cabrera AMV, Guo Y, et al. (2019) Ambient Particulate Air Pollution and Daily Mortality in 652 Cities. N Engl J Med 381: 705-715.
- Dąbrowski M, Białobrzewski M, Kochanowski J (2015) Analysis of hospital mortality in a capital multispecialty hospital in 2014 Polish. Probl Hig Epidemiol 96: 502-509.
- Institute of Meteorology and Water Management. National Research Institute. Historical data.
- Estimation of air quality- up-to-date measurement data - GIOŚ.
- Dancho M, Vaughan D. Package Anomalize.
- Cleveland RB, Cleveland WS, McRae JE, Terpenning IJ (1990) STL: A seasonal-trend decomposition procedure based on Loess. J Official Statistics 6: 3-73.
- Rosner B (1983) Percentage Points for a Generalized ESD Many-Outlier Procedure. Technometrics 25: 165-172.
- Good P (1994) Permutation Tests. A Practical Guide to Resampling Methods for Testing Hypotheses. Springer Series in Statistics. Springer-Verlag, Berlin-Heidelberg, NY, p. 4-6.
- European Commission Air Quality Standards.
- Burnham KP, Anderson DR (2002) Model Selection and Multimodel Inference: a practical information – theoretic approach. Springer, New York, p. 60-64.
- Bourdrel T, Bind MA, Béjot Y, Morel O, Argachae JF (2017) Cardiovascular effects of air pollution. Arch Cardiovasc Dis 110: 634-642.
- Karottki DG, Bekö G, Clausen G, Madsen AM, Andersen ZJ, et al. (2014) Cardiovascular and lung function in relation to outdoor and indoor exposure to fine and ultrafine particulate matter in middle-aged subjects. Environ Int 73: 372-381.
- Ruckerl R, Schneider A, Breitner S, Cyrys J, Peters A (2011) Health effects of particulate air pollution: a review of epidemiological evidence. Inhal Toxicol 23: 555-592.
- Hoek G, Krishnan R, Beelen R, Peters A, Ostro B, et al. (2013) Long-term air pollution exposure and cardio- respiratory mortality: a review. Environ Health 12: 43-50.
- Strak M, Janssen NA, Godri KJ, Gosens I, Mudway IS, et al. (2012) Respiratory health effects of airborne particulate matter: the role of particle size, composition, and oxidative potential - the RAPTES project. Environ Health Perspect 120: 1183-1189.
- Allen RW, Carlsten C, Karlen B, Leckie S, Eeden SV, et al. (2011) An air filter intervention study of endothelial function among healthy adults in a woodsmoke-impacted community. Am J Respir Crit Care Med 183: 1222-1230.
- (2017) Air Pollution Emergency Schemes (Smog Alerts) in Europe, compiled by Marcus Wiesen. For Clean Air Action Group. Budapest.
- Polish Ministry of the Environment. Rozporządzenie Ministra Środowiska z dnia 8 października 2019 r. zmieniające rozporządzenie w sprawie poziomów niektórych substancji w powietrzu. Dz U 2019 poz 1931
- Balmes JR (2019) Do We Really Need Another Time-Series Study of the PM2.5- Mortality Association? N Engl J Med 381: 22.
- Brook RD, Franklin B, Cascio W, Hong Y, Howard G, et al. (2004) Air pollution and cardiovascular disease: a statement for healthcare professionals from the Expert Panel on Population and Prevention Science of the American Heart Association. Circulation 109: 2655-2671.
- Wellenius GA, Schwartz J, Mittleman MA (2005) Air pollution and hospital admissions for ischemic and hemorrhagic stroke among medicare beneficiaries. Stroke 36: 2549-2553.
- Wang X, Wang W, Jiao S, Yuan J, Hu C, et al. (2018) The effects of air pollution on daily cardiovascular diseases hospital admissions in Wuhan from 2013 to 2015. Atmosph Environ 182: 307-312.
- Costantino S, Libby P, Kishore R, Tardif JC, El-Osta A, et al. (2018) Epigenetics and precision medicine in cardiovascular patients: from basic concepts to the clinical arena. Eur Heart J 39: 4150-4158.
- Brook RD, Rajagopalan S, Pope III CA, Brook JR, Bhatnagar A, et al. (2010) Particulate Matter air pollution and cardiovascular disease. An update to the scientific statement from the American Heart Association. Circulation 121: 2331-2378.
- Franchini M, Mannuccio PM (2012) Air pollution and cardiovascular disease. Thromb. Research 129: 230-234.
