 Review Article
Abstract
The study examines the effect of perceived service quality (PSQ) and patient expectation (PE) on patient satisfaction (PS) and patient loyalty (PL). A questionnaire delivered to inpatients who were treated at the highest-level hospital, Viet Nam in April 2018. The data were analyzed by SPSS version 25.0 software and AMOS 25.0 software. A confirmatory factor analysis was performed to test the structural equation modelling for the proposed hypotheses. Results showed PSQ influences PS and PL; PE influences PS but doesn’t influence PL; PS influences PL, indicating PSQ and expectation affect directly satisfaction, therefore consider PSQ increase satisfaction and maintain loyalty.
Keywords: Perceived Service Quality; Expectation; Satisfaction; Loyalty
Abbreviations: PSQ: Perceived Service Quality; PE: Patient Expectation; PS: Patient Satisfaction; PL: Patient Loyalty; CFA: Confirmatory Factor Analysis; SEM: Structural Equation Modeling; SPSS: Statistical Package of Social Sciences; CR: Composite Reliabilities; AVE: Average Variance Extracted: NFI: Normalized Fit Index; RMSEA: Root Mean Squared Error of Approximation; CFI: Comparative Fit Index; AGFI: Adjusted Goodness of Fit Index; TLI: Tucker-Lewis Index
Introduction
Service quality is a key element in the competitive environment
of the service industry Stefano, et al. [1,2]. It had become a core
factor of the management strategy that increases satisfaction,
maintaining long-term relationships with customers, building
customer loyalty, and encourages repurchase Cai, et al. [3]. Service
quality has a strong effect on trust and loyalty Singh, et al. [4].
Measurement and assessment of service quality were based on
the evaluation of consumers on perceived service quality (PSQ)
and their expectations Manulik, et al. [1,5]. It was measured by
the result of an evaluation process whereby a user compares
their expectations with the perceived service quality of providers
Asefzadeh, et al. [6,7]. This proved that perceived quality has closely
related to customer expectations Li, et al. [8]. Perceived quality
and expectation have predicted on satisfaction and repurchase/
loyalty Hadji, et al. [9]. Service companies have improved their
service quality that meets consumers’ needs to increase customer
satisfaction and loyalty Hadji, et al. [9,10]. Aspects of perceived
service quality are tangibility, reliability, responsiveness, empathy,
and assurance. Cai, et al. [3] Our study considers on tangibility,
reliability, responsiveness.
The service organization focused on consumer satisfaction
Lonial, et al. [11]. Measuring customer satisfaction was used
to evaluate the service quality of service firms Worku, et al.
[12,13]. Dimensions of perceived quality were assessed customer
satisfaction and loyalty Aljaberi, et al. [11,14], where the consumer
has high satisfaction levels, proving to predict the willingness to
repurchase Schaal, et al. [15]. Perceived quality has related to direct
consumer satisfaction and indirectly influence consumer loyalty
through satisfaction plays as a mediating Guhl, et al. [16]. Customer
loyalty is a core factor that focuses on when measures the service
quality of providers Borishade, et al. [17]. Customer satisfaction with
service quality predicts the repurchase of the service organization Cudjoe, et al. [18] and plays a mediator factor between perceived
quality and loyalty Lestari, et al. [19,20]. Increasing service quality
is improving trust, building customer loyalty, and retain repurchase
intention Upamannyu, et al. [21]. Satisfaction is a mediating factor
between perceived quality and repurchase intention Rajaguru [22].
Thus, the service provider improves service quality in order to
attract and retain the consumer Upamannyu, et al. [21].
Literature Review
Our study aims to investigate the effect of perceived service quality and expectations on satisfaction and loyalty. In this section, we review the literature regarding the scope of the present study.
Perceived Service Quality (PSQ)
Service quality is a core factor that has a direct effect on
customer satisfaction and an indirect effect on customer loyalty
Lonial, et al. [11,14]. Quality refers to a term that is considered
demonstrative of a high satisfaction level and related to factors that
characterize a product or service Worku, et al. [12,23]. It is a factor
that is difficult to define and measure. Therefore, measurement and
evaluation were based on assessing perceived quality by customer
insight Stefano, et al. [1]. It is the result of comparing perceived
quality and that expected by the customer on the aspect of service
quality including tangibles, reliability, responsiveness, assurance,
and empathy Chang, et al. [6,7].
In which, tangibility refers to the sense of physical space
in relation to services, facilities, equipment, the appearance of
personnel; reliability of the service provider, including performing
committed function accurately and reliably; responsiveness of the
service provider such as a tendency toward helping and responding
to customers’ needs; assurance provided by service provider refers
to the ability of personnel to induce trust and reliability; empathy
of service providers with customers refers to personal attention to
customers. Stefano, et al. [1,5,6]. In addition, Abedi, et al. [24] has
shown dimensions of service quality such as physical, assurance,
ability, responsiveness, behavior, accessibility and affordability.
Our study focuses on tangibles, reliability, and responsiveness.
PQS and expectation have a close relationship Li, et al. [8,25].
They are factors that were predicted of customer satisfaction and
loyalty Hadji, et al. [9,25]. Moreover, PSQ directly affects customer
satisfaction and loyalty [11] or indirect effect customer loyalty/
behavioural intention through satisfaction is the mediator Lonial,
et al. [11,14]. Our paper considers the effect of perceived service
quality on satisfaction and loyalty.
Patient Expectation (PE)
Evaluation of service quality is based on compared a gap between the customer expectation and perceived quality with respect to various aspects of service Abedi, et al. [6,7,8,24,]. In this way, consumers set the range of expected outcomes of emotional services as a quality standard that measures service quality Jeong, et al. [15]. In addition, the expectation has related to consumer satisfaction on service quality Chen, et al. [26,27] Moreover, consumer expectations and PSQ were predicted satisfaction and continued intention Hadji, et al. [9]. Therefore, perceived quality is closely related to consumer expectations Lin, et al. [8,25]. Therefore, improving perceived quality meets customers’ expectations leads to increase satisfaction Hadji, et al. [9]. Moreover, the fulfilment of consumers’ satisfaction and meet the needs of consumer expectations positively influence service outcomes Chen, et al. [26,27]. Besides, perceived service quality depends on how well a consumer’s expectations on aspects of service quality, which including tangibility, reliability, responsiveness, assurance, and empathy Abedi, et al. [6,7,8,24,]. In addition, Abedi, et al. [24] supported the dimensions of service quality refer to physical, assurance, ability, responsiveness, behavior, accessibility, and affordability. Our study considers tangibility, reliability, responsiveness.
Patient Satisfaction (PS)
Customer satisfaction is an indispensable factor when measures the service quality of providers Garcia-Alfranca, et al. [23], it is the expected outcome of customers Smith, et al. [27]. Service quality is a core factor in sustainable competitive advantage that, measures of customer satisfaction on the parts of service is a tool useful to improve the service quality of providers Shin, et al. [12,13,28]. The service organization meet fulfills consumer expectations on aspects of perceived quality that lead to increase customer satisfaction and repurchase Jeong, et al. [9,11,15,22,29]. Thereby, the service organization should improve service quality that meets customer needs to get their expectation aims to increase customer satisfaction and loyalty Shahsavar, et al. [9,30]. Customer satisfaction is a mediator factor of perceived quality and loyalty Rajaguru [11,22] or both perceived quality and expectations related to re-buy Hadji, et al. [9].
Patient Loyalty (PL)
Loyalty refers to the repeat purchase behavior of consumers Villace-Molinero, et al. [31]. Consumer satisfaction and loyalty that considers as key factors of business strategy Shahsavar, et al. [30]. Improving perceived service quality was increased satisfaction and behavioral intention Aljaberi, et al. [14]. Perceived quality and expectation are predicted satisfaction and loyalty Lin, et al. [9,25]. Consumer satisfaction plays as a mediating factor of service quality and loyalty Hadji, et al. [9,11]. Therefore, the service firms should increase service quality that meets customer needs to improve satisfaction and willingness to return Santoso, et al. [15,20].
Research Hypotheses
Perceived service quality and expectation are factors that
assessed the service quality of the service firms Manulik, et al. [5].
They were measured based on comparing a gap between perceived
quality and expectation of consumers Chang, et al. [6,7]. Perceived
service quality and expectations were predicted on consumer
satisfaction Hadji, et al. [9]. Perceived service quality has a close
relationship with expectation Abedi, et al. [24] and influences
loyalty Lin, et al. [25]. This relationship should consider in terms
of customer satisfaction Hadji, et al. [9], must also be considered in
assessments of service quality Manulik, et al. [5]. Chang, et al. [9]
supported that has existed between expectation and perceived that
expectation is higher than perceived of the quality of healthcare
service, indicating that unmet users’ needs and priorities for
improvement Shin, et al. [28]. Therefore, measuring the perceived
quality of various aspects of services is a core factor to meet
consumers’ needs and increase consumer satisfaction and re-buy
Santoso, et al. [20]. Base on this discussion, we offer the following
hypothesis:
H1: Patient Expectation (PE) Positive Effect on Perceived
Service Quality (PSQ): Expectations related to satisfaction Smith,
et al. [27]. The expectation has a positive effect on satisfaction Hadji,
et al. [9]. Expectation and perceived quality of customer on aspects
of service quality that measured of service quality of providers
Chang, et al. [6,7]. The service organization focus on improved
perceived quality that meets expectation consumers’ needs to aim
to develop satisfaction and maintain loyalty Hadji, et al. [9,14].
Besides, the fulfilment of clients’ satisfaction and expectations has a
strong influence on service outcomes Chen, et al. [26,27]. Moreover,
satisfaction plays a mediator role between perceived quality/
expectation and loyalty Hadji, et al. [9]. Considering this, we give
the following hypothesis:
H2: PE Significant Influence on Patient Satisfaction (PS):
Evidence has demonstrated the roles of customer expectations
and satisfaction on service quality of providers Chen, et al. [26,29].
It related to service outcomes Smith, et al. [27]. Expectation does
not directly affect loyalty that it does indirectly through perceived
quality is a mediating Lin, et al. [25]. Customer expectation has a
close relationship with perceived quality when measures service
quality of the service firms Chang, et al. [7,25]. Perceived quality
and expectation are core factors when considers satisfaction and
loyalty by the consumer Hadji, et al. [9]. Thus, we proposed:
H3: PE Noticeable Effect on Patient Loyalty (PL): Perceived
quality is an indispose factor when assessing the service quality
of the provider Manulik, et al. [1,5]. It is a key element when
measures users’ satisfaction on service quality of the service firms
Santoso, et al. [20,28]. Perceived quality has a close relationship
with expectations Chang, et al. [6,7,8]. They are core factors when
determines satisfaction and loyalty/ re-buy by customers Hadji, et
al. [9,25]. Satisfaction plays a mediating role between perceived
service and loyalty/behavioral intention Lonial, et al. [11,14].
Considering these findings, we propose:
H4: PSQ Significant Effect on PS: Perceived quality is an
element directly effect on loyalty Lin, et al. [25]. It combines with the
expectation that directly influences on satisfaction and indirectly
affects loyalty by satisfaction is a mediator role Hadji, et al. [9].
This proved evidence perceived quality has related the close to
expectation. These two factors have contributed to indispose in the
measurement of service quality Asefzedeh, et al. [5,6,]. Therefore,
we proposed the hypothesis:
H5: PSQ positive effect on PL: Satisfaction is a tool that
measures the service quality of the service organization Santoso, et
al. [20]. Perceived service quality and expectations are key factors
related to satisfaction and continuance intention Hadji, et al. [9].
Improving service quality was increased that meets the fulfillment
of customer’s expectations to maintain user satisfaction and leads
re-buy Hadji, et al. [9]. Perceived quality has directly affected
consumer satisfaction and loyalty or indirectly by satisfaction
is a mediator Alijaber, et al. [14]. Satisfaction direct effects on
loyalty/repurchase intention Lonial, et al. [9,11]. Based on these
observations, we offer the hypothesis:
H6: PS remarkable effect on PL.
Data and Methodology
The survey was carried out at the National Cancer Hospital,
VietNam was a total of 2,500 inpatients per day of 39 clinical
departments. The number of assistance members was recruited
who training for one day on the purpose of the study before collect
data. The sample size of the study was required of 500 participants
supported by Wolf, et al. [32]. The participants were randomly
selected from the list of inpatients of each department of 22% total
of 2,500. A total of 550 participants were recruited for our study
that was included who don’t complete questionnaires. A structured
questionnaire was used for the research instrument, which including
40 questions into two parts. Firstly, the socio-demographic factors
concern six questions of age, sex, marital status, educational level,
occupation, and method of paying hospital fees.
Secondly, 34 questions related to four factors of Perceived
service quality (PSQ), Patient expectation (PE), Patient satisfaction
(PS), and Patient loyalty (PL). PSQ factor constructs fourteen
questions, five questions of tangibility (PSQ1–PSQ5), five questions
of reliability (PSQ5-PSQ10), and four questions concern on
responsiveness (PSQ11–PSQ14). The content of these questions was based on the work of Aman, et al. [33], which modifies to fit with the
research hospital. Similarly, fourteen questions refer to PE factor,
including five questions of tangibility (PE15-PE19), five questions
of reliability (PE20-PE24), and four questions of responsiveness
(PE25- PE28). Followed by the PS factor was constructed by three
questions (PS29-PS31). Finally, three questions concern about
the PL factor (PL32- PL34). All questions were measured using a
Likert scale ranging from one (1) “very strongly disagree” to five (5)
“very strongly agree”. The data analysis was used in the Statistical
Package of Social Sciences (SPSS) version 25.0 and AMOS 25.0
software. Our research model has used confirmatory factor analysis
(CFA) that supports the issues of dimensionality and convergent
and discriminant validity. The structural equation modelling (SEM)
was assessed on the proposed hypotheses (Appendix).
Results and Discussion
The Reliability Statistics
A Likert scale was assessed to all questions of the study that ranges from very strongly agrees (5) to very strongly disagree (1). Cronbach’s alpha was calculated by using the SPSS 25.0 program that presents the consistency and stability of a set of indicators that reflect a given construct. Findings illustrated in Table 1. The Cronbach alpha values were based on all the retained items and offered strong support for reliability in three perceived service quality aspects (tangibility = 0.873, reliability= 0.854, responsiveness= 0.845), patient expectation factor of these aspects ranged from 0.939 to 0.955, patient satisfaction and patient loyalty was 0.792, 0.800, respectively (Table 1). All the Cronbach alpha value of the study was exceed the cut-off reliability value of 0.70, showing the scales have strong reliability and adequate internal consistency.
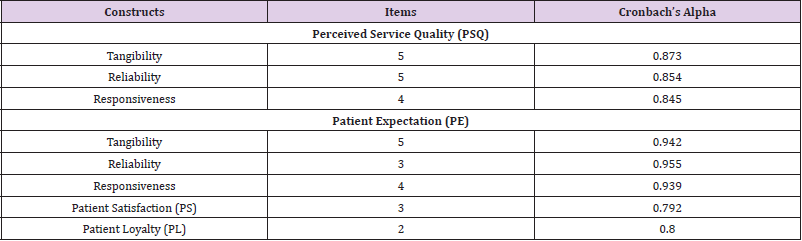
Table 1: Reliability statistics.
Confirmatory Factor Analysis (CFA)
Our research model was used CFA that was assessed the construct and the correct assignment of variables Hair Jr, et al. [34]. It was assessed in terms of the standardized coefficients, the composite reliabilities (CR), and the average variance extracted (AVE) Hair Jr, et al. [34], presents in Table 2. The standardized coefficients of all items were ranged between 0.62 and 0.93 [cut - off= 0.5] (Table 2). The AVE values of perceived service quality (PSQ), patient expectation (PE), patient satisfaction (PS), and patient loyalty (PL) were 0.51, 0.71, 0.57, and 0.67, respectively [cut-off of 0.50] Hair Jr, et al. [34], which indicating high discriminant validity, and the variances was supported by our results. The CR values of PSQ, PE, PS and PL were ranged from 0.80 and 0.97 [cut- off = 0.70], indicating adequate internal consistency. Findings supported that our model was accepted.
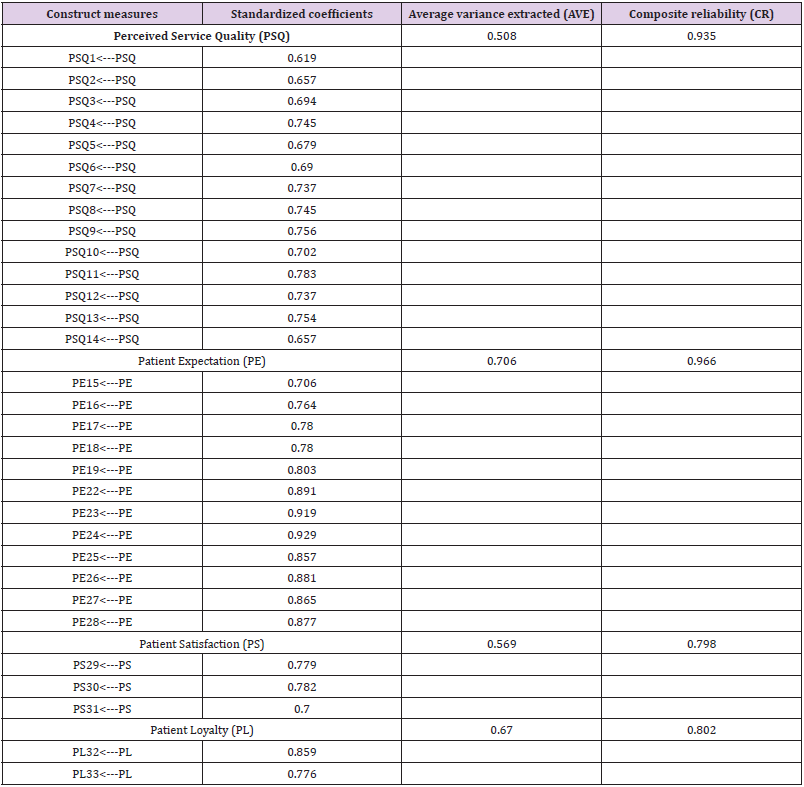
Table 2: Confirmatory factor analysis results and Model goodness-of-fit.
Note: Chi-square=1143.852; df=411; P=0.000; Chi-square/df= 2.783
GFI=0.875; TLI=0.938; CFI=0.946; NFI-0.918; RMSEA= 0.059; AGFI=0.849.
Model Goodness-of-Fit
Our research model was assessed by fit of the absolute
measures, incremental measures, and parsimony fit measure, and
basic elements underlying all the basis of Goodness-of-fit measures,
showing in Table 2.
The ratio of χ2 to the degrees of freedom (Chi-square/df) was
2.783 with P = 0.000. The indices of the fit model includes [GFI] =
0.88 [cut-off = 0.80]; normalized fit index [NFI] = 0.92 [requirement
= value of 0–1]; root mean squared error of approximation [RMSEA]
= 0.06 [requirement = value from 0.05–0.08]; comparative fit index
[CFI] = 0.95; Adjusted goodness of fit index [AGFI] = 0.85 [cutoff=
0.80]; and Tucker-Lewis index [TLI] = 0.94 [cut-off = 0.9] (Table
2) (Hair Jr et al., 2014, p. 630). Our research model was supported
of the reliability and validity requirements.
Hypotheses Testing
Our research hypotheses have represented in Table 3, indicated by the path coefficient with standardized coefficients at statistically significant which shows impacting factors (requirement sig. less than 0.05). These standardized coefficients value present the direction of the effect. • Hypothesis H1: Patient expectation (PE) related to Perceived service quality (PSQ) was represented by the coefficient of the path (PE---> PSQ) at a statistically significant of 0.441 with p < 0.001 (Table 3). This proved that PE has a direct influence on PSQ, similar to the work of Hadji, et al. [9]. Improving perceived quality aims to meet customer expectation Smith, et al. [26,27] bleads to an increase in the satisfaction of service outcome and maintain loyalty/ repurchase intention Lestari, et al. [19]. Perceived service quality and expectation are core factors that measured service quality Stefano, et al. [1]. This measurement presents by comparing a gap in the relationship between perceived quality and expectation by the client Asefzadeh, et al. [6]. Perceived service quality and expectations have a close relationship that was anticipated on satisfaction and re-buy Hadji, et al. [9]. Our findings contributed to the service organization focuses on factors that aims to develop service quality leads to evolve satisfaction and retain loyalty Hadji, et al. [9,25]. Aspects of perceived quality and expectation should consider including tangibility, reliability, responsiveness that develop satisfaction and loyalty customers on service quality.
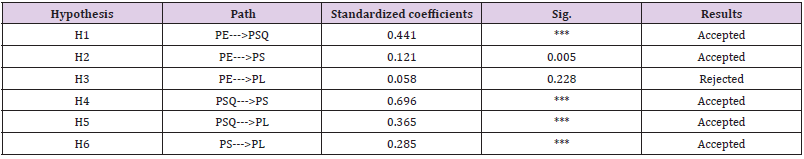
Table 3: Hypothesis test results.
• Hypothesis H2: PE positive influence on Patient satisfaction (PS) supported by the coefficient of the path (PE--- >PS) at a statistically significant of 0.121 with p = 0.005. It shows that PE directly affects PS, consistent with previous research Hadji, et al. [9,30]. In addition, expectations related to perceived quality and they are factors that directly affect satisfaction and an indirect effect on loyalty via satisfaction is mediating Shahsavar, et al. [9,30]. Moreover, satisfaction fulfillment and consumer expectations have a positive influence on service outcomes Chen, et al. [26,27]. Our results revealed that increase perceived quality to aim to fulfill customer expectation and evolve satisfaction and revisit willingness Schaal, et al. [15]. • Hypothesis H3: PE positive effect on Patient loyalty (PL) supported by the coefficient of the path directly (PE--->PL) with a standardized coefficient of 0.058 at statistical significance p = 0.228. It indicated that this hypothesis was not accepted, consistent with previous work of Lin, et al. [25] has given that expectation don’t directly affect to loyalty, it indirect influence to loyalty through perceived quality is a mediating. In addition, satisfaction is a mediator role in the relationship between expectation and loyalty/continuance intention Hadji, et al. [9,30]. While Hadji, et al. [9] released that expectation direct effects on repurchase intention. Measurement and evaluation of service quality based on assessing a gap of perceived quality and expectation Chang, et al. [6,7]. Our findings have implications for managers and policymakers when considering factors to increase satisfaction and maintain the loyalty of consumers. • Hypothesis H4: PSQ has a significant influence on PS, which supported by the coefficient of the path PSQ--->PS with a standardized coefficient value of 0.696 was statistically significant (p < 0.001) (Table 3), clearly indicates a positive effect of PSQ on PS. These findings contributed to how a service company can improve total service quality and, thereby, retain customer satisfaction through increasing management of perceived quality by customers. Perceived quality is a key factor that measures the service quality of providers Stefano, et al. [1]. It is a tool that focuses on satisfaction and loyalty Lonial, et al. [11]. Satisfaction is a mediator of service quality and re-buy Lestari, et al. [19]. Our study points to a strategic approach that managers can use to improve service quality and, thereby, evolve consumer satisfaction and retention. • Hypothesis H5: PSQ significant influences on PL are represented by the coefficient of the path PSQ--->PL at a standardized coefficient value of 0.365 has a positive sign and was statistically significant with p < 0.001 (Table 3), indicating PSQ direct influence on PL. Similarly, previous research has shown that perceived quality has related directly to repurchase/loyalty Hadji, et al. [9,25]. While Shahsavar, et al. [30] supported that satisfaction is a mediating of the relationship between perceived quality and loyalty. Our findings revealed that improve service quality aims to increase satisfaction and thereby building the loyalty of customers. Moreover, perceived quality and expectation are factor that related to satisfaction and loyalty Lin, et al. [9,25]. Perceived quality is an element indisposed when focuses on measurement consumers’ satisfaction and retain loyalty with the service firms. • Hypothesis H6: PS has a positive influence on PL that was represented by the coefficient of the path (PS--->PL) with a standardized coefficient of 0.285, a statistical significance at p < 0.001 (Table 3), which shows the hypothesis supported. Similarly, the work of Aljaber, et al. (2016) supported that satisfaction has a strong influence on loyalty. Satisfaction is a tool that measures the service outcome of providers Mulisa, et al. [12,13]. In addition, satisfaction plays a mediating role in the relationship between perceived quality and loyalty Lestari, et al. [11,19]. Therefore, the service companies improve service quality that aims to meet users’ needs and thereby maintain loyalty/repurchase intention.
Implications for Practice
The results of the current study have important implications for service providers and policymakers in healthcare when considers factors directly affect on satisfaction and loyalty. It was found that develops perceived service quality to increase meet customers’ needs and improve satisfaction and retain loyally. It contributes to policymakers when developing the strategic plan to aim to evolve satisfaction and increase customer loyalty. Aspects of perceived quality should improve that including which including tangibility, reliability, and responsiveness related to consumer satisfaction and loyalty.
Conclusion and Recommendation
Our paper aims to examine the impact of perceived service
quality (PSQ) and patient expectation (PE) related to patient satisfaction (PE) and patient loyalty (PL). The study was carried
out at a National Cancer hospital in Vietnam during April 2018.
The instrument of study was a structured questionnaire with
516 completed documents that using for the analysis process. A
confirmatory factor analysis (CFA) was used to assess structural
equation modeling (SEM) that tests the proposed hypotheses. Our
results revealed that PSQ directly influences PS and PL; PE positives
influence PS. However, PE doesn’t have a significant effect on PL.
This proved that PSQ directly effect to satisfaction and loyalty.
Whereby it is a key factor in strategic planning to attract customers
to increased satisfaction and retain loyalty.
Thereby increasing profits for service providers contribute
to sustainable survival in the competitive environment. While PE
doesn’t directly influence on PL that through consumer satisfaction
as a mediator role in the relationship between PE and PL. Thus,
providers should consider customer satisfaction to maintain
loyalty. Moreover, the study also develops our knowledge of
how the various dimensions of perceived service quality which
including tangibility, reliability, and responsiveness affect consumer
satisfaction and loyalty. Improving service quality was aimed at
meed needs customer expectation leads to increase the satisfaction
levels of its patients, building loyalty. Besides, providers should
use service quality based on the perceived service attributes to
build loyalty. In addition, our results have practical implications for
future satisfaction and loyalty/continuance intention studies.
Acknowledgment and Funding
The authors of this paper appreciate the research team of the National Cancer Hospital in Hanoi, Vietnam, as well as all inpatients who assisted us in conducting this study. No funding for this study.
Disclosure Statement
The authors declare no conflicts of interest in this paper.
References
- Stefano NM, Casarotto FN, Barichello R, Sohn AP (2015) A fuzzy SERVQUAL based method for evaluated of service quality in the hotel industry. Procedia CIRP 30: 433-438.
- Knop K (2019) Evaluation of quality of services provided by transport and logistics operator from pharmaceutical industry for improvement purposes. Transportation Research Procedia 40: 1080-1087.
- Cai Z, Yang C (2018) Research on the extension evaluation model and strategy generation method of enterprise service quality. Procedia computer science 139: 381-391.
- Singh JJ, Iglesias O, Bastista-Foguet JM (2012) Does having an ethical brand matter? The influence of consumer perceived ethicality on trust, affect and loyalty. Journal Business Ethics 111: 541-549.
- Munulik S, Rosinczuk J, Karniej P (2016) Evaluation of health care service quality in Poland with the use of SERVQUAL method at the specialist ambulatory health care center. Patient Preference and Adherence 10: 1435-1442.
- Asefzadeh S, Gholami S, Rajaee R, Najafi M, Alijanzadeh M (2016) Evaluation of the quality of health service providers: The Iranian people perspective 2014. Electronic Physician 8(3): 2073-2080.
- Chang B, Kao H, Lin S, Yang S, Kuo Y, et al. (2019) Quality gaps and priorities for improvement of healthcare service for patients with prolonged mechanical ventilation in the view of family. Journal of the Formosan Medical Association 118(5): 922-931.
- Li M, Fan Y, McNeil EB, Chongsuvivatwong V (2018) Traditional Mongolian, traditional Chinese, and Western medicine hospitals: System review and patient survey on expectations and perceptions of quality of healthcare in Inner Mongolia, China. Evidence-Based Complementary and Alternative Medicine, p. 1-15.
- Hadji B, Degoulet P (2016) Information system end-user satisfaction and continuance intention: A unified modeling approach. Journal of Biomedical Informatics 61: 185-193.
- Berezan O, Krishen AS, Tanford S, Raab C (2017) Style before substance? Building loyalty through marketing communication congruity. European Journal of Marketing 51(7/8): 1332-1352.
- Lonial S, Raju PS (2015) Impact of service attributes on customer satisfaction and loyalty in a healthcare context. Leadership in Health Services 28(2): 149-166.
- Worku M, Loha E (2017) Assessment of client satisfaction on emergency department services in Hawassa university referral hospital, Hawassa, Southern Ethiopia. BMC Emergency Medicine 17: 21.
- Mulisa T, Tessema F, Merga H (2017) Patients' satisfaction towards radiological service and associated factors in Hawassa university teaching and referral hospital, Southern Ethiopia. BMC Health Services Research 17(441): 1-11.
- Aljaberi MA, Juni MH, Al-Maqtari RA, Lye MS, Saeed MA, et al. (2018) Relationships among perceived quality of healthcare services, satisfaction and behavioural intentions of international students in Kuala Lumpur, Malyasia: a cross-sectional study. BMJ Open 8(9): e021180.
- Schaal T, Schoenfelder T, Klewer J, Kugler J (2016) Determinants of patient satisfaction and their willingness to return after primary total hip replacement: a cross-sectional study. BMC Musculoskeletal Disorders 17: 330.
- Guhl D, Blankart KE, Stargardt T (2019) Service quality and perceived customer value in community pharmacies. Health Service Management Research 32(1): 36-48.
- Borishade TT, Worlu RE, Kehinde O, Ibidunni A, Ogunnaike OD, et al. (2018) A dataset of customer loyalty and variation in perception of customers across demographic characteristics in healthcare sector of Nigeria. Data in Brief 20: 353-357.
- Cudjoe AG, Anim PA, George AA (2015) Effect of customers' satisfaction of service delivery on customers' retention of Tigo Telecommunication Network (A case of Abokobi-Madina locality). International Journal of Business & Management 3(1): 146-162.
- Lestari VT, Ellyawati J (2019) Effect of E-service quality on repurchase intention: testing the role of E-satisfaction as mediator variable. International Journal of Innovative Technology and Exploring Engineering (IJITEE) 8(7C2): 158-162.
- Santoso A, Aprianingsih A (2017) The influence of perceived service and E-service quality to repurchase intention the mediating role of customer satisfaction case study: Go-Ride in Java. Journal of Business and Management 6(1): 32-43.
- Upamannyu NK, Gulati C, Chack A, Kaur G (2015) The effect of customer trust on customer loyalty and repurchase intention: the moderating influence of perceived CSR. International Journal of Research In IT, Management and Engincering 5(4): 1-31.
- Rajaguru R (2016) Role of value for money and service quality on behavioural intention: a study of full service and low cost airlines. Journal of Air Transport Mangement 53: 114-122.
- Garcia-Alfranca F, Puig A, Galup C, Aguado H, Cerda I, et al. (2018) Patient satisfaction with pre-hospital emergency services. A qualitative study comparing professionals' and patients' views. International Journal of Environmental Research and Public Health 15(233): 1-31.
- Abedi G, Rostami F, Ziaee M, Siamian H, Nadi A (2015) Patient's perception and expectations of the quality of outpatient services of Imam Khomeini hospital in Sari city. Mater Sociomed 27(4): 272-275.
- Lin D, Li Y, Pai J, Sheu I, Glen R, et al. (2009) Chronic kidney-disease screening service quality: questionnaire survey research evidence from Taichung city. BMC Health Services Research 9(239): 1-11.
- Chen Y, Liu J, Xiao S, Liu X, Tang X, et al. (2014) Model construction of nursing service satisfaction in hospitalized tumor patients. International Journal of Clinical and Experimental Medicine 7(10): 3621-3629.
- Smith MJ, Choma TJ (2017) Patient satisfaction in musculoskeletal medicine. Current Reviews in Musculoskeletal Medicine 10(2): 207-211.
- Shin N, Park J (2018) The effect of intentional nursing rounds based on the care model on patients' perceived nursing quality and their satisfaction with nursing services. Asian Nursing Research 12(3): 203-208.
- Jeong JY, Park J, Hyun H (2019) The role of emotional service expectation toward perceived quality and satisfaction: moderating effects of deep acting and surface acting. Frontiers in Psychology 10(321): 1-11.
- Shahsavar T, Sudzina F (2017) Student satisfaction and loyalty in Denmark: application of EPSI methodology. PLoS One 12(12): e0189576.
- Villace-Molineno T, Reinares-Lara P, Reinares-Lara E (2016) Multi-Vendor loyalty programs: influencing customer behavioral loyalty? Frontiers in Psychology 7(204): 1-11.
- Wolf EJ, Harrington KM, Clark SL, Miller MW (2013) Sample size requirements for structural equation models: An evaluation of power, bias, and solution propriety. Educational and Psychological Measurement 73(6): 913-934.
- Aman B, Abbas F (2016) Patient's perceptions about the service quality of public hospitals located at District Kohat. Joural Pakistan Med Assoc 66(1): 72-75.
- Hair JRJ F, Black WC, Babin, BJ, Anderson RE (2014) Part 12: Confirmatory factor analysis. Multivariate data analysis, 600-638. (7th )., London, UK: Prentice Hall.
