 Research Article
Abstract
We examine autism prevalence in New Jersey (USA) and its relationship to sulfate in local tap water. Our previous work indicates that sulfate deficiency during early development increases the risk of autism. In this current study, prevalence is obtained from the report “New Jersey Autism Registry” on the state Department of Health website. The report analyzes prevalence for eight-year-old children born in 2006. The sulfate concentration of public water is calculated from test data reported in the Drinking Water Watch database. Counties are grouped into five prevalence ranges and tap water analyzed for the years 2005-2008, a period covering pregnancy through infancy. For this data set, the population weighted sulfate means correlate strongly with prevalence (correlation r=-0.94, n=10, p<0.001). This correlation, the literature and previous work suggest that increasing sulfate in food and water may help reduce the incidence of autism.
Keywords: Autism; Prevalence; Sulfate; New Jersey; Pregnancy; Water
Abbreviations: ASD: Autism Spectrum Disorders; CDC: Disease Control and Prevention; CCR: Consumer Confidence Reports; PWSID: Public Water System Identification Number; IN: Water Inputs; WL: Well Lines; CC: Interconnection Columns; DS: Distribution System; NJAW: New Jersey American Water; EPA: Environmental Protection Agency
Introduction
Autism Spectrum Disorders (ASD) affect social interaction, communication, behavior and the senses. As of 2016, the prevalence was 1 in 54 for the full United States based on data from the Centers for Disease Control and Prevention (CDC). Prevalence in the state of New Jersey was even stronger at 1 in 32, giving New Jersey the highest rate of autism in the country [1]. It is not well understood why this should be true. Reported reasons mention New Jersey’s reputation for good diagnostic services along with a population characterized by high risk factors, including advanced maternal age, elevated premature rates and low birth weights [2]. It is the purpose of our study to introduce another factor, sulfate deficiency during pregnancy and infancy. Toward this end, we calculate sulfate concentrations in local tap water using the New Jersey Drinking Water Watch database. We determine the sulfate content of private well water using Geological Survey Reports and the New Jersey Private Well Water Testing Program. Then, we compare this data with autism prevalence rates for the birth year 2006 from the New Jersey Autism Registry, seeking the strength of correlation. A strong correlation would suggest that ingested sulfate may be a significant factor in the distribution of autism throughout New Jersey. If the correlation is also inverse and sulfate can be shown to be essential for brain development, it would suggest that increasing the sulfate from food and water may reduce the incidence of autism in New Jersey and elsewhere.
Our focus is sulfate, based on our previous study of mothers of children with autism [3]. In that study, 86 mothers were recruited on Facebook and asked to sample the tap water consumed during their pregnancy, which we later analyzed for sulfate. They provided estimates of the types and amounts of tap water, bottled water and beverages they drank while pregnant. Based on US Department of Education public funding records, ASD prevalence rates were calculated for every state. On average, mothers from states with high prevalence submitted tap water with sulfate concentrations measuring much less than from states with low prevalence (28% sulfate, n=45, p=0.059). Considering both water and beverages, daily consumption of sulfate was compared to estimates of autism severity. Linear regression revealed a mild, but clear, inverse correlation between sulfate and severity (correlation r=-0.32, n=86, p<0.01). These results suggest that sulfate may be helpful in reducing both the incidence and severity of autism throughout the United States. And this led to the present investigation of New Jersey, which publishes a wealth of information on autism and public water.
New Jersey Autism Registry
In 2009, New Jersey created the Autism Registry to better serve the needs of children with autism and their families [2]. All children up to 21 years of age, diagnosed with autism and living in New Jersey are required to be registered. Once registered, families are linked to Case Management Services to provide guidance, resources and support. As of the year 2020, over 32,000 children had been included, making this registry the largest in the country. The Autism Registry provides data to the New Jersey Department of Health, enabling a better understanding of ASD [2]. In particular, a graphic is available on their website which presents a map of New Jersey with counties color coded to show relative prevalence. A similar graphic is presented in Figure 1 derived from the New Jersey data. The map strategy focuses on eight-year-old children born in 2006 to best represent a meaningful comparison between counties. New Jersey’s 21 counties are grouped into 5 prevalence ranges which we designate as Zones 1 through 5. Zone 1 includes counties with the lowest prevalence while Zone 5 includes counties with the highest rates of autism. Table 1 tabulates autism prevalence by zone, rate and county, matching that presented graphically in Figure 1. These prevalence rates were obtained from the NJ Autism Registry and are somewhat lower than CDC estimates. This simply reflects a difference in data collection criteria. In our study, we use the NJ Registry percentages to group counties into zones. The populations shown are from the 2010 census to better reflect the 2006 birth year. Throughout our report, we refer to all municipalities as towns, whether or not they are legally incorporated as towns, cities, townships, boroughs, or villages.
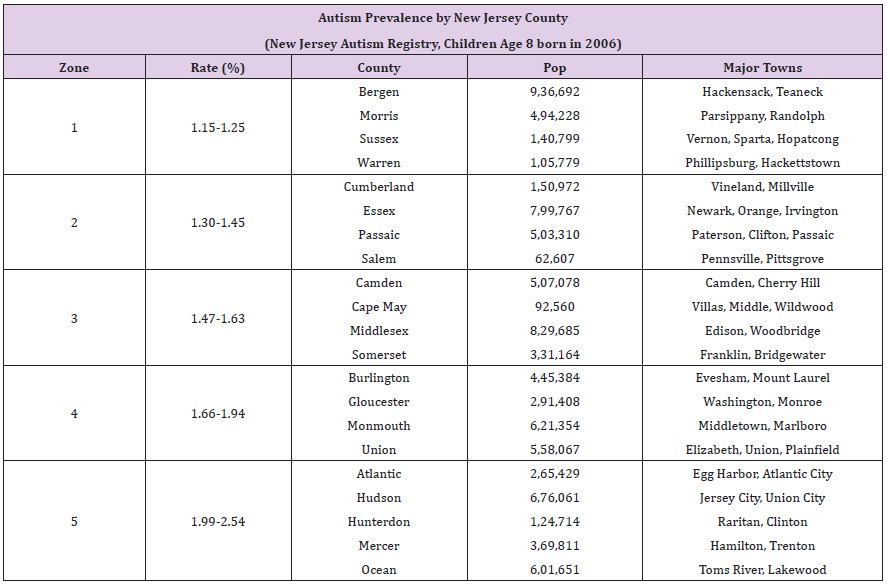
Table 1: Autism Prevalence in New Jersey for Birth Year 2006.
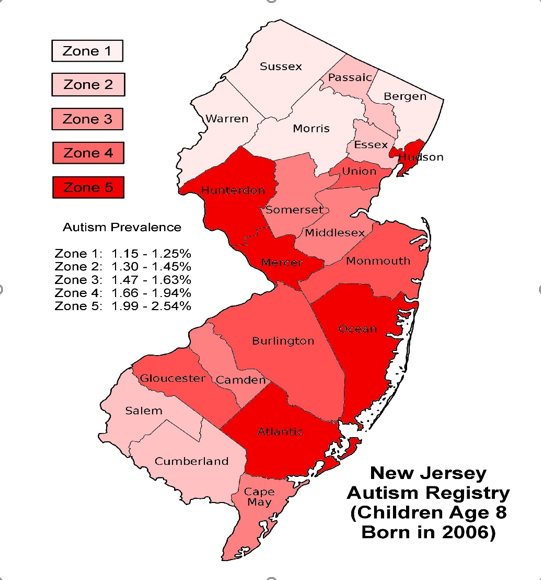
Figure 1: Distribution of Autism in New Jersey for Birth Year 2006.
Public Tap Water
Approximately 87% of New Jersey households are connected to public water systems [4]. There are over 600 such systems in New Jersey and they publish Consumer Confidence Reports (CCR) every year, most available online. Since we are interested in the sulfate concentrations of such water, it would seem these reports would be an invaluable resource. However, sulfate is not considered a serious contaminant and most CCR reports do not include such data. When sulfate is included, it is usually reported as a maximum value at the highest of all system test points. Since our study is more concerned with average values, isolated maximums are not very helpful. In a more general sense, CCR water quality reports do provide a valuable overview of water systems and can offer insight into systems that rely on multiple water sources. This typically occurs when a community buys surface water to supplement local wells. For detailed data on sulfate, the Drinking Water Watch database is a better resource [5]. It is available on the website of the New Jersey Department of Environmental Protection under the heading of the Division of Water Supply and Geoscience. The Drinking Water Watch main page allows one to enter the Public Water System Identification Number (PWSID) of any water source in the state. The PWSID is a seven digit number preceded by the letters NJ for New Jersey. For instance, the Atlantic City PWSID is NJ0102001 and when accessed, the database returns an Atlantic City index page with resource tabs and the following information: source water type is primarily surface water and the population served is 39,415. Using Atlantic City as an example, a better understanding of the water system can be obtained by clicking the Water Watch index tab System Facilities, then All Facilities. The resulting page describes the system in terms of treatment plant test points (TP) which may monitor any of the following: surface water inputs (IN), well lines (WL), interconnection columns (CC) and the distribution system (DS). For Atlantic City, there is 1 surface water intake and 15 well lines, all monitored by TP001005. To obtain sulfate test data, click the index tab Chemical Results, then By Contaminant Name and choose Sulfate from a list of nearly 200 chemicals. For TP001005, sulfate test info is presented twice yearly for the last 26 years. This is a convenient result since only TP001005 need be considered. In the more general case, 16 different test points may have resulted and data may have been reported less regularly.
Private Well Water
For the 13% of New Jersey households connected to private wells, other sources of information are required. To obtain an estimate of typical sulfate concentrations for wells, we access Geological Survey well reports from the NJ Department of Environmental Protection. In particular, we use GSR 19 for Northern Coastal Plain wells, GSR 35 for the Newark Basin and GSR 39 for the Highlands, Valley & Ridge regions [6]. For counties not included in these reports, we use the Drinking Water Watch database to search small water systems exclusively using wells. From these sources, a sulfate concentration average for wells in each county can be calculated. For instance, Bergen county data was collected from 15 wells included in GSR 35 covering the Newark Basin. The resulting mean sulfate concentration was 35.3mg/L with a standard deviation of +10.3mg/L.
There are approximately 1,143,000 New Jersey residents served by about 400,000 private wells across the state. To estimate the number of private wells per county, we relied on the Private Well Testing Act Program, which requires all property sold in New Jersey since 2002 to file well information [7]. Knowing the number of wells sold in each county allows for the calculation of percentages of New Jersey state totals. Continuing with Bergen county as an example, as of 2014, there have been 2,195 Bergen well properties sold out of 86,765 for the entire state of New Jersey. The Bergen percentage is then 2.53%, indicating approximately 28,918 Bergen residents have access to private well water. Of course, this analysis assumes that private well sales uniformly reflect the underlying inventory of property across the state.
Methods
This study’s most challenging task was the determination of sulfate concentrations in tap water for all of New Jersey, which includes over 600 water systems in 21 counties and 565 towns. As discussed in the Introduction, we obtained information from the Water Watch database, CCR and GSR reports along with the Private Well Testing Act Program. To organize data collection, we created 21 spreadsheets, one for each county. Then using Wikipedia, a list of towns in order of population was generated for each county spreadsheet. Where possible, towns were associated with one or more PWSID water systems and the number of residents served by each was noted. A simplified spreadsheet layout is presented in Table 2 displaying data from Passaic County. Complete spreadsheets for all 21 counties are included in the Supplementary Materials. For the paragraphs that follow, key spreadsheet columns are italicized and the fields are described.
Typically for a single Community System, the Town Population would be larger than the number of residents served by a water system, which we label the System Population. For instance, a town may be served by more than a single water system or split between several sources, such as purchased surface water and local wells. To account for such variations, we include the spreadsheet fields labeled Percent (%) and Users, to identify the number of people receiving a particular source of water. In a simple system serving just one town, Users would likely represent 100% of the System Population.
The sample spreadsheet in Table 2, continues with a Tpoint field for the treatment plant test point that monitors sulfate levels. If the Tpoint is without parentheses, the referenced system has just one test point or a single point that is a good representative of a group. If the Tpoint is enclosed in parentheses, there are several test points to be considered, typically described by spreadsheet notes. Most commonly, several points must be averaged to account for data from several wells. Notice that a simple average assumes the flowrates are approximately the same for all wells. This may or may not be entirely accurate, but there is no practical way to obtain a better estimate.
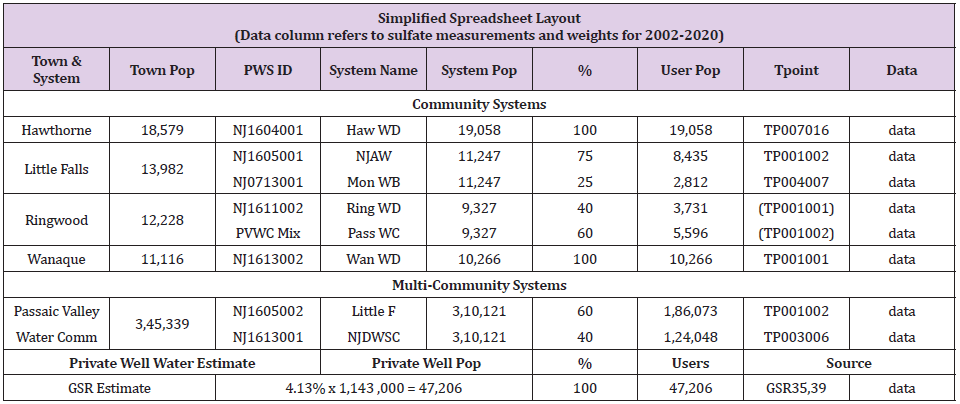
Table 2: Simplified Spreadsheet Layout (Passaic County Data).
Finally, seven Data fields contain sulfate measurements (in units of mg/L) for the years 2002, 2005, 2008, 2011, 2014, 2017 and 2020. Only major systems report sulfate data every year, while most systems usually skip years with a 3 year interval being the most common. Each measurement field is paired with a Weight field, where sulfate concentration is multiplied by the number of Users for that spreadsheet row. When the Weights for all towns are summed and then divided by the total number of Users in the county, a population weighted mean results. This is the sulfate concentration for a typical resident.
Very large systems are included by adding spreadsheet rows for Multi-Community Systems. The Western System owned by New Jersey American Water (NJAW) is an example, providing water to 264,586 residents of 35 towns in Burlington and Camden counties. To determine the allocation of water to each county, we calculate percentages of the populations served in any county to that served by all counties of concern. Then we apply these Percentages to the System Population to obtain the User Population for a given county. Like single towns, these large systems can be characterized by multiple sources of water, each with its unique PWSID. In some cases, it is necessary to break down the system into sub-systems with differing mixtures of water. A good example of this is the NJAW Short Hills System, which serves 217,230 residents of Essex, Morris, Somerset and Union counties, fragmenting into no less than 9 sub-systems.
Private wells are included by adding a single row called Private Well Water Estimate at the bottom of the spreadsheet. For this row, the average sulfate level determined from either Geological Survey Reports or the Water Watch database is entered as a constant value for all years. The Private Well Population is taken from a calculation derived from the Private Well Testing Act Program as previously described. For most counties, the Percentage (which can limit the number of private well Users) is set to 100%. When the sum of all Users in the county exceeds the total county population, Percentage is reduced to prevent a population overflow. It may seem arbitrary to limit the influence of private wells, but well properties may be connected to both wells and public water. In such a situation, one might suspect that the public system is the more likely source for drinking water, reducing the impact of well water for our purposes.
Statistical Analyses
We examine sulfate levels in New Jersey counties and compare against autism prevalence for children born in 2006. County data is reported as the population weighted mean of sulfate concentrations in mg/L. For prevalence zones which aggregate county data, both simple means and population weighted means are considered. All collected data was stored in an Open Office spreadsheet version 4.1.5 by Apache Software. Statistical calculations were performed by the functions AVERAGE, MEDIAN, STDEV, VAR, TTEST, CORREL and FORECAST. Linear regression lines, Pearson correlation coefficients and null hypothesis probabilities are presented throughout the paper. Graphs were created manually within the Open Office word processor.
In addition to the statistical quality of the data, several issues may affect this analysis. The Autism Registry reports prevalence for eight-year-old children in their county of residence. For families that have moved, this may not match their birthplace. Also, tap water represents available sulfate, not necessarily sulfate actually ingested by the mother or infant. It is quite common in today’s world to replace some tap water with bottled water. And sulfate from other sources, such as beverages and food, are not considered. Hopefully, such factors are reasonably uniform across counties, making comparisons appropriate. A strong correlation between sulfate and autism is suggestive of a causative relationship but not sufficient to prove it. Such proof must arise from independent evidence showing sulfate to be directly involved and capable of causation. This issue is examined in the Discussion with reference to published medical literature, detailing dysfunctional sulfur metabolism within autism and the consequences of sulfate restriction.
Results
Sulfate measurements from water systems in the Water Watch database form the basis of spreadsheets for the 21 counties of New Jersey. The results are summarized by prevalence zone, county and year in Table 3. Per the New Jersey Autism Registry, Zone 1 counties have the lowest prevalence of autism for the birth year 2006. Each yearly estimate of sulfate is the weighted mean of measurements of tap water for all towns within a county with populations typically exceeding 1% of the county population. For any given town, sulfate reporting may be from a single test point or the average of many points. And the measurement frequency ranges from once every 3 years to several samples per year. As such, these results are informed estimates rather than samples from a uniform data set.
To examine the correlation between autism prevalence and tap water sulfate, linear regression analysis is applied to this data. The years 2005 and 2008 are chosen to best represent the drinking water available to mothers during pregnancy and to children during early infancy for the birth year 2006. Two regressions are considered, simple means and population weighted means as shown in Table 4. For simple means, there are 42 data points, one for each of 21 counties in years 2005 and 2008. This highlights how well each county fits into the 5 prevalence groupings. The results show a mild inverse correlation of r=-0.32 for the data set of n=42. The null probability that such a relationship is a fluke of pure chance is estimated at p<0.03, meaning less than 3%. Looking at the data more closely, the four counties Cumberland, Cape May, Hunterdon and Mercer seem to be somewhat out of step with the full group, which lowers the correlation to mild.
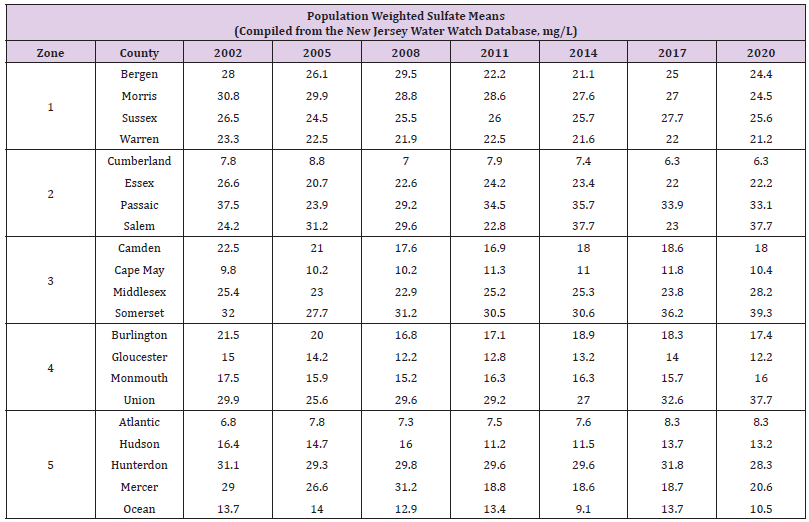
Table 3: Population Weighted Sulfate Means by Year.
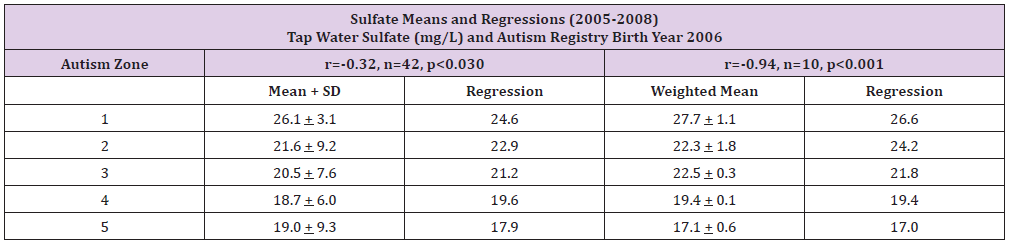
Table 4: Sulfate Means and Linear Regressions (2005-2008).
The second regression examines population weighted means. So, counties with larger populations would have more influence on the weighted means. This better represents the average level of sulfate of typical residents in each prevalence zone. The number of data points for this set is reduced to n=10, a weighted mean for each of the 5 prevalence zones in years 2005 and 2008. The results show a strong inverse correlation of r=-0.94 with a null probability of p<0.001, a very low 0.1%. That is a surprisingly strong correlation between local tap water and the presentation of autism.
Results in Graphical Form
The results are best visualized with the help of line graphs. To illustrate the data in Table 3, sulfate means for prevalence zones are plotted for each 3 year period from 2002 through 2020. Figure 2 presents simple sulfate means. Figure 3 shows population weighted means, to better represent the tap water available to typical residents of a zone. These graphs demonstrate significant separation between zones for most years. Focusing on the years 2005 through 2008, to highlight maternal pregnancy and early infancy for children born in 2006, a cleaner view of sulfate means may be presented. Simple sulfate means (Mean) and population weighted means (W Mean) are shown in Figure 4. For this figure, sulfate means are plotted against each of the 5 prevalence zones. A linear regression of this data is shown in Figure 5, within a standard deviation envelope. As expected, the curves depict a general decline in available sulfate as prevalence increases.
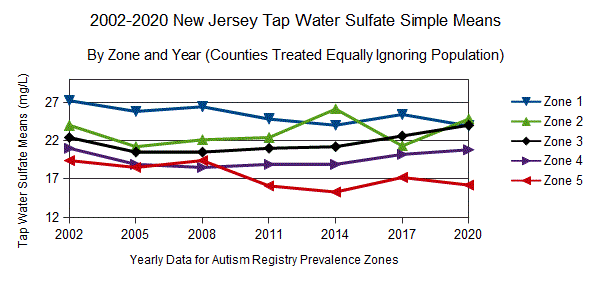
Figure 2: Sulfate in Tap Water Reported as Simple Means.
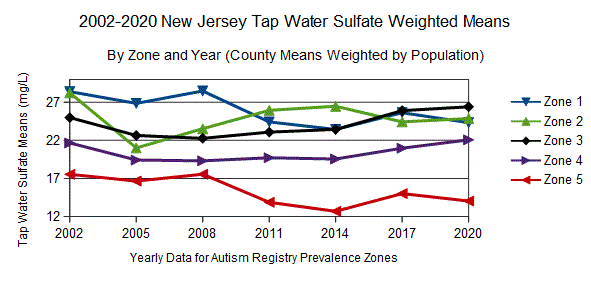
Figure 3: Sulfate in Tap Water Reported as Weighted Means.
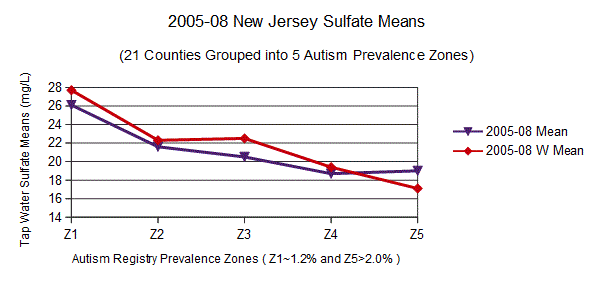
Figure 4: New Jersey Sulfate Means for Years 2005-2008.
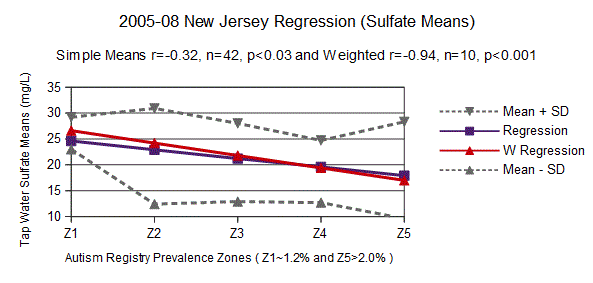
Figure 5: New Jersey Sulfate Regression for Years 2005-2008.
Discussion
Why is sulfate important for autism? One characteristic of autism is dysfunctional sulfur metabolism. In particular, the oxides of sulfur are implicated: sulfur dioxide, sulfite and sulfate (SO2, SO32- and SO42-). Sulfate may be ingested directly or it may be produced as an end product of the transsulfuration pathway. In this pathway, the amino acid methionine contributes sulfur dioxide and sulfite which is finally oxidized by sulfite oxidase enzyme to become sulfate. An English study reports the urine of those with autism contains 50 times the sulfite and double the sulfate of neurotypicals [8]. In an Arizona study that investigated blood sulfate levels, free sulfate was 35% and total sulfate was 72% of non-autistic individuals [9]. In addition, a French study of nasal stem cells found decreased expression of either the molybdenum cofactor sulfurase or aldehyde oxidase genes (MOCOS or AOX) in 91% of a small group (n=11/12) of autistic participants [10]. Both of these genes are part of the molybdenum cofactor pathway, responsible for sulfite oxidase enzyme, among several others. Impaired sulfite oxidase production results in an increase of sulfite as noted above.
Sulfate is a common nutrient and functions in a variety of chemical processes including the development of tissue structure for important organs. During human pregnancy, maternal circulating sulfate levels double during the final trimester. This highlights the importance of sulfate in fetal development [11]. In particular, heparan sulfate is essential for neuron regulation. In studies of mice with compromised heparan sulfate synthesis, symptoms similar to those found in autism resulted, including impairments in social interaction, expression of repetitive behavior and difficulties with vocalization [12]. In humans, the examination of postmortem brain tissue in young individuals showed reduced levels of heparan sulfate for those with autism vs neurotypicals [13]. Finally, sulfate supports sulfonation and sulfotransferase enzymes which help to remove xenobiotics and certain drugs. Through a sulfonate intermediary, sulfate is attached to unwanted chemicals increasing water solubility to facilitate removal [14]. Without sufficient sulfate, developing children may be at heightened risk from environmental toxins.
The working assumption underlying our study is sulfate deficiency coupled with genetic mutations involved with sulfur metabolism are significant risks which may lead to autism. Our results show sulfate in tap water to be strongly correlated (r=-0.94) to the prevalence of autism in New Jersey. Of course, tap water is just a surrogate for all sources of sulfate in the diet of mothers and infants. Water only becomes important when dietary sulfate in food and beverages is restricted and the natural metabolism of methionine falls short. In our study, mean tap water sulfate concentrations differ by a slim 10mg/L between high and low prevalence zones. Such a small difference is probably just the tip of the iceberg. There are clues of this nature in the medical literature. In Waring’s English study 20 years ago, urine was analyzed for those with autism and compared against neurotypicals. The results showed autistic urine to contain 6800μM sulfate compared to a normal reading of 3000. Assuming daily urine discharge at 1.4 liters, the extra sulfate in urine for those with autism was 510mg per day. This suggests that tissue in those with autism may be starved for sulfate. And this assumption is confirmed by Adam’s 2011 Arizona study showing blood levels are below normal, only 35% in the case of free sulfate. Perhaps increasing sulfate consumption by even a fraction of 510mg per day could lower the prevalence of autism in New Jersey.
As noted previously, many factors seem to influence the development of autism, including awareness, medical access, maternal age, prematurity and birth weight. The influence of sulfate must be balanced with these other risk factors. Looking closely at the sulfate results in Table 3, four counties appear to be out of step with the majority: Cumberland, Cape May, Hunterdon and Mercer. For these counties, the influence of sulfate is less important than something else. What might that be? An interesting candidate is wealth as measured by median household income. Hunterdon county has the highest median household income in New Jersey at $100,980 [15]. In fact, Hunterdon is often rated among the wealthiest in the United States. Cumberland reports the lowest income in New Jersey at $50,651. Cape May borders Cumberland and has the second lowest household income in the state. Both have very low levels of sulfate in tap water, yet are in the mid-range for autism prevalence. On the other hand, Hunterdon is bordered by Mercer county and both have higher than average sulfate in water, yet are in the highest prevalence zone. As a possible explanation, consider that higher income elevates autism awareness, quality of medical care and pressure toward delayed maternal age. So even in the presence of higher sulfate, these factors might push Hunterdon and Mercer toward additional cases of autism. Likewise, the low income of Cumberland and Cape May, could reduce the diagnosis of autism by lowering autism awareness, quality of care and age of motherhood.
It’s interesting to examine how New Jersey tap water compares to the rest of the United States. The Environmental Protection Agency (EPA) estimates that the national median sulfate concentration of all public water systems is 24mg/L [16]. The range is near zero to over 600mg/L, suggesting the average would be much higher than the 24mg/L median. The New Jersey average for the last 20 years has been about 21mg/L sulfate. This may help to explain why New Jersey has such a high rate of autism compared to other states. A revealing graphic is presented in Figure 6 showing average sulfate levels in the four most populous New Jersey towns relative to the dotted median for the full country. The Passaic Valley Water Commission (Little Falls and Wanaque Systems) serves the towns of Patterson, Clifton and Passaic. The sulfate concentration of this water is high by New Jersey standards, typically above 40mg/L. On the other hand, Newark (Pequannock and Wanaque Systems) provides water with very little sulfate, typically around 10mg/L. And Jersey City and Elizabeth have low sulfate water similar to Newark. It is important to note that these numbers are for tap water but many households prefer even cleaner water with less sulfate. New Jersey publishes State Health Assessment Data from family surveys which include comments about drinking water habits. In 2013, only 20% of families drank unfiltered tap water while 37% used filtered tap water and 40% preferred bottled water [17]. Note that this data was published before the lead crisis in Newark that certainly must have pushed the percentage for bottled water even higher.
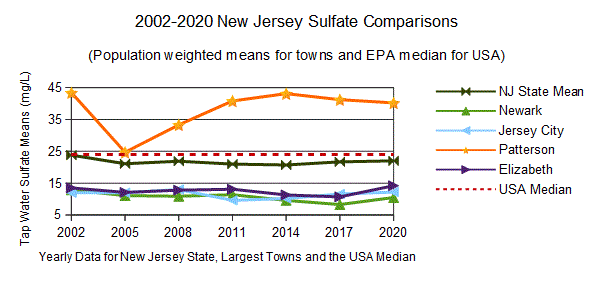
Figure 6: Sulfate Comparisons for Largest New Jersey Towns.
Bottled water is an interesting modern phenomenon, rare 70 years ago when autism was virtually unknown but very common in today’s world. Most bottled water is simply purified local tap water with sulfate and most other minerals completely removed. This is true of Aquafina, Smart Water, Sam’s Choice and most supermarket brands. Sparkletts bottled and/or delivered water measures about 3mg/L. And even Poland Spring, a popular spring water from Maine, has a sulfate concentration of just 5mg/L. (This data is from published water quality reports for these brands or our own tests using a Hanna Instruments Model HI 96751C digital photometer.) Again looking at Figure 6, if Passaic Valley customers reject their tap water and drink 2 liters of purified water instead, they give up 80mg of sulfate every day, perhaps increasing their risk of autism. Bottled water is not the only factor that has reduced sulfate in the modern world. Since the enactment of the Clean Water Act of 1972, the EPA has been tasked with cleaning up public water in all of the United States. Clearly, this is good for the country as it minimizes the microbes and toxins that pose health hazards. Of course, water that has been cleaned to contain fewer contaminates will naturally contain less sulfate. The reduced sulfate content of some tap water and most purified bottled water may be important to our understanding of autism.
Conclusion
Using sulfate in tap water as an indicator for dietary sulfate, we compare the county by county distribution of sulfate in water to the prevalence of autism. We use published prevalence rates from the Autism Registry for the birth year 2006. Then we calculate sulfate concentrations for over 600 water systems as cataloged in the New Jersey Water Watch database. Concentrating on the years 2005- 2008 to represent maternal pregnancy and child development through infancy, we compare the sulfate means for water against autism prevalence in all 21 New Jersey counties. The resulting correlation of a linear regression analysis shows a significant, although mild, relationship between sulfate and autism prevalence. When the simple sulfate means are adjusted to population weighted means to better represent the sulfate available to a typical family, the correlation becomes very strong (correlation r=-0.94, n=10, p<0.001). This is a surprisingly robust indicator even though other factors may likewise contribute to the development of autism. Based on our results, it may be possible to significantly reduce the incidence of autism by supplementing with sulfate rich food and water during pregnancy and early childhood. Examining New Jersey data, increasing sulfate concentrations in tap water by as little as 10mg/L may reduce autism prevalence by meaningful margins. The medical literature shows sulfate to be a necessary nutrient, important for organ development, brain function and toxin removal. In those with autism, blood sulfate concentrations are well below neurotypical levels. Our previous Facebook study correlated autism severity with low sulfate in beverages consumed during pregnancy. Our current study documents a strong correlation between autism prevalence in New Jersey and low sulfate in local tap water. These are very hopeful clues to autism prevention that warrant further investigation.
Declarations
Funding and Conflicts of Interest
This work was funded by Rybett Controls, Inc. The author is both an officer and shareholder of Rybett Controls. He donated his time to this project, receiving no compensation for his involvement. The author has some mild characteristics of autism which has led to his interest in this subject. Interestingly, he was born in Long Beach, California long before the advent of purified, bottled water and where sulfate in tap water is in the 48 to 124mg/L range. He is an electrical engineer with degrees from Caltech. Rybett Controls has no products related to autism except an Amazon book titled Autism, Enzymes and the Brimstone Demons [18]. The research published in this book laid the ground work for the sulfate study described by this paper. The book includes an economical recipe for sulfated water which we whimsically call Brimstone Water. For legal protection, Rybett Controls owns the trademark for Brimstone Water although the recipe is unprotected and freely available for all to use. Neither Rybett Controls nor the author have patents, commercial affiliations or business interests relating to autism and declare no conflicts of interest with this research study other than the book and trademark.
Availability of Data and Material
The Supplementary Material for this article includes a master spreadsheet with sub-sheets that calculate sulfate levels for all 21 New Jersey counties plus a summary. To obtain this spreadsheet, simply send a reasonable request to the author via email ( rybett@ aol.com ). The primary data sets analyzed by this study (Autism Registry prevalence, Water Watch test results, New Jersey GSR reports) are located on the web under References.
Author Contributions and Acknowledgment
All work within this study was performed by the author. The author would like to thank the New Jersey Autism Registry for publishing county by county prevalence rates on their website. Also, the New Jersey Department of Environmental Protection should be congratulated for their user friendly Water Watch database software.
Ethics Approval
The information used in the study was from data sets in which all relevant personally identifiable information had been removed. Prevalence was aggregated by the New Jersey Autism Registry at the county level and published on their website. Therefore, this project did not require institutional review for research with human subjects nor individual consents to participate. This article does not contain studies with animals or plants.
References
- Maenner MJ, Shaw KA, Kelly A Shaw, Jon Baio, Anita Washington, et al. (2020) Prevalence of Autism Spectrum Disorder Among Children Aged 8 Years – Autism and Developmental Disabilities Monitoring Network, 11 Sites, United States, 2016. MMWR Surveillance Summary 69(4): 1-12.
- (2018) Autism Registry. New Jersey Autism Registry. New Jersey Department of Health.
- Williams R (2020) Sulfate Deficiency as a Risk factor for Autism. Journal of Autism & Dev Disorders. Journal of Autism and Developmental Disorders 50: 153-161.
- (2015) NJSHAD. Health Indicator Report of Private Well Usage. New Jersey State Health Assessment Data.
- (2020) Water Watch. Drinking Water Watch Database. New Jersey Department of Environmental Protection.
- (1969) GSR Download. New Jersey Geological Survey Reports.
- (2018) Act Program. Private Well Testing Act Program. New Jersey Department of Environmental Protection.
- Waring RH, Klovrza LV (2000) Sulphur Metabolism in Autism. Journal of Nutritional & Environmental Medicine 10(1): 25-32.
- Adams J, Audhya T, Sharon McDonough-Means, Robert A Rubin, David Quig, et al. (2011) Effect of a Vitamin/Mineral Supplement on Children and Adults with Autism. BMC Pediatrics 11: 111.
- Feron F, Gepner B, E Lacassagne, D Stephan, B Mesnage, et al. (2016) Olfactory Stem Cells Reveal MOCOS as a New Player in Autism Spectrum Disorders. Molecular Psychiatry 21(9): 1215-1224.
- Dawson PA, Elliott A, Bowling FG (2015) Sulphate in Pregnancy. Nutrients MDPI 7(3): 1594-1606.
- Irie F, Badie Mahdavi H, Yu Yamaguchi (2012) Autism-like Socio-communicative Deficits and Stereotypies in Mice Lacking Heparan Sulfate. PNAS USA 109(13): 5052-5056.
- Pearson BL, Corley MJ, Amy Vasconcellos, D Caroline Blanchard, Robert J Blanchard (2013) Heparan Sulfate Deficiency in Autistic Postmortem Brain Tissue from the Subventricular Zone of the Lateral Ventricles. Behav Brain Res 243: 138-145.
- Gamage N, Barnett A, Nadine Hempel, Ronald G Duggleby, Kelly F Windmill, et al. (2005). Human Sulfotransferases and Their Role in Chemical Metabolism. Toxicological Sciences 90(1): 5-22.
- (2006) Wikipedia. List of New Jersey Locations by Per Capita Income. Wikipedia. Accessed September 10, 2020. Based on the 2010 US Census and 2006-2010 American Community Survey 5-Year Estimates.
- (2003) US Environmental Protection Agency. Contaminant Candidate List Regulatory Determination Support Document for Sulfate.
- (2013) NJSHAD. Health Indicator Report of Drinking Water. New Jersey State Health Assessment Data.
- Williams R (2017) Autism, Enzymes and the Brimstone Demons. In: Williams R (Edt.)., Rybett Controls, Inc. ISBN 9781549643989, Amazon ebook and paperback, Chatsworth, CA, USA.
