 Review Article
ABSTRACT
Diabetes Mellitus (DM) is one of the most common chronic disease in the United States affecting approximately 10.5% of the total US population. Diabetic foot disease (DFD) is a common complication of DM that leads to significant morbidity and drives up the associated healthcare costs. The spectrum of DFD extends from superficial and deep soft tissue infection to osseous infections as well as peripheral arterial disease and neuropathy. Radiography and MR imaging plays a vital role in identifying these complications along with the clinical examination. Diffusion weighted imaging (DWI) is a unique MRI sequence that is being increasingly used in conjunction with conventional MRI for musculoskeletal tumors and infections. This review article highlights the optimal technical considerations for DWI and illustrates its role as a problem-solving tool in differentiating the wide spectrum of DFD pathologies and its complementary role to conventional MRI. The reader will be able to use these principles and apply DWI for DFD for the benefit of their patient population.
Keywords: Diabetic Foot Disease; Imaging; MRI; Diffusion Weighted Imaging
Introduction
Diabetes mellitus (DM) is one of the most common chronic
diseases in the United States (US) and worldwide. The National
Diabetes Statistics Report 2020 by the Center of Disease prevention
and Control (CDC) estimates approximately 34.2 million people in
the US alone to be affected with DM (10.5% of total US population),
of which 34.1 million will be more than 18 years of age (13% of
all US adults) [1]. An overwhelming 88 million adults 18 years or
older have prediabetes (34.5% of the adult US population), adding
substantially to the overall burden of the disease [1]. The estimated
total economic burden of diagnosed DM in 2017 was $327 billion
and 1 in 7 healthcare dollars is spent on treating diabetes and its
complications [2]. DM is the leading cause of atraumatic lower
extremity amputations, which accounted for 130,000 hospital
discharges in 2016 (5.6 per 1,000 adults with diabetes) [1].
Diabetic foot and ankle disease include several pathologies
that result from a combination of peripheral neuropathy and
peripheral arterial disease (PAD) [3]. The wide spectrum of
diabetic foot and ankle disease ranges from superficial soft tissues
pathologies like edema, cellulitis, Diabetic foot ulcer (DFU), and
inter-fascial abscess to deeper soft tissue infections like necrotizing
fasciitis, intermuscular abscess, dry and wet gangrene, infected
tenosynovitis and infected bursitis, diabetic myonecrosis and
bone infections, including osteomyelitis (DFO) and intraosseous
abscess. Underlying Charcot’s neuropathy or neuroarthropathy
is commonly associated with such lesions. In addition, charcot
neuroarthropathy (CNA) and DFO often coexist, rendering clinical
diagnosis challenging. PAD is common in patients with DM. Arterial
hypoperfusion can lead to ulceration, delayed wound healing, limb ischemia and gangrene, and may ultimately necessitate amputation.
Early and accurate diagnosis of diabetic foot complications can
reduce patient morbidity, health care costs, and limb amputations
while potentially improving wound healing and quality of life [4].
Imaging, in conjunction with clinical examination, plays a
vital role in the diagnosis and follow-up of DFD. The diagnostic
evaluation often includes a variety of imaging modalities including
radiographs, ultrasound (US), CT, nuclear medicine scintigraphy,
and MRI, each with their own advantages and limitations [4]. Plain
radiographs are cost-effective for screening fractures, advanced
neuroarthropathy, soft tissue swelling and gas, and cortical erosions
of DFO. US assists in identifying and draining soft tissue fluid
collections/abscesses. CT shows fluid collections, gas in necrotizing
fasciitis and cortical erosion / sequestrum. MRI provides accurate
information of both soft tissue and bone pathology and, in
conjunction with a plain radiograph, is usually the imaging modality
of choice for evaluating the extent of musculoskeletal infection.
MRI also renders early diagnosis of CNA and helps differentiate
CNA and DFO from other conditions, such as Gout [5]. Intravenous
gadolinium is often needed to detect soft tissue abscess in the
mound of edema and differentiate simple effusions from synovitis
as well as to characterize sinus tracts [6].
Diffusion weighted imaging (DWI) is being increasingly used
in musculoskeletal imaging in conjunction with traditional MRI
sequences for tumor and infection imaging [7-9]. Hydrogen proton
diffusion refers to the random Brownian motion of the water
molecules, which in the human body live in a complex milieu divided
between extracellular and intracellular compartments. Different
tissues of the human body have different proportions of intra
and extracellular compartments, and hence have characteristic
diffusion properties [10]. DWI also exploits the differences in
diffusion between the normal and abnormal tissues. Typically, more
cellular, protein or pus containing structures exhibit restricted
diffusion, and high intensity on DWI with correspondingly low
intensity on apparent diffusion coefficient (ADC) images. Different
ADC values are seen in various tissues and pathologies, assisting
the the MRI diagnosis of different pathologies in the setting of
DFD. DWI use is still limited to only a few centers despite added
value in conventional MRI [7,8]. This review article highlights the
optimal technical considerations for DWI and discusses its role as
a problem-solving tool in differentiating the wide spectrum of DFD
pathologies. The reader will be able to use these principles and
apply DWI for DFD for the benefit of their patient population.
Diffusion Weighted Imaging
The detailed physics behind the acquisition of DWI is beyond the scope of this article. Briefly, a single-shot echo planar imaging (SS-EPI) technique is used to acquire such images [11]. Two diffusion gradients are applied on either side of the 180-degree refocusing pulse to interrogate information about tissue diffusion. Strength of diffusion gradients is characterized as ‘b’ (diffusion moment) parameter and higher b-values correspond to stronger moments. At least two images, one with no diffusion gradient (b=0 s/mm2) and a second with a diffusion gradient (e.g. b=50-1000 s/ mm2) are needed to mathematically compute an ADC value which quantifies the amount of diffusion at each pixel (9). Bright signal areas on high b-value DWI images with corresponding low ADC values indicate restricted diffusion while a bright area on DWI and high ADC indicates T2 shine through effect [12]. ADC is calculated on a pixel-by-pixel basis, and minimum, maximum, and mean values can be measured, usually expressed as square millimeters per second (mm2/sec) using a complex mathematical equation [11]. For musculoskeletal MRI, b values of 50, 400 and 800 s/ mm2 are commonly acquired. For best technical performance, echo times are kept at minimum, echo spacing should be below 0.7ms, fat suppression is best kept as adiabatic inversion recovery to reduce ghosting artifacts, axial plane of imaging provides the most distortion free imaging, and motion of extremity should be minimized with foot padding or patient comfort during scanning. Typical parameters of DWI are (TR= 6500-8000ms, TE= 56-65ms, slice= 4mm, matrix 128x128, fat suppression= adiabatic inversion recovery, SS-EPI sequence). ROI (region of interest) is placed on the ADC images to evaluate mean and minimum ADC within the lesion for a quantitative assessment. In authors practice, mean ADC is used in almost all circumstances. The range of mean ADC values (x10-3 mm2/s) for the spectrum of MSK infections as described by Kumar et al. are illustrated in Table 1 [8].
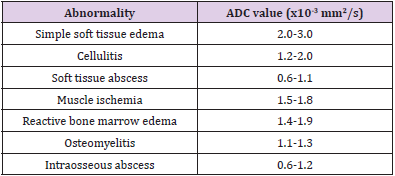
Table 1: Range of ADC values (x10-3 mm2/s) in the spectrum of musculoskeletal infections.
Role of DWI in Diabetic Foot and Ankle Diseases
Soft Tissue Pathologies
Almost all diabetic foot infections begin with a foot ulcer [13]. Subcutaneous noninfectious edema is commonly seen in the diabetic patient population either due to diabetic vascular insufficiency or lymphedema. It is a noninfectious inflammatory condition of the superficial soft tissues, clinically presenting as soft tissue swelling and pain. Cellulitis is a non-necrotizing superficial soft tissue infection usually caused by a breach in the skin surface/ulcer. Staphylococcus aureus and Streptococcus pyogenes are common pathogens responsible for cellulitis [6]. t also clinically presents with soft tissue selling, pain, redness, warmth, and erythema of the superficial soft tissues with accompanied systemic manifestations of fever and malaise. The diagnosis of these conditions is usually clinical, but imaging is often obtained to rule out deeper extent of the infection, which may necessitate intravenous or prolonged course of antibiotics. Conventional MRI shows overlapping features between cellulitis and noninfectious edema with both showing T2 bright superficial soft tissues and skin thickening. Cellulitis shows enhancement of the soft tissues and skin ulceration in addition [14]. On DWI, both entities show T2 shine through effect, less so in cellulitis (ADC= 1.2-2.0) versus noninfectious superficial edema (ADC = 2.0-3.0) (Figure 1). This differentiation helps clinically, as cellulitis, if not adequately managed, may result in further complications such as necrotizing fasciitis, abscess, and gangrene.
Inter-fascial and intermuscular abscess refers to loculated pocket of fluid collection within the fascial plane or in-between muscles. These are fluid like-T2 hyperintense collections with peripheral rim enhancement on post contrast images. In the setting of the DFD with cellulitis, small pockets of fluid collections may be challenging to identify on conventional MRI from the background diffuse mound of hyperintense soft tissue edema. DWI images are particularly helpful in accurately finding these small pockets of abscesses as they typically show restricted diffusion (ADC= 0.6- 1.2). Figure 2 Diffusion in an abscess is extremely slowed due to the presence of inflammatory cells, cellular debris, bacteria, and proteins. DWI helps to identify the deeper extent of a superficial abscess guiding appropriate drainage and management. A study by Harish et al. showed that DWI, in conjunction with other unenhanced MR imaging sequences of the area of interest, lead to similar confidence levels of readers as the post-contrast images in diagnosing abscess [15]. In another study by Unal et al. DWI showed a sensitivity and specificity for detecting soft tissue abscesses of 92% and 80% respectively [16]. DWI also helps differentiate abscess from adventitial bursitis adjacent to DFU or simply necrotic tissue without pus (both showing T2 shine through effect).
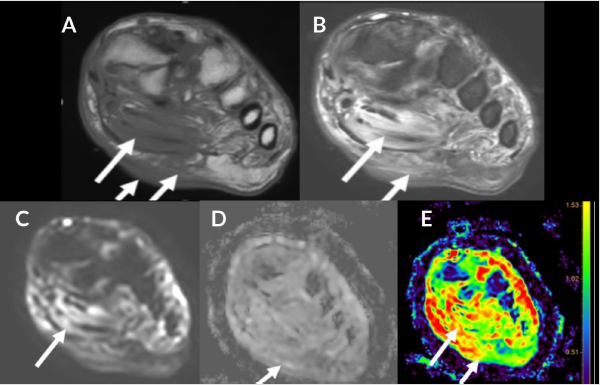
Figure 1: Cellulitis and myositis. Middle aged man with known type II DM presenting with skin ulcer, skin thickening (short arrow), plantar soft tissue swelling (medium arrow) and myositis (long arrow). Axial T1W (A), FS T2 (B), DWI (C), ADC (D), and color map (E). Myositis and cellulitis demonstrate increased signal on DWI (C) and associated enhancement on ADC and color map (D and E) with ADC values 1.6 for myositis and 1.7 x 10⁻³ mm2/s for cellulitis.
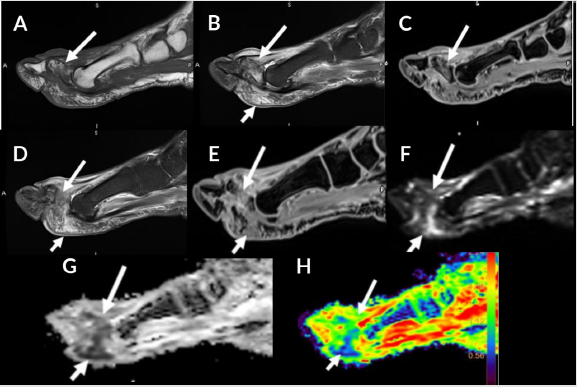
Figure 2: 54-year-old man with proximal phalanx osteomyelitis and abscess. Sagittal T1 (A), T2 FS (B), T1 FS post (C), STIR (D), T1 FS post contrast (E), DWI (F), ADC (G) and color map (H). Osteomyelitis (long arrow) is demonstrated by low T1 signal, edema and enhancement after contrast. Associated osseous enhancement on ADC and color map (green compared to blue in normal marrow). Subcutaneous fluid collection (short arrow) demonstrates restricted diffusion (blue) with ADC of 0.5 x 10⁻³ mm2/s indicative of abscess (E-H).
Infectious tenosynovitis is characterized by infection of the closed
synovial sheath of the tendon [17]. Infected fluid/pus accumulates
within the tendon sheath. DWI images help distinguish it from
mechanical or reactive tenosynovitis as infectious tenosynovitis
will show restricted diffusion. Adjacent joints should be evaluated
to exclude associated septic arthritis. Septic bursitis is also within
the same spectrum of closed synovial space infection, most
commonly affecting superficial bursae likely secondary to direct
inoculation. Again, DWI images help differentiate septic bursitis
from reactive bursitis due to restricted diffusion with infection.
Identification of these two entities is necessary as early treatment
with appropriate antibiotics and surgery or drainage of the infected
bursa, if necessary, can be performed in a timely fashion [17]. In
authors’ experience, accumulation of pus in a soft tissue abscess,
tendon sheath or a bursa, all will have ADC values ranging from 0.6-
1.1 (x10-3 mm2/s). In an abscess with a communicating ulcer or a
draining fistula, the restriction on DWI is more often localized to
the edges of the abscess as opposed to a closed infected cavity.
Necrotizing fasciitis (NF) is a medical emergency characterized
by a rapidly progressing, potentially fatal soft tissue infectious
process. It is usually polymicrobial in etiology. Soft tissue infection
dissecting along the fascial planes without a penetrating injury
or iatrogenic cause is pathognomonic [18]. Historically, presence
of gas in the fascial planes as observed on plain radiographs or
CT is described as a classic imaging finding. However, absence of
air along the fascial planes does not rule out necrotizing fasciitis
in the setting of high clinical suspicion [19]. It is commonly seen
in patients with diabetes and early surgical debridement can be
lifesaving in these cases. MRI is often not performed given the
urgency of these cases and the time taken to perform a complete
MRI. However, MRI has been shown to diagnose NF in earlier stages
where subcutaneous emphysema has not yet developed [20]. In a
study by Kim et al. patients with necrotizing fasciitis showed thick
(≥3 mm) fascial hyperintensity on fat-suppressed T2-weighted
images, or extensive involvement of the deep fascia with low signal
intensity on fat-suppressed T2-weighted images, a focal or diffuse
non-enhancing portion in the deep fascia, and involvement of three
or more compartments in one extremity [21]. DWI can help identify
small inter-fascial or intramuscular abscesses (pyomyositis) in
such setting. Foci of soft tissue air are seen as signal void on all
pulse sequences and exhibit blooming artifact on gradient echo
sequences like DWI [22,23].
Gangrene refers to necrosis of the soft tissues, almost exclusively
seen in DM or PAD patients adjacent to a DFU [24]. It is characterized
as devitalized soft tissue with characteristic nonenhancement on
post contrast imaging (Figure 3). Gangrene is of two types: dry and wet, with dry, usually without infection, and wet indicating
superimposed infection. Wet gangrene can also have soft tissue
emphysema. Air is again seen as blooming artifact on DWI. It has
been proposed that gas associated with wet gangrene is far more
extensive when compared to a penetrating ulcer [25]. Wet gangrene
unless associated with an abscess exhibits T2 shine through effect.
Also, as noted by Ledermann et al., areas of abscess can be masked
within the region of necrotic tissue on routine non-contrast MRI
[24]. DWI can easily find abscess within the devitalized soft tissues.
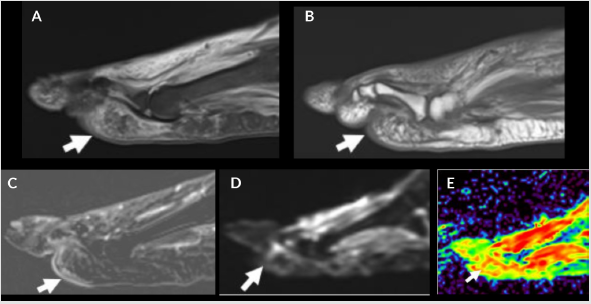
Figure 3: Devitalized tissue and muscle denervation. Sagittal STIR (A), T1 (B), T1 FS post contrast (C), DWI (D) and color map (E). Patchy edema in plantar subcutaneous fat (A and B, arrows) from tissue ischemia with mild enhancement (C, arrow) due to cellulitis. Associated increased signal on DWI (D, arrow) and enhancement (red) on the color map (E, arrow) due to surrounding cellulitis.
Muscle Pathologies
Pyomyositis exhibits T2 hyperintense muscle and peri-epimysial edema. Small intramuscular abscesses may be difficult to recognize without contrast MRI. DWI helps identify localized abscess within the area of myositis. Formation of intramuscular abscess is a hallmark of pyomyositis [23]. DWI also helps in differentiating pyomyositis from diabetic myonecrosis described below, the latter shows only T2 shine through effect [8].
Diabetic myonecrosis is a unique pathologic entity seen in diabetic patients with unknown exact etiology, possibly a result of microangiopathy. Clinical presentation includes acute onset pain, induration, swelling and elevated serum lactate and CPK levels. MRI shows areas of heterogeneous T2 hyper intensity without an intramuscular abscess, as opposed to pyomyositis [26] (Figure 5). DWI assists in recognizing abscess in pyomyositis. Diabetic myonecrosis shows T2 shine through effect with elevated ADC>1.5 (normal muscle ADC= 1.3-1.5). It is prudent to differentiate these two conditions as diabetic myonecrosis is treated conservatively with bed rest, glycemic control and nonsteroidal anti-inflammatory agents whereas pyomyositis may require surgical debridement [27,28].
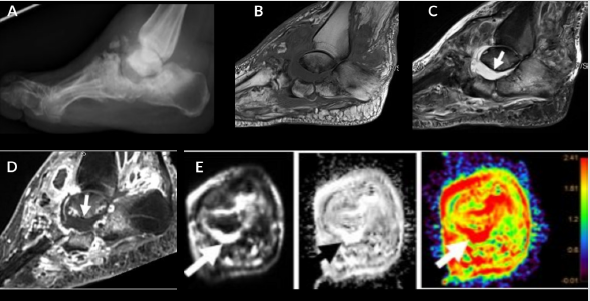
Figure 4: Charcot arthropathy. Lateral foot radiograph (A), sagittal T1 (B), STIR (C), T1 FS post contrast (D), DWI/ADC/color map (E). Osseous destruction and debris in the hindfoot (A and B) with associated osseous edema (B) and enhancement after contrast (C). Fluid collection (short arrow) does not demonstrate restricted diffusion (ADC 2.5 and red on color map) consistent with sterile collection. Corresponding enhancement on ADC and color map imaging (E).
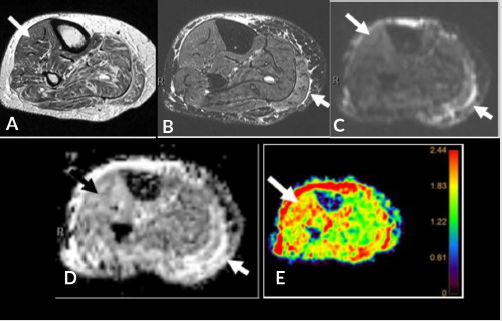
Figure 5: 46-year-old diabetic man with muscle denervation and ischemia, elevated LDH, CPK and serum lactate levels. Axial T1 (A), FS T2 (B), DWI (C), ADC (D) and color map (E). Muscle edema in the medial gastrocnemius (small arrow) readily apparent on the FS T2 sequence; however, DWI and ADC with color map demonstrate enhancement in the anterior compartment (long arrow) indicative of denervation that is not appreciated on the T1 and FS T2 imaging.
Osseous Abnormalities
Diabetic Foot Osteomyelitis (DFO) is one of the most common
complications in diabetics with a foot ulcer. DFO is usually due
to non-healing ulcer and is associated with higher risk of limb
amputation, longer duration of hospital stay, prolonged need of
intravenous antibiotics and delayed wound healing [29]. DFO
can affect any bone but most frequently affects the forefoot and
midfoot [30]. Transtibial amputation is more frequently performed
with DFO involving the hindfoot when compared to the forefoot,
which can be salvaged with below ankle amputation [31]. Early
diagnosis of DFO, i.e. before the development of exposed bone,
extensive ischemia or soft tissue necrosis, is critical for the success
of conservative surgery and can obviate the need for local or highlevel
amputation [32].
MRI is the imaging modality of choice to diagnose osteomyelitis.
The easiest way to diagnose osteomyelitis is to identify the
superficial ulcer and its sinus tract extending to the bone with
confluent marrow signal abnormality [33]. Reactive marrow
edema is identified as T2 hyperintensity without corresponding
T1 hypo intensity while DFO shows confluent T1 hypo intensity
as well. DWI signal is low in the normal bone marrow (ADC= 0.2-
0.4 x 10⁻³ mm2/s), which becomes hyperintense in the settings of
reactive marrow edema and intraosseous or subperiosteal abscess.
In authors experience, ADC of reactive marrow edema falls within
1.4-1.9 x 10⁻³ mm2/s while in osteomyelitis, there is relatively less
ADC enhancement (0.6-1.3 x 10⁻³ mm2/s) (Figures 2,6,7). Eren et
al. showed that DWI supplements conventional MRI without added
intravenous contrast in diagnosing DFO (34). They found the ADC
values were significantly lower in patients with osteomyelitis (0.75
x 10-3 mm2/s) compared to those without osteomyelitis (0.90 x 10⁻³
mm2/s). While ADC values may vary depending upon the scanner
strength and signal of the image, the presence of intra-osseous
abscess reduces the ADC values to below 0.8 x 10⁻³ mm2/s versus its
absence leads to higher ADC values up to 1.3 x 10⁻³ mm2/s in authors’
experience. ADC can also be used to assess treatment response, i.e.
partially treated osteomyelitis will have slightly higher ADC ranging
from 1.4-1.9 x 10⁻³ mm2/s and these values increase with resolution
of abscess and decrease later on with the return of fatty marrow.
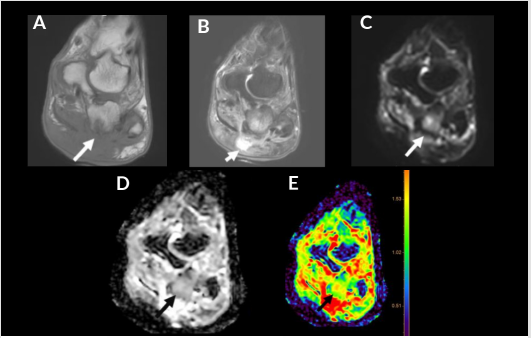
Figure 6: 41-year-old diabetic man with osteomyelitis. Coronal T1 (A), FS T2 (B), DWI (C), ADC (D) and color map (E). Subcutaneous edema and fluid collection (short arrow) with subjacent osteomyelitis of the calcaneus (long arrow) demonstrated by cortical erosion, T1 hypointense signal and enhancement on post contrast imaging. Associated enhancement noted on ADC and color map with an ADC of 1.4 x 10⁻³ mm2/s (green).
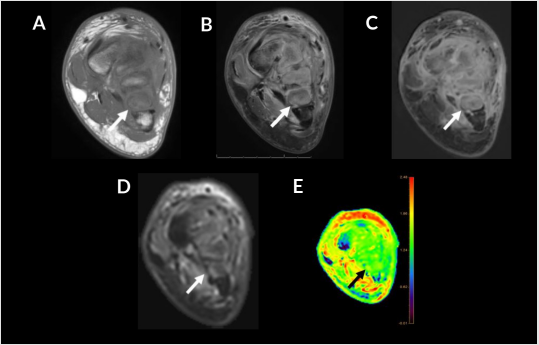
Figure 7: 34-year-old woman with trauma and superimposed osteomyelitis. Coronal T1 (A), FS T2 (B), T1 FS post contrast (C), DWI (D), color map (E). T1 hypointense signal at the metatarsal bases (A, arrow) with cortical edema (B, arrow) and enhancement on post contrast imaging (C, arrow). Cortical hyperintense outline also noted on DWI (D, arrow) and color map with an ADC of 1.5 x 10⁻³ mm2/s (E, arrow, green), blue represents first and fifth metatarsals as control for normal marrow (E).
Diabetes mellitus is currently the most common cause of
neuropathic osteoarthropathy (Figure 4), which most frequently
affects the foot and ankle [35]. Diabetic CNA is a devastating and
disabling complication of diabetic neuropathy. It is characterized
by acute excessive inflammatory response leading to local
osteoporosis and devastating fractures and deformity of the
foot [36]. A severe deformity, in addition to the above described
mechanisms, will result in a secondary ulceration, infection, and
amputation [37]. It is secondary to a combination of peripheral
neuropathy and PAD resulting in decreased proprioception causing
repetitive trauma, ischemia, poor healing, joint instability, cartilage
loss, deformity, and increased new bone formation [38]. CNA often begins in the midfoot, and subluxation usually starts at the second
tarsometatarsal joint [39].
MRI is very sensitive in detection of early changes of CNA as
offloading the extremity can halt or delay the progression of this
devastating disease [40]. Early signs on MRI include bone marrow
edema and soft tissue edema, joint effusion, and eventually
subchondral microfractures [40,41]. Disruption of the Lisfranc
ligament, plantar calcaneo-navicular ligament, and plantar fascia
is seen in early stages, which can result in midfoot collapse and
malalignments [42].
Distinguishing between DFO and CNA is challenging in patients
with diabetes. Ahmadi et al concluded that the presence of a
sinus tract, replacement of soft-tissue fat, fluid collection(s) and
extensive marrow abnormality indicate superimposed infection
[41]. Neuroarthropathy commonly affects the tarsometatarsal and
metatarsophalangeal joints whereas osteomyelitis occurs distal
to the tarsometatarsal joint and in the calcaneus. DFO develops,
almost exclusively, by the contiguous spread of infection from
skin ulceration at predictable sites, whereas CNA is primarily
articular, bilateral, and presents as subchondral cysts [33]. CNA
with superimposed infection further complicates the landscape.
DWI and ADC can play a vital role in differentiating these entities.
A prospective study by Razek et. al. found that the mean ADC
of acute diabetic osteoarthropathy was 1.27 ×10⁻³ mm2/s and
that for diabetic osteomyelitis was 0.86 ×10⁻³ mm2/s. They
established a cut-off ADC value of approximately 1.0 ×10⁻³ mm2/s
to differentiate acute diabetic osteoarthropathy and osteomyelitis
with approximately 94% accuracy [43].
Peripheral Nerve Pathologies
The four prime mechanisms causing hyperglycemic nerve
damage are oxidative stress from the polyol pathway, increased
hexosamine pathway flux, elevated levels of intracellular advanced
glycated end products (AGE) and activation of protein kinase
[44-46]. Excessive oxidative stress and vasoconstriction lead
to ischemia of the nerve cells, nerve cell injury and death [47].
Neuropathy in diabetic patients is manifested in motor, autonomic
and sensory divisions of the nervous system [48]. Damage to
motor nerves leads to atrophy and edema-like T2 signal of the foot
muscles leading to foot deformities and eventually CNA. Autonomic
disturbances lead to dry skin of the foot, predisposing to fissuring
[49]. Sensory neuropathy in extremities lead to loss of sensitivity
to pain, temperature and proprioception resulting in repeated foot
injuries, ulcer formation and/or secondary infection.
Diabetic neuropathy is a well-recognized complication of longstanding
diabetes. Up until recently, nerve conduction studies and
biopsy were the only available options to diagnose peripheral
neuropathy in diabetic patients, demonstrating a loss of myelin
in peroneal and sural nerves [50]. MRI can recognize denervation
changes in the muscles, seen as high signal on DWI and ADC
maps (Figures 5&8). Dedicated peripheral nerve imaging, MR
neurography (MRN) present another avenue to recognize this
complication [51-54]. Anatomic MRN is typically performed using
3D heavily T2W imaging evaluation of peripheral nerves and
regional muscles [55]. More recently, DWI and diffusion tensor
imaging (DTI) neurography have been extensively studied and used
in the assessment of peripheral nerves [56-58]. While the pathologic
nerves exhibit increased T2 signal alteration with or without
enlargement in the setting of neuropathy, DTI in addition exhibits
elevated ADC and low fractional anisotropy (FA) values. DWI and
DTI also depict abnormal muscles with increased conspicuity
as compared to conventional MR images. The recommended
maximum b value for DWI neurography range from 600 to 800 sec/
mm2 to enable adequate visualization of peripheral nerves with
an acceptable signal to noise ratio (SNR) (50). Further research is
ongoing with respect to the use of DTI in diabetic neuropathy to
further refine its clinical and diagnostic utility.
Table 2 illustrates a reference guide for interpretation of DWI
and ADC signal intensities in the spectrum of diabetic foot and
ankle diseases.
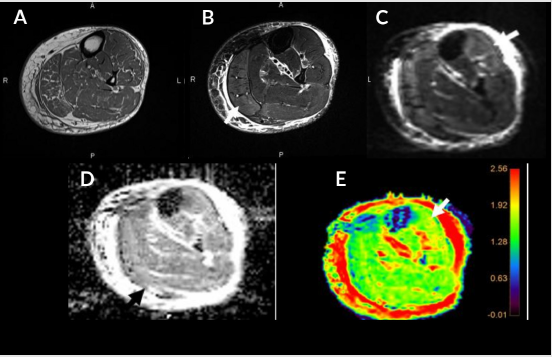
Figure 8: Type II DM with muscle denervation. Axial T1 (A), STIR (B), DWI (C), ADC (D), color map (E). Diffuse muscle fatty replacement demonstrating relative enhancement on DWI (C, arrow), ADC (D, arrow) and color map (E, arrow).
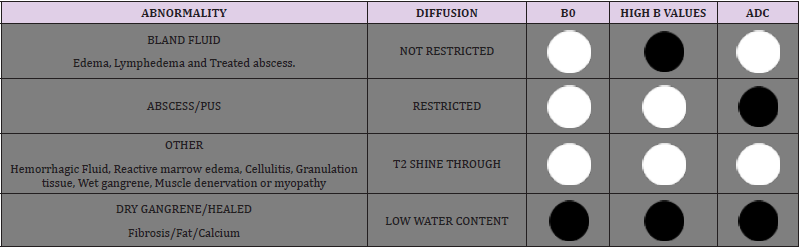
Table 2: Interpretation of diffusion and ADC signal intensities.
Limitations of DWI
It is easier to perform DWI on a 1.5T strength MRI magnet compared to a 3T MRI. Although a 3T MRI has higher SNR, there are usually more susceptibility artifacts due to the increased B0 [11]. SS-EPI sequence is used for DWI, which is also particularly sensitive to susceptibility artifacts induced at tissue boundaries like those occurring at the fat, water, and bone interfaces in the musculoskeletal system [11]. Use of parallel imaging, autoshimming, correction algorithms, and modified radiofrequency pulses (monopolar or bipolar) can mitigate these effects. Use of multishot EPI technique reduces susceptibility artifact, but at the expense of longer acquisition time [59]. Another artifact common to DWI is Eddy currents, seen as contraction or dilation of the image, and overall shift and shear of the image [60]. This occurs due to the rapidly switching on and off, of the radiofrequency gradients. The resulting image distortion can lead to incorrect quantification of ADC values. Newer techniques using rectangular field of view, motion correction and multi-segmented read-out, etc. have improved the image quality with distortion-free acquisition possible in sagittal and coronal planes.
Pitfalls
A common interpretation pitfall of DWI is misidentifying T2 shine through as true restricted diffusion. This can be easily mitigated by simultaneous assessment of the high b value DWI and ADC images. Many malignancies, soft tissue or intraosseous, show restricted diffusion due to increased cellularity and can be misdiagnosed as infection/abscess or vice versa. A thorough understanding of the indication and clinical presentation sometimes may be the only clue to make an accurate diagnosis, as infections can have a very aggressive appearance on imaging. Another common pitfall is the presence of a hematoma. Hematoma in varying stages of evolution may show restricted diffusion and can be confused with underlying infection or tumor (Figure 9). A study by Oka et al, however, did show that the mean ADC value of chronic expanding hematoma (1.55 x10⁻³ mm2/s) was significantly higher than that of malignant soft tissue tumors (0.92 x10⁻³ mm2/s) with no overlap in the minimum ADC values [61]. A knowledge of clinical presentation with recent history of trauma or procedure may help to make an accurate assessment.
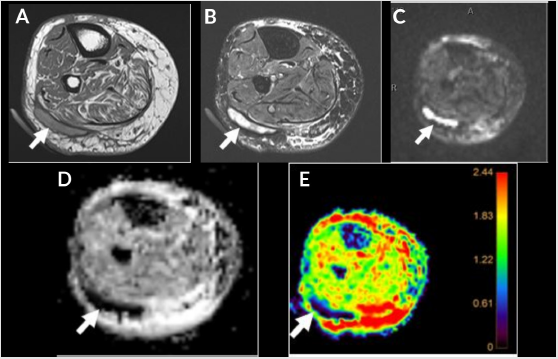
Figure 9: 77-year-old with swelling, subcutaneous hematoma as DWI pitfall. Axial T1 (A), STIR (B), DWI (C), ADC (D), color map (E). T1 intermediate to hyperintense fluid collection (long arrow) that demonstrates restricted diffusion.
The guidelines for choosing the ROI are also not well established, but the darker region on ADC map with corresponding brighter area on DWI map is used by most since theoretically these areas correspond to the regions of most cellularity/infection/abscess [9].
Conclusion
Diabetes-related foot complications are common problems associated with high morbidity and mortality. There is a considerable overlap in the clinical and imaging findings of soft tissue and bone infections in patients with diabetes and neuroarthropathy. Treatment also varies greatly for different complications and relies heavily on an accurate diagnosis. The decision of oral versus systemic antibiotics versus surgical intervention (debridement versus amputation) is based on correctly differentiating DFO from other soft tissue infections [62]. MRI plays a central role in determining the diagnosis and extent of these complications. DWI complements and supplements the conventional MRI evaluation, especially where post contrast imaging is not possible. DWI should always be interpreted in conjunction with conventional MRI and in the light of pertinent clinical information to avoid imaging pitfalls. Knowledge of DWI utility for DFD, can help guide appropriate and timely treatment.
Disclosures
AC: Consultant: ICON Medical and Treace Medical Concepts Inc., Royalties: Jaypee, Wolters.
Conflicts of Interest
None.
References
- (2020) Centers for Disease Control and Prevention. National Diabetes Statistics Report 2020. Atlanta, GA: CDC, U.S. Dept of Health and Human Services.
- (2018) American Diabetes Association. Economic Costs of Diabetes in the U.S. in 2017. Diabetes Care 41: 917‐928.
- Amin N, Doupis J (2016) Diabetic foot disease: from the evaluation of the “foot at risk” to the novel diabetic ulcer treatment modalities. World J Diabetes 7: 153-164.
- Loredo RA, Garcia G, Chhaya S (2007) Medical imaging of the diabetic foot. Clin Podiatric Med Surg 24: 397-424.
- Kothari NA, Pelchovitz DJ, Meyer JS (2001) Imaging of musculoskeletal infections. Radiology Clin North Am 39: 653-671.
- Soldatos T, Durand DJ, Subhawong TK, John A Carrino, Avneesh Chhabra (2012) Magnetic Resonance Imaging of Musculoskeletal Infections: systematic Diagnostic Assessment and Key Points. Acad Radiology 19: 1434-1443.
- Chun CW, Jung JY, Baik JS,Won-Hee Jee , Sun Ki Kim, et al. (2018) Detection of soft-tissue abscess: comparison of diffusion-weighted imaging to contrast-enhanced MRI. J Magnetic Resonance Imaging 47: 60-68.
- Kumar Y, Khaleel M, Boothe E, Haitham Awdeh 3, Vibhor Wadhwa, et al. (2017) Role of Diffusion Weighted Imaging in Musculoskeletal Infections: current Perspectives. Eur Radiology 27: 414-423.
- Bhojwani N, Szpakowski P, Partovi S, Martin H Maurer, U lrich Grosse, et al. (2015) Diffusion-weighted imaging in musculoskeletal radiology-clinical applications and future directions. Quant Imaging Med Surg 5: 740-753.
- Baliyan V, Das CJ, Sharma R, Arun Kumar Gupta (2016) Diffusion weighted imaging: technique and applications. World J Radiolog 8: 785-798.
- Subhawong TK, Jacobs MA, Fayad LM (2014) Insights into quantitative diffusion-weighted MRI for musculoskeletal tumor imaging. AJR Am J Roentgenology 203: 560-572.
- Huda W (2016) Review of Radiologic Physics. 4th ed. Philadelphia PA: Wolters Kluwer: 226-227.
- Lipsky BA, Pecoraro RE, Wheat LJ (1990) The diabetic foot. Soft tissue and bone infection. Infect Dis Clin North Am 4: 409-432.
- Yu JS, Habib P (2009) MR imaging of urgent inflammatory and infectious conditions affecting the soft tissues of the musculoskeletal system. Emerg Radiology 16: 267-276.
- Harish S, Chiavaras MM, Kotnis N, Ryan Rebello (2011) MR imaging of skeletal soft tissue infection: utility of diffusion-weighted imaging in detecting abscess formation. Skeletal Radiology 40: 285-294.
- Unal O, Koparan HI, Avcu S, Ali Murat Kalender, Erol Kisli (2011) The diagnostic value of diffusion-weighted magnetic resonance imaging in soft tissue abscesses. Eur J Radiology 77: 490-494.
- Small LN, Ross JJ (2005) Suppurative Tenosynovitis and Septic Bursitis. Infect Dis Clin North Am 19: 991-1005.
- Chaudhry AA, Baker KS, Gould ES, Rajarsi Gupta (2014) Necrotizing Fasciitis and Its Mimics: what Radiologists Need to Know. Am J Roentgenology 204: 128-139.
- Chang CD, Wu JS (2017) Imaging of Musculoskeletal Soft Tissue Infection. Semin Roentgenology 52: 55-62.
- Ali SZ, Srinivasan S, Peh WCG (2014) MRI in necrotizing fasciitis of the extremities. Br J Radiology 87: 1033.
- Kim KT, Kim YJ, Won Lee J, Youn Jeong Kim, Sun-Won Park, et al. (2011) Can necrotizing infectious fasciitis be differentiated from nonnecrotizing infectious fasciitis with MR imaging? Radiology 259: 816-824.
- Fugitt JB, Puckett ML, Quigley MM, Stewart M Kerr (2004) Necrotizing Fasciitis. RadioGraphics 24: 1472-1476.
- Hayeri MR, Ziai P, Shehata ML, Oleg M Teytelboym, Brady K Huang (2016) Soft-Tissue Infections and Their Imaging Mimics: from Cellulitis to Necrotizing Fasciitis. Radio Graphics 36: 1888-1910.
- Ledermann HP, Schweitzer ME, Morrison WB (2002) Nonenhancing tissue on MR imaging of pedal infection: characterization of necrotic tissue and associated limitations for diagnosis of osteomyelitis and abscess. AJR Am J Roentgenology 178: 215-222.
- Panchbhavi VK, Hecox SE (2006) All that is gas is not gas gangrene: mechanical spread of gas in the soft tissues. A case report. J Bone Joint Surg Am 88: 1345-1348.
- Baker JC, Demertzis JL, Rhodes NG, Daniel E Wessell, David A Rubin (2012) Diabetic musculoskeletal complications and their imaging mimics. Radiogr Rev Publ Radiol Soc N Am Inc 32: 1959-1974.
- Kapur S, McKendry RJ (2005) Treatment and outcomes of diabetic muscle infarction. J Clin Rheumatology Practice Rep Rheum Musculoskeletal Disorders 11: 8-12.
- Horton WB, Taylor JS, Ragland TJ, Angela R Subauste (2015) Diabetic muscle infarction: a systematic review. BMJ Open Diabetes Res Care 3.
- Mutluoglu M, Sivrioglu AK, Eroglu M, Gunalp Uzun, Vedat Turhan, et al. (2013) The implications of the presence of osteomyelitis on outcomes of infected diabetic foot wounds. Scand J Infect Disease 45: 497-503.
- Giurato L, Meloni M, Izzo V, Luigi Uccioli (2017) Osteomyelitis in diabetic foot: a comprehensive overview. World J Diabetes 8: 135-142.
- Faglia E, Clerici G, Caminiti M, Vincenzo Curci, Francesco Somalvico (2013) Influence of osteomyelitis location in the foot of diabetic patients with transtibial amputation. Foot Ankle Int 34: 222-227.
- Aragón-Sánchez FJ, Cabrera-Galván JJ, Quintana-Marrero Y, JL Lázaro-Martínez, E García-Morales, et al. (2008) Outcomes of surgical treatment of diabetic foot osteomyelitis: a series of 185 patients with histopathological confirmation of bone involvement. Diabetologia 51: 1962-1970.
- Donovan A, Schweitzer ME (2010) Use of MR imaging in diagnosing diabetes-related pedal osteomyelitis. Radiogr Rev Publ Radiol Soc N Am Inc 30: 723-736.
- Eren MA, Karakaş E, Torun AN, Tevfik Sabuncu (2019) The Clinical Value of Diffusion-Weighted Magnetic Resonance Imaging in Diabetic Foot Infection. J Am Podiatr Med Association 109: 277-281.
- Jones EA, Manaster BJ, May DA (2000) Neuropathic osteoarthropathy: diagnostic dilemmas and differential diagnosis. Radiogr Rev Publ Radiol Soc N Am Inc 20: 279-293.
- Markakis K, Bowling FL, Boulton AJM (2016) The diabetic foot in 2015: an overview. Diabetes Metab Res Rev 32: 169-178.
- La Fontaine J, Lavery L, Jude E (2016) Current concepts of Charcot foot in diabetic patients. Foot Edinburgh Scotland 26: 7-14.
- Sanverdi SE, Ergen FB, Oznur A (2012) Current challenges in imaging of the diabetic foot. Diabet Foot Ankle 3.
- Sella EJ, Barrette C (1999) Staging of Charcot neuroarthropathy along the medial column of the foot in the diabetic patient. J Foot Ankle Surg Off Publ Am Coll Foot Ankle Surgery 38: 34-40.
- Ergen FB, Sanverdi SE, Oznur A (2013) Charcot foot in diabetes and an update on imaging. Diabet Foot Ankle 4: 3402.
- Ahmadi ME, Morrison WB, Carrino JA, Mark E Schweitzer, Steven M Raikin, et al. (2006) Neuropathic arthropathy of the foot with and without superimposed osteomyelitis: MR imaging characteristics. Radiology 238: 622-631.
- Ledermann HP, Morrison WB (2005) Differential diagnosis of pedal osteomyelitis and diabetic neuroarthropathy: MR Imaging. Semin Musculoskeletal Radiology 9: 272-283.
- Abdel Razek AAK, Samir S (2017) Diagnostic performance of diffusion-weighted MR imaging in differentiation of diabetic osteoarthropathy and osteomyelitis in diabetic foot. Eur J Radiology 89: 221-225.
- Fishman SL, Sonmez H, Basman C, Varinder Singh 3, Leonid Poretsky (2018) The role of advanced glycation end-products in the development of coronary artery disease in patients with and without diabetes mellitus: a review. Mol Medicine 24.
- Huijberts MSP, Schaper NC, Schalkwijk CG (2008) Advanced glycation end products and diabetic foot disease. Diabetes Metab Res Rev 24: 19-24.
- Brownlee M (2005) The Pathobiology of Diabetic Complications: a Unifying Mechanism. Diabetes 54: 1615-1625.
- Clayton W, Elasy TA (2009) A Review of the Pathophysiology, Classification, and Treatment of Foot Ulcers in Diabetic Patients. Clin Diabetes 27:52-58.
- Noor S, Zubair M, Ahmad J (2015) Diabetic foot ulcer--A review on pathophysiology, classification and microbial etiology. Diabetes Metab Syndrome 9: 192-199.
- Moningi S, Nikhar S, Ramachandran G (2018) Autonomic disturbances in diabetes: assessment and anaesthetic implications. Indian J Anaesthesia 62: 575-583.
- Martín Noguerol T, Luna Alcalá A, Beltrán LS, Marta Gómez Cabrera, Jordi Broncano Cabrero, et al. (2017) Advanced MR Imaging Techniques for Differentiation of Neuropathic Arthropathy and Osteomyelitis in the Diabetic Foot. Radiogr Rev Publ Radiol Soc N Am Inc 37: 1161-1180.
- Hlis R, Poh F, Bryarly M, Avneesh Chhabra (2019) Quantitative assessment of diabetic amyotrophy using magnetic resonance neurography-a case-control analysis. Eur Radiology 29: 5910-5919.
- Hlis R, Poh F, Xi Y, Avneesh Chhabra (2019) Diffusion tensor imaging of diabetic amyotrophy. Skeletal Radiology 48: 1705-1713.
- Wu C, Wang G, Zhao Y, Wen Hao, Lianxin Zhao, et al. (2017) Assessment of tibial and common peroneal nerves in diabetic peripheral neuropathy by diffusion tensor imaging: a case control study. Eur Radiology 27: 3523-3531.
- Thakkar RS, Del Grande F, Thawait GK, Gustav Andreisek, John A Carrino, et al. (2012) Spectrum of high-resolution MRI findings in diabetic neuropathy. AJR Am J Roentgenology 199: 407-412.
- Chhabra A, Lee PP, Bizzell C, Theodoros Soldatos (2011) 3 Tesla MR neurography--technique, interpretation, and pitfalls. Skeletal Radiology 40: 1249-1260.
- Vaeggemose M, Pham M, Ringgaard S, Hatice Tankisi, Niels Ejskjaer, et al. (2017) Magnetic Resonance Neurography Visualizes Abnormalities in Sciatic and Tibial Nerves in Patients With Type 1 Diabetes and Neuropathy. Diabetes 66: 1779-1788.
- Vaeggemose M, Pham M, Ringgaard S, Hatice Tankisi 5, Niels Ejskjaer, et al. (2017) Diffusion tensor imaging MR neurography for the detection of polyneuropathy in type 1 diabetes. J Magn Reson Imaging JMRI 45: 1125-1134.
- Pham M, Oikonomou D, Hornung B, Markus Weiler, Sabine Heiland, et al. (2015) Magnetic resonance neurography detects diabetic neuropathy early and with Proximal Predominance. Ann Neurology 78: 939-948.
- Dietrich O, Biffar A, Reiser MF, Andrea Baur-Melnyk (2009) Diffusion-weighted imaging of bone marrow. Semin Musculoskelet Radiology 13: 134-144.
- Le Bihan D, Poupon C, Amadon A, Franck Lethimonnier (2006) Artifacts and pitfalls in diffusion MRI. J Magn Reson Imaging JMRI 24: 478-488.
- Oka K, Yakushiji T, Sato H, Yoshiko Hayashida, Yasuyuki Yamashita, et al. (2008) Ability of diffusion-weighted imaging for the differential diagnosis between chronic expanding hematomas and malignant soft tissue tumors. J Magn Reson Imaging JMRI 28: 1195-1200.
- Bonham P (2001) A critical review of the literature: part I: diagnosing osteomyelitis in patients with diabetes and foot ulcers. J Wound Ostomy Cont Nurs Off Publ Wound Ostomy Cont Nurses Society 28: 73-88.
