 Research Article
ABSTRACT
Purpose: The aim of this study was to examine the surface Electromyogram (EMG) power spectral during an intermittent test with increasing intensity.
Methods: Eighteen sedentary participants (age, 25 ± 4 years; height, 181 ± 3 cm, and weight, 77 ± 7 kg) completed two tests each: a maximum test to determine their physical fitness and a Force-Velocity test (FVt) to examine the EMG evolution of three superficial quadriceps muscles [anterior (RA), Vastus Lateralis (VL), Vastus Medialis (VM)] at each sprint. Results: The increases of the root-mean-square (RMS in arbitrary unit) and mean power frequency (MPF in HZ) of EMG signal were observed for all sprints in RA, VL, and VM. Rapids increase of RMS and MPF up to 4-5th seconds and a plateau or decline towards the 6th second were observed. While for RMS these increases were similar and larger for RF and VL compared to that of VM, for MPF, the result was opposite. We showed early and great implication of RF and VL during rapids actions as sprints on bicycle with slow and low contribution of VM important to the maintenance of effort. It would be important to advise a particular training of the RF and the VL in the cyclists to improve the speed of reaction and, of the VM for the maintenance of this speed. Conclusion: We observed similar times for peaks of stress in surface quadriceps muscles at all sprints despite the increase of power output.Keywords: Electromyographic Signal; Force-Velocity Test; Quadriceps Muscles
Abbreviations: EMG: Electromyogram; FVt: Force-Velocity Test; VL: Vastus Lateralis, VM: Vastus Medialis; IMVC: Isometric Maximal Voluntary Contractions; PSD: Power Spectral Density; sT: Skin Temperature
Introduction
Among the intermittent tests with increasing loads, there is the Force-Velocity test (FVt) which consists of successive sprints of few seconds separated by recovery periods of a few minutes on an ergo cycle as Monark ergo cycle [1] against increasing braking loads. These authors found the increases of the mechanical power with the increase in the braking loads up to a maximal Power Output (POmax) despite the decrease in the pedaling speed, then its decrease despite the increase in the braking loads. The evolution in surface Electromyogram (EMG) power spectral and the Power Output (PO) concomitant with the increased in braking loads during the FVt were reported [2]. They showed an increase in EMG from the start of FVt to the peak load (Lpic), and then its decrease at the Lpic +1 kg. Thus, during the FVt, the muscle fatigue started after Lpic. Rouffet & Hautier (2008) found the root-mean-square (RMS) of EMG of Vastus Lateralis (VL) and Rectus Femoris (RF) muscles during the Isometric Maximal Voluntary Contractions (IMVC) and torque–velocity bicycling tests (T-V) increased from zero to approximately before 4 seconds during T-V and after 5 seconds during IMVC. Their results agreed those of Vandewalle (1987) who suggested the participants to reach the peak of pedaling speed before the end of the sprint (6 seconds). Due to these variations of the time to reach the maximum peak of EMG during intense exercise [3], the other question was to localize the time of muscle fatigue during each sprint of the FVt. For that, the aim of this study was to examine the EMG evolution of RF, VL, and VM of the quadriceps superficial muscles during the FVt to localize the peak of each EMG signal during the six seconds of each sprint.
Methods
Study Design
The approach was to determine the time to attack the peak of the EMG signal during each sprint of the FVt and, to examine if this time depends to the load and to the muscle. So, EMG signal were collected during each sprint in three quadriceps superficial muscles. In order to have good results during the FVt, only athletes suitable for intense and repetitive exercises such as soccer players were selected during maximum exercise tests.
Participants
Eighteen soccer players (age, 25 ± 4 years; height, 181 ± 3 cm, and weight, 77 ± 7 kg) participated in two tests each: a maximum test to determine their physical fitness and a FVt to examine the evolution of RMS and PMF for EMG in RF, VL, and VM at each sprint. Each participant was informed to refrain from doing intense exercise at least two days before the maximal exercise test or FVt. Both tests were performed at ~20°C between 3 and 6 p.m. in a laboratory. All participants were informed of the experimental procedures complying with the ethical standards of Helsinki Declaration as revised in 1989, before giving written their consent to the adhesion of the study.
Procedure
The maximal exercise test allowed the assessment of the
maximal heart rate (HRmax), maximal power output (POmax), and
maximal oxygen uptake (VO2max). The protocol consisted of 2 min
cycling against a workload of 1 kg at 60 rev·min–1 on the ergometer
(824 Monark-Crescent, AB, Varberg, Sweden) as a warm-up, then
the load was increased every 1 min until volitional exhaustion by
0.5 kg. The following criteria:
a) Inability of the participants to maintain the frequency at 60
rev·min-1 in spite of verbal encouragement,
b) Attainment of age-predicted HRmax, and
c) Respiratory exchange ratio greater than 1.10 were used to well
achieve maximum performance. The results allowed selecting
participants having physical capacity to complete a test in
spite of the increase the intensity as the FVt.
HR monitor (Polar Accurex Plus, Polar Electro, Kemple, Finland)
was used for continuously record. An open circuit technique with
the CPX system (Medical Graphics Corporation, St. Paul, Minn.,
USA.) permitted the measures of the oxygen consumption. Each
participant completed the FVt at least three days after the maximal
exercise test on the 824 Monark-Crescent. The FVt consisted of
performing a maximal sprint against each load in a sitting position
for 6 seconds, the maximal time for a participant to attain his
maximal velocity after the starting signal. The accuracy of the
frequency measurement was ± 3.3 ms. The feet were fixed to the
pedals with the toe clips. Each participant started the first sprint
of FVt against a load of 2 kg and then recovered for 5 min before
repeating the 2nd sprint against the load increased by 2 kg. When
the velocity was under 130 rev·min-1, the load was increased by only
1 kg for each sprint to attain more precise the peak load (Lpic) for
the peak power output (POpic). We assumed that the participant
attained the POpic if an additional + 1 kg (Lpic + 1kg) to the Lpic
induced a PO decrease. An automatic system was used to determine
the peak velocity (Vpic) for each load and to calculate the PO as the
product of load and Vpic (F×Vpic).
Surface EMG evolution of VM, RF, and VL were examined during
the FVt for each participant. The EMG signals were collected by
Beckman bipolar surface electrodes (9 mm diameter, physiosystems,
Noisy-le-Grand), spaced by 20 mm distance, placed
over the centre of the belly of each muscle of the right leg of each
participant. The ground electrode was placed at the right wrist.
EMG signals were conditioned and stored on magnetic tape (TEAC R-71, TEAC Corp., Tokyo, Japan), after differential amplification with
bandwidth ranging from 2 Hz to 2 kHz along with the output signal
from the dynamometer. EMG signals were sampled by a spectrum
analyser (model 3582A, Hewlett-Packard, Les Ulis) at 1024 Hz.
Power Spectral Density (PSD) of surface EMG was calculated from
0.5-s time intervals and was defined by 256 points in amplitude and
phase in the 2−514 Hz bandwidth. Each PSD was then computed
and divided into 10 bands, the bandwidth being 24 Hz, except for the
highest band (56 Hz). EMG signals were analysed using acquisition
and spectrum analyzer software (Spatol, Divergent, Compiègne,
France) and a data-computing software (Calvise, Divergent,
Compiègne, France). Calvise software permitted the transformation
of PSD into four parameters, among which were the RMS and the
mean power frequency (MPF) [4]. For each participant, the RMS
and the MPF were determined for RF, VL, and VM at each sprint in
real-time during 6 seconds by the computer.
HR was collected continuously with the same monitor using
during the maximal exercise test. The mean value of five rest minutes
and the higher values after each sprint were conserved for analysis.
For each participant, his blood was collected using microcapillary
tubes at rest (r0) and at three minutes after each sprint by micro
puncture at the fingertips, then the lactate (La) concentration
was analyzed at the end of the FVt using a Mini photometer Plus
LP 20 (Monitor-8, Anglet-France). The skin temperature (sT) was
measured at many periods: r0, three minutes after each sprint.
The single probe thermometer TH-5 (Physitemp Instruments, Inc.,
Clifton, NJ, USA) was applied to the RF to measure the sT. Three
successive measures of the sT were realised at each period and
the largest value was retained. For each sprint, the sT of RF was
considered as the quadriceps muscle sT for each participant.
Statistical Analyses
StatView software (Abacus Concepts, Berkeley, California, USA) was used for all analysis and the results were presented as mean ± standard deviation for POmax, HRmaxth, HRmax, VO2max, and sT during maximal exercise test, then for PO, HR, La, and sT at each braking load during the FVt. Anova one-way analysis of variance with repeated measures was used to illustrate the kinetics of absolutes RMS and MPF data in arbitrary unit (a.u.) obtained at each second during the 6 seconds of each sprint. Then, RMS and MPF were illustrated in curve for each sprint for all participants in real time. The curves of RF, VL, and VM were then compared to determine the degree of the participation of each quadriceps superficial muscles during the FVt.
Results
The mean theoretical maximum heart rate (HRmaxth) was 194 ± 3 bpm. The Maximal aerobic power (POmax = 265±33 w), maximal oxygen uptake (VO2max = 45.8 ± 2.3 mL/min/kg), and maximal heart rate (HRmax = 181 ± 6 bpm), respiratory ratio (1.14 ± 0.02), and skin temperature (sT = 34.6 ± 0.6 °C) were obtained during the maximal incremental exercise test. Table 1 showed the Heart Rate (HR), lactate (La), skin Temperature (sT), and Power Output (PO). The values of the four parameters increased simultaneously with the increase of the load. The peak of sT were attained with the attack of the peak of PO (POpic) at the peak load (Lpic = 8.7 kg). The values of sT decreased at Lpic+1kg like that of the PO. In contrast, after the Lpic, the value of the HR and that of La continued to increase despite the decrease of the PO at the Lpic + 1 kg (9.7 kg). During the FVt, the RMS and PMF increased with the increase of load until Lpic and decreased with Lpic+1kg (Figure 1). At each sprint of the FVt, the curves of RMS and MPF of RF, VL, and VM increased quickly from zero about 4th second, then remained stable or decreased until 6th second. The RMS curves of RF and VL evolved similar from the start to the end of each sprint and were larger than those of VM. In contract, the MPF curves of RF and VL evolved similar from the start to the end of each sprint and were lower than those of VM.
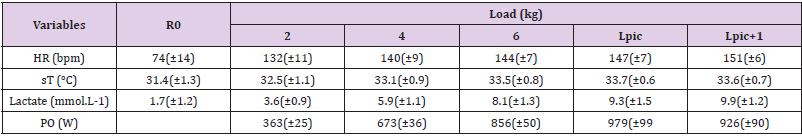
Table 1: Physiological responses during Force velocity test.
Note: HR: Heart Rate, La: Lactate, sT: skin Temperature, and PO: Power Output
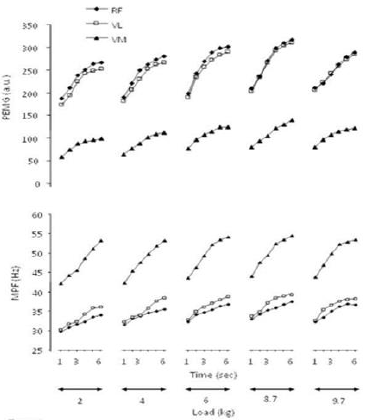
Figure 1. Quadriceps suvitroperficial muscles RMS and MPF evolution at each sprint during the FVt.
Note: RA: rectus femoris, VL: vastus lateralis, VM: vastus medialis, RMS: root-mean-square, and MPF: mean power frequency.
Discussion
The main result of this study was a rapid increase of EMG signals of the three superficial muscles of the quadriceps from the start of each sprint until 4-5 seconds, then a tendency to form a plateau or a decline until the end of the 6th second. This increase of EMG signals could inform on the muscle activity illustrated by RMS which was greater for the RF and VL muscles than for the VM muscle at all sprints. On the other hand, these increases in the activities of the three muscles became more significant with the increase in loads until the peak power reached at the load peak (Lpic). Then a slight drop in the activities of the three muscles was observed with Lpic + 1kg. Muscle fatigue was illustrated by smaller increases in the MFP of RF and VL muscles compared to that of VM whose intervention in FVt was late regardless of the braking load. The participants of this study had anthropometric characteristics similar to those of league (1 and 2) or national soccer players [4-6]. The average age of the participants in this study was similar to that of European soccer players (25 years) and lower than that of 2018 World Cup soccer players (27.4 years). As for the anthropometric parameters, the participants of this study had an average size and an average weight similar to those of the 2018 World Cup soccer players (181.7 cm and 77 kg). The physiological conditions (POmax, HRmaxth, VO2max, and HRmax) of the participants of this study recalled their level of physical activity as sedentary. The participants in the present study had a lower HRmax than their own HRmaxth. Their POmax and VO2max were lower than those of professional and even amateur soccer players [6-9]. This study just needed adult’s participants able to participate in a rough test on an ergocycle (the forcevelocity test) to avoid as much as possible, cases of accident [10] linked to poor physical condition during this kind of exercise. The increase in PO from 363 ± 25 to 979 ± 99 w (POpic), then its fall to 926 + 90 w on average had shown a change in the gallows of this physical parameter (POpic) of the FVt test. Similar evolutions of HR and EMG signals concomitant with that of PO have shown a close relationship between physical and physiological parameters during FVt [11-14]. The POpic obtained by sedentary participants in this study was considerable if we compare it to those reported by Vadewalle (1987). These authors had obtained 1221 ± 192 w in 26 ± 6 year old rugby attackers, 1021 ± 152 w in 26 ± 3 year old soccer players and 813 ± 137 w in 29 ± 5 year old recreational players. The successive evolutions of HR, lactate and sT associated with those of PO could also be considered. However, if the HR and the La had evolved in the form of a gallop from 2kg to Lpic+1kg with the PO, the sT had increased until the end of FVt. It had gone from 31.4 + 1.3 at the rest to 34.1 + 0.8 ° C at the end of FVt. These results showed that the sT evolved in a linear fashion with the increase in braking force during this kind of exercise and not as a function of mechanical power like HR or lactate. At all sprints, the evolution of the RMS and MPF of RF, VL or and VM during pedaling presented in Figure 1 showed the level of participation of these three superficial quadriceps muscle. The EMG signals of these muscles were previously illustrated. The significant increase in RMS for RF and VL compared to that of VM showed a strong participation of RF and VL compared to that of VM during each sprint. The decrease in RMS of RF, VL and VM after 4-5 seconds during each sprint could illustrate muscle fatigue. This suggests that a muscle gets fatigue just after a few seconds (4-5 seconds) when it is used at a very high speed regardless of resistance. This muscular fatigue was well illustrated with the presentation of the MPF of RF, VL and VM. Fatigue was much greater for RF and VL than for VM. The MPF of VM was higher above those of RF and VL for all sprints. This result agreed that of Camata (2011). These authors found the RF more stressed earlier and tired more quickly than VL and VM. However, the increase in RMS of RF, VL and VM with that of load from 2 kg to Lpic despite the decrease of speed could show the dominant effect of force on speed during cycling. Also, the significant increase in the MPF (illustrating the fatigue level) of RF and VL compared to that of VM with the increase in the load could show more the influence of the force on the speed during the FVt. These simultaneous increases in RMS, MPF, HR, and La with that in PO agreed with the study of Temfemo (2011).
Acknowledgement
The authors thank all the participants and the members of the Physiology and Medicine of Physical Activity and Sports (UPM-APS) of the University of Douala for their collaboration.
Funding
No.
References
- Camata TV, Altimari LR, Bortolotti H, Dantas JL, Fontes EB, et al. (2011) Eelectromyographic activity and rate of muscle fatigue of the quadriceps femoris during cycling exercise in the severe domain. J Strength Cond Res 25(9): 2537-2543.
- Corluka M, Bjelica D, Gardasevic J, Vasiljevic I (2019) Anthropometric Characteristics of Elite Soccer Players from Bosnia and Herzegovina and Montenegro. J Anthr Sport Phys Educ 3(3): 11-15.
- Iannetta D, Qahtani A, Millet GY, Murias JM (2017) Quadriceps Muscles O2 Extraction and EMG Breakpoints during a Ramp Incremental Test. Front Physiol 8: 686.
- Jobson SA, Hopker J, Arkesteijn M, Passfield L (2013) Inter- and intra-session reliability of muscle activity patterns during cycling. J Electromyography and Kinesiology 23(1): 230-237.
- Kubayi A, Paul Y, Mahlangu P, Toriola A (2017) Physical Performance and Anthropometric Characteristics of Male South African University Soccer Players. Journal of Human Kinetics 60: 153-158.
- Popovic S, Akpinar S, Jaksic D, Matic R, Bjelica D (2013) Comparative study of anthropometric measurement and body composition between elite soccer and basketball players. Int J Morphol 31(2): 461-467.
- Rouffet DM, Hautier CA (2008) EMG Normalization to Study Muscle Activation in Cycling. J Electr Kinesiol 18(5): 866-878.
- Souissi H, Chtourou H, Chaouachi A, Chamari K, Souissi N, et al. (2012) Time-of-day effects on EMG parameters during the Wingate test in boys. Journal of Sports Science and Medicine 11(3): 380-386.
- Temfemo A, Bishop D, Merzouk A, Gayda M, Ahmaïdi S (2006) Effects of prior exercise on force-velocity test performance and quadriceps EMG. Int J Sports Med 27(3): 212-209.
- Temfemo A, Carling C, Ahmaidi S (2011) Relationship between power output, lactate, skin temperature, and muscle activity during brief repeated exercises with increasing intensity. J Strength Cond Res 25(4): 915-921.
- Temfemo A, Laparadis C, Bishop D, Merzouk A, Ahmaidi S (2007) Are there differences in performance, metabolism, and quadriceps muscle activity in black African and Caucasian athletes during brief intermittent and intense exercise? J Physiol Sci 57(4): 203-210.
- Tønnessen E, Hem E, Leirstein S, Haugen T, Seiler S (2013) Maximal Aerobic Power Characteristics of Male Professional Soccer Players, 1989–2012. Int J Sports Physiol Perform 8(3): 323-329.
- Vandewalle H, Peres G, Heller J, Panel J, Monod H (1987) Force-velocity relationship and maximal power on a cycle ergometer Correlation with the height of a vertical jump. Eur J Appl Physiol 55(6): 650-656.
- Wells CM, Edwards AM, Winter EM, Pysh MI, Drust B (2012) Sport-specific fitness testing differentiates professional from amateur soccer players where VO2max and VO2kinetics do not. J Sports Med Phys Fitnes 52(3): 245-254.
