 Research Article
ABSTRACT
Aminothymoquinone (ATQ) which exhibits five times more potent anticancer activity against pancreatic cancer has been crystallized and its single crystal structure has been reported in the present work. The crystal structure analysis of ATQ reveals that it crystallises in a monoclinic P21/c group. Additionally its interaction with the major transport protein of human blood circulation human serum albumin (HSA) has been examined using a multitude of spectroscopic techniques and molecular docking studies. Analysis of the fluorescence quenching data showed a moderate binding affinity between ATQ and HSA with a 1:1 stoichiometry. Fluorescence analysis of the binding data and molecular simulation results suggested involvement of hydrophobic and van der Waals forces, as well as hydrogen bonding in the complex formation. The number of binding sites and binding constant estimated from the fluorescence studies yielded values of 0.716 and 3.0334 x 10⁵ mol L-1 respectively. Competitive drug displacement and molecular docking results suggested the binding site of ATQ on HSA as Sudlow’s site I, located at subdomain IIA which was supported by the molecular modelling data..
Keywords: Human Serum Albumin; Anticancer Drugs
Abbreviations:TQ: Thymoquinone; NFκB: Nuclear Factor Kappa B; EGCG: Epigallocatechin Gallate; 5-FU: 5-Fluorouracil; HAS: Human Serum Albumin; ATQ: Aminothymoquinone
Introduction
The bioactive compound derived from the oil of Nigella sativa seeds is thymoquinone (TQ), which has been shown to exhibit antitumor activities, including anti-proliferative and pro-apoptotic effects on cell lines derived from several types of cancers like breast, colon, ovary, larynx, lung, myeloblastic leukemia and osteosarcoma [1-6]. It also inhibits prostate cancer by making androgen receptor and transcription factor E2F as targets [7,8] and also induces apoptosis in tumor cells by reducing the activity of nuclear factor kappa B (NF-κB), Akt activation and extracellular signal-regulated kinase signaling, by inhibiting tumor angiogenesis [9-11]. Studies have revealed that preexposure of cells with TQ followed by gemcitabine or oxaliplatin resulted in significant growth inhibition compared with 15% to 25% when gemcitabine or oxaliplatin was used alone. This activity was found to be mediated by down-regulation of Bcl-2 family, NF-κB, and NF-κB-dependent anti-apoptotic genes. It is also shown that NF-κB was inactivated in animal tumors pretreated with TQ followed by gemcitabine and/ or oxaliplatin [12]. The growth inhibitory properties of TQ was shown to be mediated by down-regulation of NF-κB 73, while other mechanisms like decrease in phosphorylation of Akt, reduction of p73-dependant cell cycle checkpoint signaling and increase in cellular concentration of p53 and p21 proteins have also found to be involved in TQ-induced apoptosis in cancer cells [13]. TQ was found to enhance the efficacy of doxorubicin against breast cancer [13], epigallocatechin gallate (EGCG)against prostate cancer,[14] gemcitabine and/or oxaliplatin against pancreatic cancer12 and 5-fluorouracil (5-FU) against gastric and colon cancers [15,16]. In order to enhance the significance of TQ several analogs are synthesized which include disubstituted benzoquinones10 and terpene conjugates [17]. Recently, we have reported the synthesis and characterization of novel TQ analogs amongst which aminothymoquinone exhibited promising activity against pancreatic cancer cells.
Since the efficiency of the drug is highly influenced by its interaction with human serum albumin (HSA) which is present in ample amount in the circulatory system. HSA performs a number of functions in colloid osmotic pressure of plasma [18] and also acts as a reservoir for signaling nitric oxide molecules [19]. The chief function of HSA has been to transport a number of endogenous compounds like fatty acids, hormones like thyroxine and number of renal toxins. Numbers of metabolites compete in binding the drug to the protein [20]. Ligand binding to HSA is a spontaneous exchange between solution and the protein pocket. HSA has the noteworthy ability to bind to a range of compounds including metabolites and drugs under similar physiological conditions and hence is of great pharmaceutical interest in the drug discovery process. The binding properties of 66kDa monomer HSA have been studied with great interest on a significant number of drugs but have been hampered by the flexible nature of the protein and its multiple binding sites [18,19]. In the current paper we explain the crystal structure of ATQ along with its interaction with the most abundant protein human serum albumin [HSA] under physiological conditions (Figure 1).
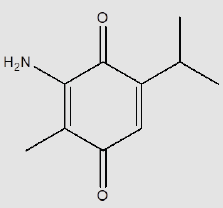
Figure 1:Structure of ATQ.
Material and Methods
Materials
All chemicals, HSA fraction V, sodium chloride, trishydrochloride buffer (pH 7.4), thymoquinone, sodium azide, ibuprofen and bilirubin were purchased from Sigma-Aldrich Chemical Company. All chemicals were used without further purification. The solution of HSA (molecular weight = 66,500 Dalton) was prepared in 50mM tris-HCl buffer. All other reagents used were analytical grade and the aqueous solutions were made in double distilled water for all the experimental measurements. ATQ was synthesized according to procedure described by us earlier [18]. By refluxing the mixture of TQ (1mmole, 0.164g), sodium azide (1.3mmole, 0.084g) and 3ml glacial acetic acid in ethanol for three hours [18]. The stock solution of ATQ was prepared in dimethyl sulphoxide.
Absorption Spectroscopy
The absorption spectra were recorded using a JASCO V-630 Spectrophotometer. Aqueous solution of human serum albumin (5mM) was prepared in 50mM Tris -HCl buffer (pH 7.4). The ATQ (10mM) solution was prepared in dimethyl sulphoxide solvent followed by successive dilutions in distilled water. The absorption spectrum of ATQ was recorded followed by successive spectra with increased concentration of HSA (0.2mM to 2.8mM). Absorbance spectra were also recorded for the aqueous solution of ATQ and varied concentrations of ATQ-HSA complex [21].
Fluorescence Spectroscopy
The fluorescence experiments were carried out on FP-8200 spectrofluorimeter (JASCO) using a quartz cuvette of 1cm path length. The excitation and emission bandwidth were 5nm each and the excitation wavelength was set at 285nm. The fluorescence spectra are measured within the range of 200-750nm. The fluorescence measurements were carried out by titrating 100μM HSA in 3ml Tris- HCL buffer with 100μL of ATQ (50mM) solutions. The titrations were done using micropipettes of varied volume [22]. To elucidate the binding site of ATQ in HSA competitive site binding experiments were carried out using bilirubin (specific site marker for site I) [23] and ibuprofen (specific site marker for site I) [24]. The concentration of HSA, bilirubin and ibuprofen were kept 100μM. Equimolar solution of HSA and bilirubin were prepared and titrated with ATQ solution to record the spectra. The excitation wavelength for HSA was adjusted at 285 nm and the spectra were recorded within the range 200 to 500nm. The ibuprofen and HSA complex is prepared by mixing equimolar concentration of both the constituents and then titrating the complex with ATQ solution to observe the binding site [24].
Molecular Docking Studies
Molecular docking, visualization and drawing simulation were performed using AutoDock 4.2 [25] and AutoDockTools 1.5.4(ADT) [26] and PYmol. The structure of ATQ was drawn using ChemDraw and was copied as smilies while its PDB structure was obtained from 3D corina which is an online software. Using AutoDock software the ligand is cleaned and converted into PDBQT file. Three crystal structures of HSA (PDB IDs: 1BM0, 2.5 A° resolution; 2BXD, 3.05 A° and 2BXF, 2.95 A°) were selected for docking in various cavities from the Protein Data Bank [27]. All water and ligand molecules were removed from the structures, and the atomic coordinates of only chain A of these crystal structures were stored in a separate file and used as input. During the docking process, the protein was kept rigid, while all the torsional bonds of ligand were allowed free rotation. The ligand binding site of the protein was defined by a 70-70-70 grid point with a grid space of 0.375 A°. In subdomain IIA, the grid boxes had a centre at x =35.26, y = 32.41 and z = 36.46 for 1BM0; x=5.101, y= 213.346, z= 7.444 for 2BXD and x=1.333, y=210.093, z= 8.189 for 2BXF. However, for subdomain IIIA, the grid boxes had a centre at (14.42, 23.55, 23.21), (15.226, 4.383, 27.693) and (5.276, 4.635, 210.078), for 1BM0, 2BXD and 2BXF, respectively. A total of 10 runs for each binding site were evaluated to determine binding site. The protein-ligand complex was visualized and analysed using Pymol viewer [28].
Results and Discussion
Crystal Structure of ATQ
ATQ crystallises in a monoclinic P21/c group and the corresponding ORTEP plot is shown in the (Figure 2). The relevant crystallographic parameters are provided (Table 1) and selected bond lengths, bond angles and torsional angles are listed in Table 2. The C1=O1 bond length is 1.237 Å, whereas the C4=O2 bond length is 1.225 Å which is in consistent with aromatic carbon oxygen double bond (R). The C3-N1 bond length is 1.349 Å which is in consistent with aromatic C-N single bond length(R). ATQ molecule has an electron donating -NH2 group at C3 (Figure 3A), which exhibits the electron donating resonance effect. The C1-C2 bond length (1.449(2) Å) is smaller thanC1-C6 bond length (1.487(2) Å) and C1-O bond length (1.2378(18) Å) is more than C4-O bond length (1.2255(18) Å), these differences can be attributed to asymmetric charge distribution in the molecule. The same factor generates a considerable difference between C2-C3 bond length (1.362(2) Å) and C5-C6 bond length (1.333(2) Å). The C=O bond length for C1-O and C4-O are in the range of typical carbonyl bond lengths and the bond angles for the carbon atoms of quinone rings are in range of sp2 hybrid carbon.
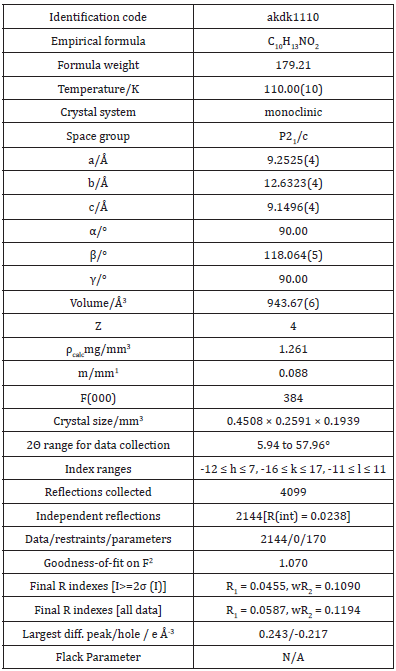
Table 1: Body mass index of the patients over a year.
UV-Visible Spectra
The absorption spectrum of drugs mostly varies on addition of proteins due to the binding of the drug to the protein [29-30]. The absorption spectrum of ATQ shows absorption maxima at 325nm (Figure 3A) in Tris HCl buffer solution of pH-7.4. The addition of HSA to the ATQ solution results in increasing the absorbance due to ATQHSA complex formation. On addition of HSA, the complex formation increases resulting in rising the absorbance. The binding between ATQ and HSA was investigated by keeping the concentration of ATQ constant at 10μM and varying HSA concentration from 0 to 360μM in 0.1mM Tris-HCl buffer at pH 7.4. ATQ showed (Figure 3A). Addition of HSA to ATQ showed significant increase in the absorption band. Assuming 1:1 complex, the association constant of HSA with ATQ interaction was determined by applying Benesi- Hilderland equation 2 [30].
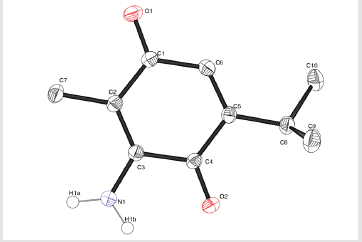
Figure 2:Crystal Structure of ATQ.
Figure 3:Quenching of fluorescence of HSA-bilirubin complex with addition of ATQ, Quenching of fluorescence of HSA-ibuprofen complex on addition of ATQ.
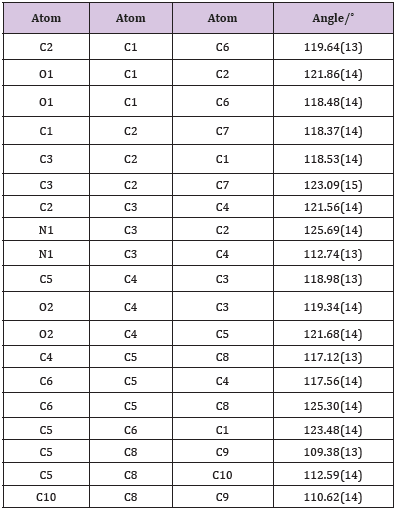
Table 2: Bond Angles for ATQ.
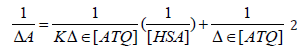
where ΔA is change in the absorbance with and without the protein, Dε the differential extinction coefficient, K is the association constant and [HSA] and [ATQ] represent the concentrations of HSA and ATQ, respectively (Figure 3B). This Benesi-Hildebrand equation yielded the association constant and the extinction coefficient from the graph of {1/ΔA} versus {1/ [HSA]} (Figure 1) as 5.7x 10⁴ mol L-1 and 2.46 LmoL-1 respectively.
Fluorescence Quenching Analysis
The fluorescence quenching of the protein on binding to the drug is used to predict the drug-protein interaction and the binding affinity between ATQ- HSA. The decrease in the quantum yield of the fluorophore induced is ascribed to a variety of molecular interactions with the quencher molecule and is termed as fluorescence quenching. The protein undergoes conformational change on binding with small molecules; these small molecules alter the intra-molecular forces involved in the maintenance of secondary structure of HAS [31]. The conformational changes is investigated by measuring the intrinsic fluorescence intensity of the protein in presence and absence of ATQ. The intrinsic fluorescence intensity of HSA decreases on addition of ATQ as shown in Figure 4A.There is no significant change in the emission maxima of HSA at 345nm after the addition of ATQ. HSA contains a single polypeptide of 585 amino acids with only one tryptophan (Trp 214) situated in subdomain II A and its emission dominates HSA fluorescence spectra in the UV region. On interaction of other molecules with HSA, tryptophan fluorescence may change depending on the direct quenching effect or conformational changes on the protein due to this interaction. Results from fluorescence measurements can be used to estimate the binding constant of lipid-protein complex using the equation 1:
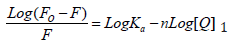
Figure 4: Quenching of HSA fluorescence with increasing concentration of ATQ, Stern-Vomer plot of HSA on addition of ATQ.
Where Fo is initial fluorescence intensity and fluorescence intensities in the presence of quenching agent (or drug molecule) is F. K is the quenching constant also known as Stern-Volmer quenching constant, [Q] is the molar concentration of quencher and F is the fraction of accessible fluorophores to a polar quencher, which indicates the fractional fluorescence contribution of the total emission for an interaction with a quencher which is hydrophobic. The plot of {Fo/(Fo−F)} vs 1/[Q] yields F−1 as the intercept on y axis and (f K)−1 as the slope (Figure 4B). Thus, the ratio of the ordinate and the slope gives K. The reduction of fluorescence intensity of HSA was analysed at 345nm for HSA-drug systems. The binding constant and the number of binding sites estimated from the above equation are 3.0334 x 10⁵ mol L-1 and 0.716 respectively. The crystal structure reports revealed that HSA contains three homologous α-helical domains (I-III), each of which is composed of two subdomains A and B. According to Sudlow’s nomenclature, two primary sites (1 and 2) have been identified for ligand binding to HSA. Bilirubin, a compound formed on breakdown of heme, and ibuprofen, a non-steroidal anti-inflammatory agent, have been considered as conventional ligands for Sudlow’s sites 1 and 2 respectively. Bilirubin binds to Sudlow’s site 1, located in subdomain IIA, whereas ibuprofen prefers Sudlow’s site 2, located in subdomain IIIA. In addition a secondary binding cleft has been found for ibuprofen located at the interface between subdomains IIA and IIB [32-34].
To identify the binding site of ATQ on HSA, the site marker competitive experiments were carried out using drugs (bilirubin and ibuprofen) that specifically bind to known sites or region on HSA. The information about the ATQ binding site can be achieved by monitoring the changes in the fluorescence of ATQ bound HSA that are brought about by site I (bilirubin) and site II (ibuprofen) markers (Figure 5). In the site marker competitive experiment, ATQ was gradually added to the solution of HSA and site markers mixed in equimolar concentrations (1.0×10⁻⁵mol·L-1). As shown in Figure 5A with the addition of bilirubin into HSA, the maximum emission wavelength of HSA undergoes an obvious red shift. Consequently, with the addition of ATQ, the fluorescence intensity of the HSA decreased gradually accompanied by an increase of wavelength emission maximum in the albumin spectrum. This suggests an increased polarity of the region surrounding the tryptophan site (Trp-214) [35] and indicating that the binging of ATQ to HSA was affected by addition of bilirubin. Figure 5B shows the comparison of the fluorescence spectra of the ATQ-HSA system in the absence and presence of ibuprofen. By contrast, with the addition of ibuprofen, the fluorescence intensity of the ATQ-HSA system was almost the same as in the absence of ibuprofen, which indicated that ibuprofen does not prevent the binding of ATQ in its usual binding location. To support the competitive site binding experiments, molecular docking study was done and is discussed in the further section (Table 3).
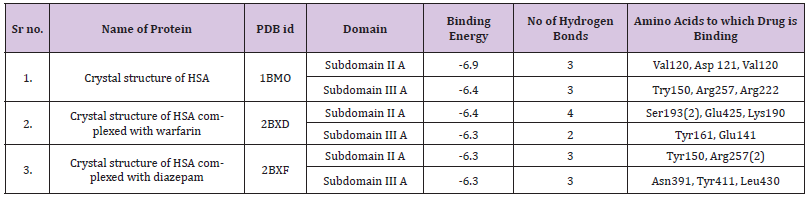
Table 3: Docking results of ATQ in different PDB ID’s of HAS.
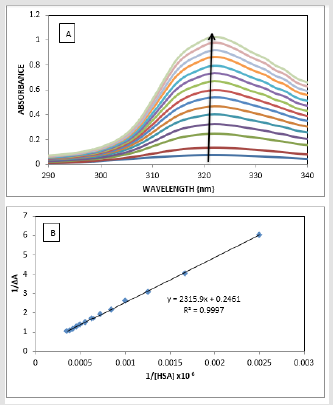
Figure 5:Absorption spectra of ATQ with increasing concentration of HSA, Benesi- Hilderland plot of ATQ with increasing concentration of HAS.
Molecular Modelling Studies
A docking simulation of the interaction between ATQ and HSA was conducted using the AutoDock software package to interpret the binding mode of the ligand on the protein for the two main ligand binding sites, I and II; and to support the results of the ligand displacement experiments described above. Multiple crystal structures of HSA, i.e., 1BM0, 2BXD and 2BXF were analysed to ensure the robustness of the simulation method. The crystal structures of 2BXD and 2BXF were chosen for the study as HSA is reported as a complex with warfarin and diazepam, respectively [36]. Since, HSA is reportedly known to bind to warfarin at site I and diazepam at site II, [18,37] the docking analysis using these structures may show an insight of the binding preference of ATQ to either site I or site II of HSA. The docking simulation of HSA (1BM0) - ATQ was analysed due to the fact that 1BM0 has the highest resolution [38]. The binding energy of ATQ with 1BM0 and 2BXD is -6.4Kcal/mole. The binding energy of 2BXF is higher than 1BM0 and 2BXD.This can be very well seen in Table 4. ATQ forms a variable number of hydrogen bonds in the HSA cavity. There are number of hydrophobic interactions between hydrophobic residues of the protein and the benzene rings of the ligand which are believed to add towards the stability of the docking conformation of ATQ inside this binding pocket. However, the interaction between ATQ and HSA cannot be presumed to be exclusively hydrophobic in nature, since there were several polar residues in the vicinity of the bound ligand that may participate in the polar interactions with the hydrophilic groups of ATQ. Hence, it can be concluded that ATQ binds to a hydrophobic pocket located in the subdomain IIA.
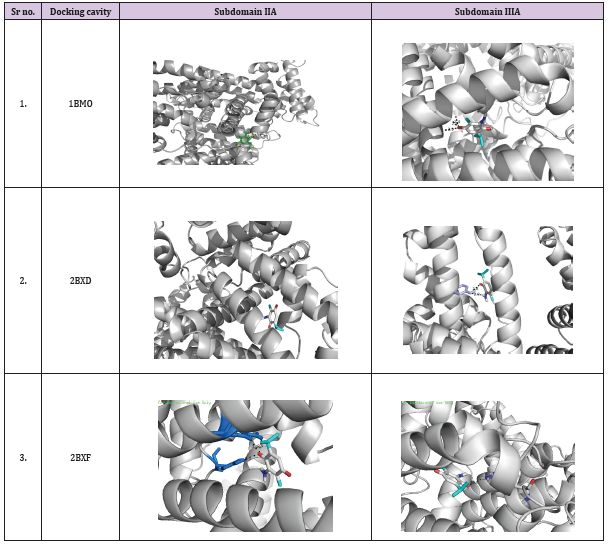
Table 4: Docking images of ATQ in different PDB ID’s of HAS.
Conclusion
In present study we report the monoclinic P21/c group crystallization of ATQ and also provide a quantitative analysis of ATQ-HSA interaction at physiological conditions. The fluorescence and molecular modelling data suggests involvement of van der Waals forces as well as hydrophobic and hydrogen bonding interactions in the complexation between ATQ and HSA. Alterations in the protein conformation upon ATQ binding were evident from the multiple spectroscopic results. The binding site of ATQ on HSA was confirmed as site I based on competitive ligand displacement results as well as docking analysis. The biological implication of this work lies in understanding the interaction of ATQ with HSA, which will be vital for the future designing of ATQ-derived drugs.
References
- Ebru U, Burak U, Yusuf S, Reyhan B, Arif K, et al. (2008) Cardioprotective effects of Nigella sativa oil on cyclosporine A-induced cardiotoxicity in rats. Basic Clin Pharmacol Toxicol 103(6): 574-580.
- Shabana A, El Menyar A, Asim M, Al Azzeh H, Al TH (2013) Cardiovascular Benefits of Black Cumin (Nigella sativa). Cardiovasc Toxicol 13(1): 9.
- Nagi Mahmoud, Mansour Mahmoud (2000) Protective effect of thymoquinone against doxorubicin-induced cardiotoxicity in rats: A possible mechanism of protection Pharmacological Research 41(3): 283-239.
- Ulu R, Dogukan A, Tuzcu M, Gencoglu H, Ulas M, et al. (2012) Regulation of renal organic anion and cation transporters by thymoquinone in cisplatin induced kidney injury. Food Chem Toxicol 50(5): 1675-1679.
- Mahmoud N Nagi, Othman A Al Shabanah, Mohamed M Hafez, Mohamed M Sayed Ahmed (2010) Thymoquinone supplementation attenuates cyclophosphamide-induced cardiotoxicity in rats. J Biochem Mol Toxicol 25(3): 135-142.
- Woo CC, Kumar AP, Sethi G, Tan KH (2012) Thymoquinone: potential cure for inflammatory disorders and cancer. Biochem Pharmacol 83(4): 443-451.
- Bai T, Lian LH, Wu YL, Wan Y, Nan JX (2013) Thymoquinone attenuates liver fibrosis via PI3K and TLR4 signaling pathways in activated hepatic stellate cells. Int Immunopharmacol 15(2): 275-281.
- Aksoy O, Chicas A, Zeng T, Zhao Z, McCurrach M, et al. (2012) The atypical E2F family member E2F7 couples the p53 and RB pathways during cellular senescence. Genes Dev 26: 1546-1557.
- Banerjee S, Padhye S, Azmi A, Wang Z, Philip PA, et al. (2010) Review on Molecular and Therapeutic Potential of Thymoquinone in Cancer. Nutr Cancer 62(7): 938-946.
- Banerjee S, Azmi AS, Padhye S, Singh MW, Baruah JB, et al. (2010) Structure-Activity Studies on Therapeutic Potential of Thymoquinone Analogs in Pancreatic Cancer. Pharm Res 27(6): 1146-1158.
- Radad K, Hassanein K, Al Shraim M, Moldzio R, Rausch WD (2014) Exp Toxicol Pathol 66: 13.
- Banerjee S, Kaseb AO, Wang Z, Kong D, Mohammad M, et al. (2009) Antitumor activity of gemcitabine and oxaliplatin is augmented by thymoquinone in pancreatic cancer. Cancer Res 69(13): 5575-5583.
- Arafa e, Zhu Q, Shah Z I, Wani G, Barakat BM, et al. (2011) Thymoquinone up-regulates PTEN expression and induces apoptosis in doxorubicin-resistant human breast cancer cells. Mutat.Res. 706(1-2): 28-35.
- Richards LR, Jones P, Hughes J, Benghuzzi H, Tucci M (2007) The physiological effect of conventional treatment with epigallocatechin-3-gallate, thymoquinone, and tannic acid on the LNCaP cell line. Biomed Sci Instrum 42: 357-362.
- Lei X, Liu M, Yang Z, Ji M, Guo X, et al. (2012) Thymoquinone prevents and ameliorates dextran sulfate sodium-induced colitis in mice. Dig Dis Sci 57(9): 2296-2303.
- Norwood AA, Tan M, May M, Tucci M, Benghuzzi H (2006) Comparison of potential chemotherapeutic agents, 5-fluoruracil, green tea, and thymoquinone on colon cancer cells. Biomed Sci Instrum 42: 350-356.
- Effenberger K, Breyer S, Schobert R (2010) Terpene Conjugates of the Nigella sativa Seed‐Oil Constituent Thymoquinone with Enhanced Efficacy in Cancer Cells. 7(1):129-139.
- Theodore Peters (1995) All About Albumin. In: Theodore Peters (Edt.)., Academic Press, USA.
- Ishima Y, Akaike T, Kragh Hansen U, Hiroyama S, Sawa T, et al. (2008) S-Nitrosylated Human Serum Albumin-mediated Cytoprotective Activity Is Enhanced by Fatty Acid Binding. J Biol Chem 283(50): 34966- 34975.
- Kragh Hansen U (1990) Structure and ligand binding properties of human serum albumin. Dan Med Bull 37(1): 57-84.
- Mandeville JS, Froehlich E, Tajmir Riahi HA (2009) Study of curcumin and genistein interactions with human serum albumin. J Pharm Biomed Anal 49(2): 468-474.
- Yue Y, Chen X, Qin J, Yao X (2009) Simultaneous determination of 11 active components in two well-known traditional Chinese medicines by HPLC coupled with diode array detection for quality control. J Pharm Biomed Anal 49(4): 1101-1108.
- Ryan AJ, Chung CW, Curry S (2011) Crystallographic analysis reveals the structural basis of the high-affinity binding of iophenoxic acid to human serum albumin. BMC Struct Biol 11: 18.
- Ranjbar S, Shokoohinia Y, Ghobadi S, Bijari N, Gholamzadeh S, et al. (2013) Studies of the Interaction between Isoimperatorin and Human Serum Albumin by Multispectroscopic Method: Identification of Possible Binding Site of the Compound Using Esterase Activity of the Protein. Scientific World Journal: 305081.
- Goodsell DS, Morris GM, Olson AJ (1996) Automated docking of flexible ligands: applications of AutoDock. J Mol Recognit 9(1): 1-5.
- Sanner MF (1999) Python: a programming language for software integration and development. J Mol Graph Model 17(1): 57-61.
- Berman HM, Westbrook J, Feng Z, Gilliland G, Bhat TN, et al. (2000) The Protein Data Bank. Nucleic Acids Res 28(1): 235-242.
- Shevin R Feroz, Saharuddin B Mohamad, Zarith S D Bakri, Sri NA Malek, Saad Tayyab (2013) Probing the Interaction of a Therapeutic Flavonoid, Pinostrobin with Human Serum Albumin: Multiple Spectroscopic and Molecular Modeling Investigations. PLoS One 8(10): e76067.
- Banerjee A, Basu K, Sengupta PK (2008) Interaction of 7-hydroxyflavone with human serum albumin: a spectroscopic study. J Photochem Photobiol B 90(1): 33-40.
- Patra D, Barakat C, Tafech RM (2012) Study on effect of lipophilic curcumin on sub-domain IIA site of human serum albumin during unfolded and refolded states: a synchronous fluorescence spectroscopic study. Colloids Surf B Biointerfaces 94: 354-361.
- Zsila F, Fitos I (2010) Combination of chiroptical, absorption and fluorescence spectroscopic methods reveals multiple, hydrophobicity-driven human serum albumin binding of the antimalarial atovaquone and related hydroxynaphthoquinone compounds. Org Biomol Chem 8(21): 4905-4914.
- Peyrin E, Guillaume YC, Guinchard C (1999) Characterization of solute binding at human serum albumin site II and its geometry using a biochromatographic approach. Biophys J 77(3): 1206-1212.
- Sudlow G, Birkett DJ, Wade DN (1976) Further characterization of specific drug binding sites on human serum albumin. Mol Pharmacol 12(6): 1052-1061.
- Sudlow G, Birkett DJ, Wade DN (1975) The characterization of two specific drug binding sites on human serum albumin. Mol Pharmacol 11(6): 824-832.
- Heurich M, Altintas Z, Tothill IE (2013) Computational Design of Peptide Ligands for Ochratoxin A. Toxins (Basel) 5(6): 1202-1218.
- Ghuman J, Zunszain PA, Petitpas I, Bhattacharya AA, Otagiri M, et al. (2005) Structural basis of the drug-binding specificity of human serum albumin. J Mol Biol 353(1): 38-52.
- Kragh Hansen U, Chuang VT, Otagiri M (2002) Practical aspects of the ligand-binding and enzymatic properties of human serum albumin. Biol Pharm Bull 25(6): 695-704.
- Sugio S, Kashima A, Mochizuki S, Noda M, Kobayashi K (1999) Crystal structure of human serum albumin at 2.5 A resolution. Protein Eng 12(6): 439-446.
