 Research Article
Abstract
Increased nutritional needs in adolescence due to increased growth rate and body composition changes associated with puberty coincides with other factors that affect adolescents’ food choices, nutrient intake, and consequently, nutritional status. Improper food choice results in malnutrition with its grave consequences. This study was carried out to assess the nutrition knowledge, dietary diversity and nutritional status of adolescents in three Local Government Areas (LGAs) of Ibadan municipality, Oyo State; Nigeria. The descriptive cross-sectional study was carried out among 450 In-school (ISA, 225) and Out-school (OSA, 225) adolescents aged 10-19 years randomly selected from three out of five LGAs. Fifteen secondary schools were randomly selected from the three LGAs. The ISA were selected through systematic random sampling technique, while OSA were recruited from markets, motor parks, mechanic workshops, and shops with adolescent apprentices through snowball technique. Semi-structured, interviewer-administered questionnaire was used to collect data from the respondents. Data were analyzed using descriptive statistics, ANOVA and Chi-square test at p = 0.05. More than half (58.7%) of respondents had poor nutrition knowledge, 70.0%, 28.7% and 1.3% had high, average and low dietary diversity score, respectively, 92.8% had normal height-for-age, 5.7% were mildly stunted and 1.5% severely stunted. Majority (87.3%) of the respondents had normal BMI-for-age, 7.3% were underweight and 4.9% were overweight. No significant correlation was found between BMI-for-age and nutrition knowledge of respondents. The BMI-for-age of In-school adolescents was negatively correlated with dietary diversity scores. In-school respondents had good nutrition knowledge which did not translate to good food habit, while out-of-school respondents had poor nutrition knowledge and good food habit. There is need for nutrition education in the nation’s secondary schools and enlightenment programme for out-
Keywords: Adolescents; Nutritional Status; Dietary Diversity; Nutrition Knowledge
Introduction
Adolescence is a transitional period from childhood to adulthood which normally begins with the onset of signs of puberty, physical and mental development, involving biological, social and psychological changes occurring between 10-19 years of age [1]. Of the 7.2 billion people in the world, about 1.2 billion are adolescents aged 10-19 years, making up 16 per cent of the world population [2]. They constitute about 25 per cent of Nigeria’s population [3] and are critical target population with regard to influencing global public health outcomes. Nutritional needs during adolescence are increased because of increased growth rate and changes in body composition associated with puberty [4,5]. The dramatic increase in energy and nutrient requirements coincides with other factors such as the quest for independence and acceptance by peers, increased mobility, greater time spent at school and/or work activities, and preoccupation with self-image, that may affect adolescents’ food choices and nutrient intake [4]. Due to urbanization, globalization and technological advancement, most adolescents in the urban regions are gradually moving from the traditional diets that are primarily derived from plant-based food sources which are low in fat and high in fibre, to more western diets that are energy dense, high in fats and sugars, and low in fibre; coupled with little or no physical activity. Population-based surveys have found that adolescents often fail to meet dietary recommendations for overall nutritional status and for specific nutrient intakes [6,7].
According to the report of Abdulkarim, et al. [8], 28.8% of adolescents are malnourished in Nigeria (13.2% overweight, 11.3% stunted, 2.6% obese, and 1.7% wasted) [8]. Adequate nutrition can play significant role in prevention of several chronic diseases, including obesity, coronary heart disease, and certain types of cancer, stroke, and type-2 diabetes [9]. To help prevent diet-related chronic diseases, researchers have proposed that healthy eating behaviours should be established in childhood and maintained during adolescence [10-13]. However, the relationship between nutrition knowledge, food habit, dietary diversity and nutritional status of in-school and out-of-school adolescents has not been adequately researched in Nigeria. This study therefore, seeks to provide information on in- and out-of-school adolescents’ nutrition knowledge, food habit, and dietary diversity in relation to their nutritional status.
Methodology
The descriptive cross-sectional study was carried out in three randomly selected urban Local Government Areas (LGAs) namely Ibadan North, Ibadan Northeast and Ibadan Northwest among the five LGAs in Ibadan municipality. A total of 450 (225 In-school and 225 Out-of-school) adolescents were recruited for the study. A Five-section pre–tested interviewer-administered, semi-structured questionnaire was used to collect data on socioeconomic, demographic and household characteristics, nutrition knowledge, dietary diversity and anthropometric indices of the respondents. Nutrition knowledge was measured on a twelve-point knowledge scale which was rated as ≤8 – poor knowledge, and ≥8 – good knowledge. Dietary diversity questionnaire was used to gather information on individual dietary diversity score (IDDS) of the adolescents using the FAO recommendations [14], by scoring the number of foods consumed from each of the 14 food groups. Anthropometric measurements were done using a stadiometer to measure height and weighing scale to measure weight.
Data were analysed using descriptive statistics, Chi-square test, t-test, ANOVA and correlation at p<0.05. Anthropometric data was analysed using WHO Anthroplus to obtain BMI-for-age according to the World Health Organisation (WHO) cut-off points [1]. Ethical approval for the study was obtained from the University of Ibadan/ UCH Ethical Review Committee. Permission to collect data was obtained from the Chairmen of the LGAs, LGA Education Inspector, School Principals, Heads of Motor Parks and Market Leaders. Additionally, informed consent was obtained from the respondents before the data collection.
Results
Socio-Demographic Characteristics of the Respondents
Table 1 shows the socio-demographic characteristics of the respondents. More than half (52.2%) of thee were male (46.2% in-school, 58.2% out-of-school) while female respondents were 47.8% (53.8% in-school, 41.8% out-of-school). Mean age of inschool respondents was 15.2±1.3 years, while that of out-of- school was 16.9±1.7 years. Majority (83.8%) of the respondents fell within 15-19 years age category (76.4% in-school, 91.1% out-of-school) while only 16.2% were within the ages of 10-14 years. Majority (85.4%) also were Yoruba, 8.9% Igbo, 1.3% Hausa and 4.4% other ethnic groups; with 56.2% being Christians, 43.8% Muslims, and 74.2% were from monogamous family with 56.2% having less than five siblings in the family. Socio-demographic characteristics were significantly associated with adolescent’s sex, age category, ethnicity, religion, family type and number of siblings for both inand out-of-school adolescents (p<0.05).
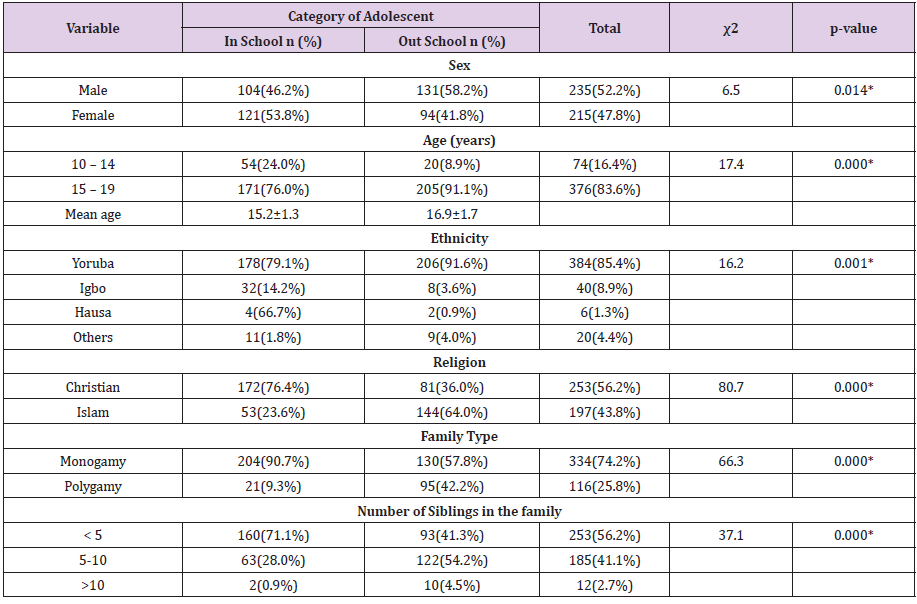
Table 1: Socio-demographic Characteristics of Respondents.
Note: * - Values are significantly different at p < 0.05;
n = number of respondents
Socio-Economic Characteristics of the Respondents
For the socio-economic characteristics of the respondents, 40.5% (69.3% and 11.6% in-school and out-of-school) of respondents’ fathers had tertiary education, 38.2% (22.2% and 54.2% in-school and out-of-school) had secondary education, 13.3% (7.6%, and 19.1% in-school and out-of-school) had primary education, while 8.0% (0.9% and 15.1% in-school and out-of-school) had no formal education, respectively (Table 2). The proportion of in-school respondents’ fathers and mothers who had tertiary education were significantly higher than that of out-of-school respondents’ parents (p<0.05). Majority of the outof- school respondents’ fathers were artisans (83.3%), or farmers (65%) or traders (50.9%), compared with 4.5%, 3.1%, and 23.5% for in-school respondents, respectively (p<0.05). Majority (61.3%) of the respondents’ mothers were traders (48.9% in-school, 73.8% out-of-school), 13.1% teachers (22.2% in-school, 4.0% out-ofschool), 7.1% artisans (3.1% in-school, 11.1% out-of-school), while 9.2% (14.7% in-school, and 3.6% out-of-school) were classified as others (p<0.05). Many (46.0%) of the respondents resided in 2 or 3-bedroom flats, 28.0% resided in room and parlour, while 12.9% and 12.4% resided in duplex building and single rooms, respectively. More of the in-school respondents resided in 2 or 3-bedroom flats and duplex (p<0.05), while more of out-of-school respondents resided in single rooms and room and parlour compared with inschool adolescents (p<0.05).
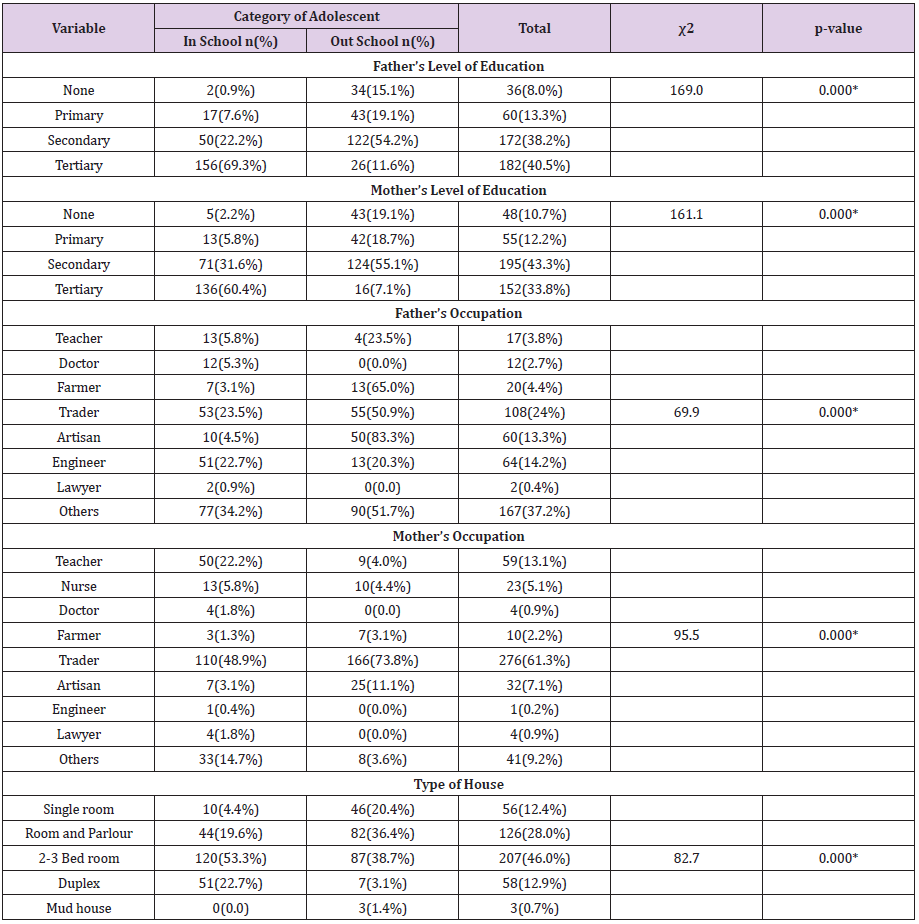
Table 2: Socio-economic Characteristics of Respondents.
Note: * - Values are significantly different at p < 0.05;
n = number of respondents
Household Characteristics of Respondents
Table 3 describes the household characteristics of the respondents. Primary source of water of the respondents was mainly tap water (44.2%), followed by borehole ((31.6%), well water (20.4%) and rain water; with a higher percentage of families of in-school respondents using tap water and borehole (p<0.05), and higher percentage of out-of-school respondents using well and rain water (p<0.05). Almost half (46.4%) of the respondents made use of the city service as means of refuse disposal, while a higher percentage of the respondents (56.4%) from out-of-school compared to the in-school respondents (36.4%) (p<0.05); 39.1% (55.1% in-school, 23.1% out-of-school) made use of refuse dumps (p<0.05). Majority (74.4%) of the respondents made use of water closet, with a higher percentage from in-school respondents (p<0.05) while 23.6% made use of pit toilet, the out-of-school having higher percentage (p<0.05). Majority (72.4%) of the respondents depended on government source of electricity supply (PHCN) as the main source of energy, with no significant difference (p>0.05) between the in-school and out-of-school adolescents. Also, kerosene stove was the primary source of cooking energy for 74.0% of respondents with 90.2% coming from out-of-school while 57.8% was from the in-school respondents; while 22.9% used gas cooker, with higher percentage from in-school respondents (p<0.05).
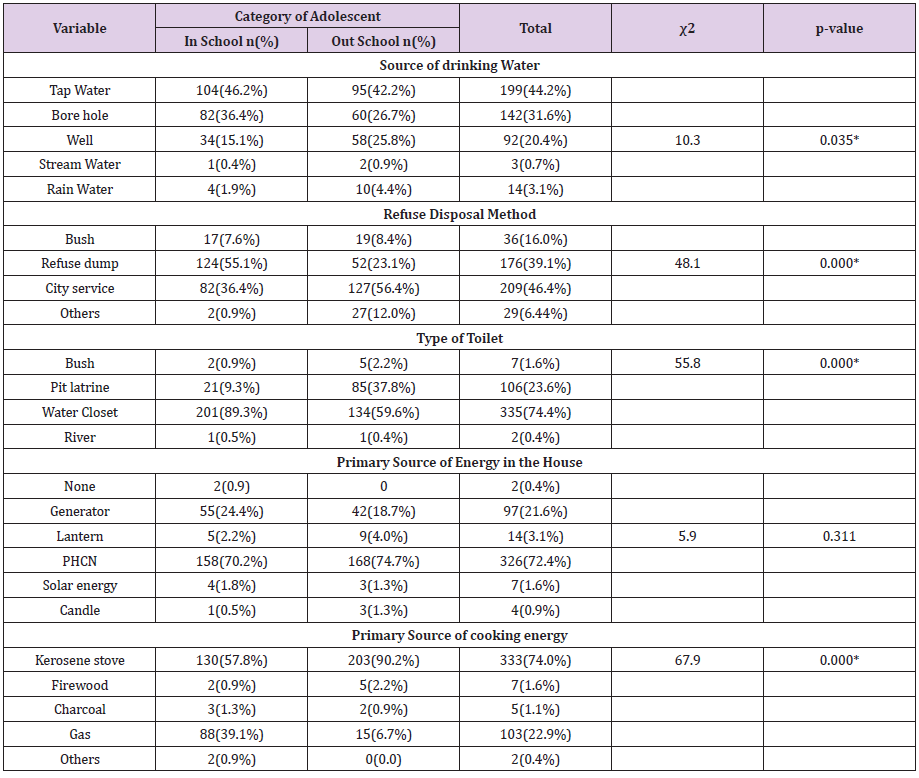
Table 3: Respondents’ Household Characteristics.
Note: * - Values are significantly different at p < 0.05; n = number of respondents
Nutrition Knowledge and Status of Respondents
In Table 4, 58.7% of respondents had poor nutrition knowledge with majority coming from the out-of-school respondents (p<0.05), while 41.3% had good nutrition knowledge, with higher proportion from in-school respondents (p<0.05). Significant association existed between nutrition knowledge and the sex, age, religion, type of family and number of siblings of the respondents. However, no significant difference was observed between nutrition knowledge and ethnicity of the respondents (p>0.05) (Table 5). Almost all (92.8%) of the respondents had normal height-for-age, 5.7% were mildly stunted and 1.5% were severely stunted (Table 6). More of in-school respondents had normal height-for-age, while more of out-of-school respondents were mildly and severely stunted (p<0.05). Most (87.3%) of the respondents had a normal BMI for age, 7.3% were underweight and 4.9% were overweight. The prevalence of underweight and overweight was higher among the in-school adolescents (8.0%, 6.7% respectively) compared with out-of-school respondents, with no significant difference in the prevalence level (p>0.05).
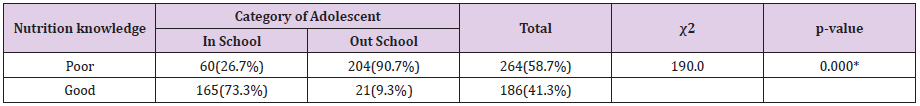
Table 4: Nutrition Knowledge of Respondents.
Note: * - Values are significantly different at p < 0.05
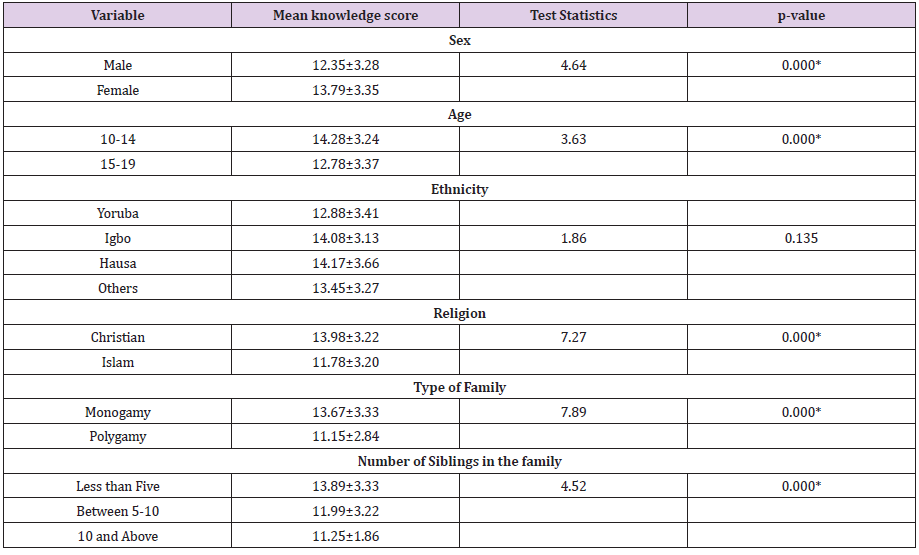
Table 5: Association between Nutrition Knowledge and Socio-demographic factors.
Note: * - Values are significantly different at p < 0.05
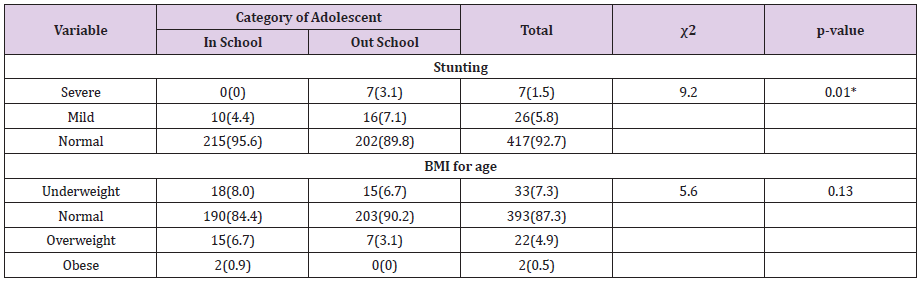
Table 6: Nutritional Status of Respondents.
Note: * - Values are significant at p < 0.05dx
Dietary Diversity of Respondents
In Table 7, majority of the respondents had high dietary diversity, with no significant difference between the in- and outof school respondents. None of the out-of-school respondents had low dietary diversity while 2.7% of in-school respondents had low dietary diversity. Higher percentage of out-of-school adolescents had average dietary diversity (p<0.05) compared with the in-school respondents. The dietary diversity score of the inschool respondents was slightly higher than that of out-of-school respondents (p<0.05). Table 8 shows the association between frequency of food consumption and the category of adolescent. A higher percentage of out-of-school respondents consumed more cereals and grains, roots and tubers, legumes, animal products, and snacks daily compared to the in-school respondents, while greater percentage of the in-school respondents consumed more dairy products and beverages on daily basis (p<0.05. There were significant differences in frequency of food consumption in all the classes of food groups among the respondents (p<0.05) with no regular pattern of differences.
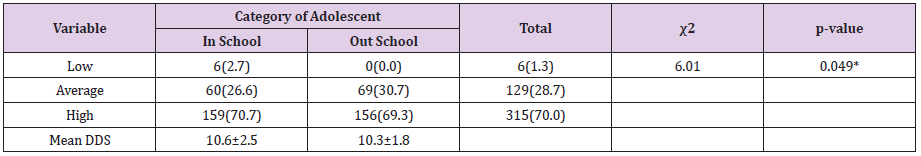
Table 7: Dietary Diversity of Respondents.
Note: * - Values are significant at p < 0.05
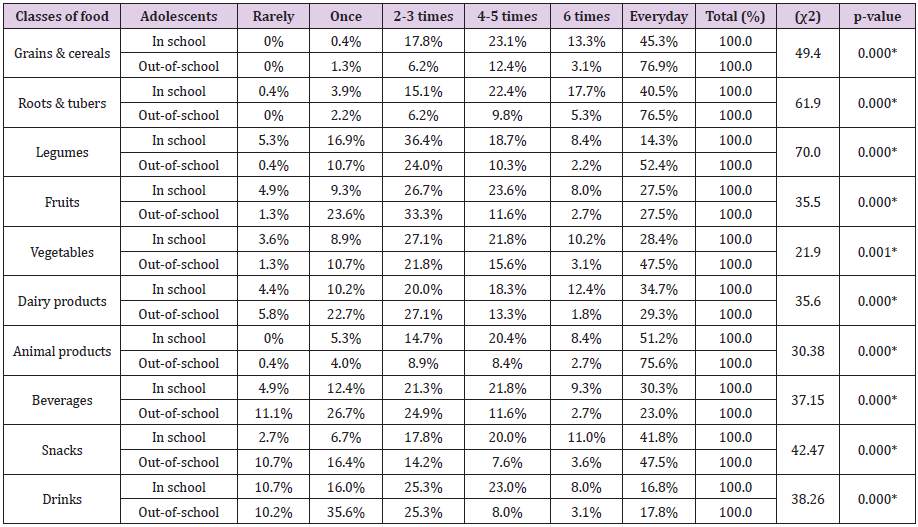
Table 8: Frequency of food consumption weekly and category of adolescents.
Note: * - Values are significant at p < 0.05.
In Table 9, higher percentage of in-school respondents consumed vegetables, tubers, fruits, milk and milk products, and oils and fats compared with out-of-school respondents (p<0.05); while higher percentage of out-of-school respondents consumed cereals, dark green leafy vegetables, organ meat, flesh meat, egg, fish and legumes compared with the in-school respondents (p<0.05). Table 10 shows the correlation between BMI-for-age and dietary diversity scores of in- and out-of-school respondents. The BMI-for-age of the in-school respondents had a significant negative correlation with dietary diversity scores (p<0.05), while the outof- school respondents also had negative correlation with dietary diversity scores which was not significant. In Table 11, there was positive correlation between BMI-for-age and nutrition knowledge of in- and out-of-school respondents with no significant difference between both groups.
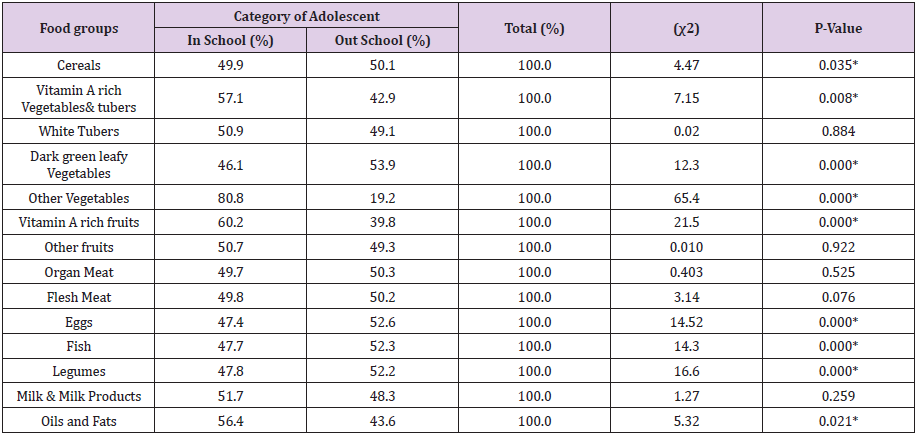
Table 9: Relationship between dietary diversity of respondents.
Note: * - Values are significant at p < 0.05.
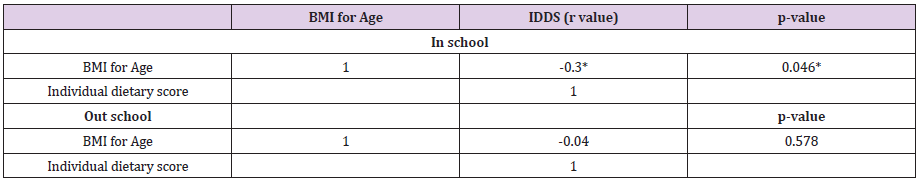
Table 10: Correlation between BMI for Age and individual dietary diversity score.
Note: * - Value is significant at p < 0.05. IDDS = Individual dietary diversity score
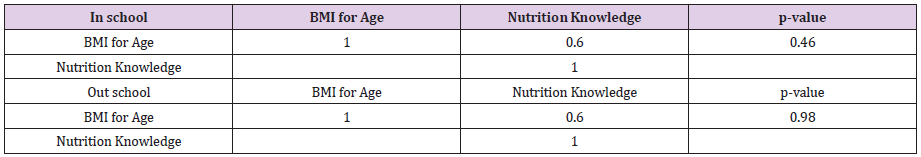
Table 11: Correlation between BMI for Age and Nutrition Knowledge.
Discussion
Socio-Demographic Characteristics of Respondents
The mean age of in-school respondents recruited for this study is similar to the mean age of the in-school respondents (15.5±2.5 years) reported by Sidiga, et al. [15]. Most of the respondents were within the age range of 15-19 years (especially the out-of-school respondents), and were Yoruba. This is similar to the findings of Omobuwa, et al. [16]; and is believed to be due to the geographic location of the study where Yoruba ethnic group is dominant in the South-western Nigeria. Most of the in-school respondents were from the monogamous family. This is also similar to the report of Omobuwa, et al. [16]. About half of the out-of-school respondents were from polygamous family and more than half of them reportedly had five or more siblings. The large family size among these out-ofschool respondents could have led to inability to achieve optimum care due to possible sharing of available resources among larger number of people compared with monogamous families with lesser siblings. This could have resulted in some of the respondents not being enrolled in secondary school, or dropping half way.
The parents’ level of education was observed to be associated with the adolescent type. Majority of the out-of-school respondents’ parents either had no formal education or had maximum of secondary school education compared with their in-school adolescents’ counterpart parents where either secondary or tertiary level of education were the educational level of majority of them. Educated parents can make more informed choices and have better socio-economic status to ensure their children get sound education in schools. Overall, the in-school respondents had significantly better socio-economic and socio-demographic characteristics than the out-of-school respondents.
Nutrition Knowledge and Status of Respondents
Most of the out-of-school respondents had poor nutrition knowledge while majority of the in-school respondents had good nutrition knowledge. This finding is similar to that of Nurul, et al. [17]. Knowledge directly impacts health and nutrition, and this study revealed that the respondents were not aware of the importance of good nutrition to supporting growth and development at adolescent stage. Nutrition knowledge score for in-school respondents was significantly higher compared with that of out-of-school respondents. This finding is different from the result of the study by Manijeh, et al. [18]. The observed difference between the two classes of respondents in this study may be due to the fact that the in-school respondents were exposed to/or enlightened with basic nutrition knowledge in school, as compared to their out-of-school counterparts who may not have access to such information. The prevalence of underweight, overweight and obesity were higher among in-school respondents compared to their out-school counterpart. This finding is in line with that of Ejike, et al. [19].
The prevalence of underweight in this study is higher compared with the study of Adesina, et al. [20], but lower than that of the studies of Alabi [21] and Adegoke, et al. [22]. The Prevalence of overweight in this study is higher than the ones reported by Olumakaiye, et al. [20,23,24]; while it is lower compared with findings of Omuemu and Omuemu [25], Ejike and Ijeh [26]; and much lower than the value reported by Abdulkarim, et al. [8]. The result obtained in this study is an indication of the rise in the level of overweight and obesity among adolescents, which can be linked to the level of their physical inactivity [2] and exposure to snacking, as confirmed from Table 8. The result of the respondents where most of them had normal BMI-for-age is similar to the one reported by Adamu, et al. [27]. There was no significant correlation between BMI-for-age and nutrition knowledge in both groups; and this observation is similar to that of Esfarjani, et al. [28]. The BMI-for-age of the in-school respondents was negatively correlated with their dietary diversity scores. This finding is similar to that of Olumakaiye [29].
Dietary Diversity of Respondents
Majority of the respondents had high dietary diversity scores, the in-school respondents having slightly higher mean score than out-of-school respondents. This is however different from the work of Mahdis, et al. [30] who reported a lower dietary diversity score for out-of-school adolescents compared with in-school adolescents. Dietary diversification is one of the four main strategies advocated internationally for improvement of micronutrients intake and nutritional status, especially in undernourished individuals [31]. Many studies among several age groups have shown that an increase in individual dietary diversity score is related to increased nutrient adequacy of the diet. Dietary diversity scores have been positively correlated with increased mean micronutrient adequacy of complementary foods [32], and micronutrient adequacy of the diet in adolescents [33] and adults [34,35]. The dietary diversity score improved when consumption of healthy food groups increased. Higher dietary diversity score is not always associated with increased weight gain, because it may be due to increase in consumption of low-calorie foods such as vegetables, whole grains and fruits [33].
Conclusion
Majority of the in-school adolescents in this study had better nutrition knowledge compared with the out-of-school adolescents, and the socio-demographic characteristics of adolescents had significant influence on their nutrition knowledge. In-school adolescents had higher dietary diversity score as well as higher prevalence of both underweight and overweight compared with the out-of-school adolescents. There is therefore, the need for nutrition education targeted at the in-school and out-of-school adolescents to increase their nutrition knowledge and dietary diversity; especially the right choice of meals and adequate, healthy diet. There is also the need for increased awareness of the benefits of healthy eating habits and importance of good nutrition to growth and development to prevent the upward trend in prevalence of malnutrition among the adolescents, who are would-be future adults.
Conflict of Interest
The authors declare that this work has not been presented elsewhere for publication, and there is no conflict of interest, as the research was self-sponsored.
References
- (2001) World Health Organization. The second decade: improving adolescent health and development. World Health Organization Geneva.
- (2019) United Nations International Children's Emergency Fund. Investing in a safe, healthy and productive transition from childhood to adulthood is critical. Adolescents statistics–UNICEF Data.
- Odo AN, Samuel ES, Nwagu EN, Nnamani PO, Atama CS (2018) Sexual and reproductive health services (SRHS) for adolescents in Enugu State, Nigeria: a mixed methods approach. BMC Health Services Research 18(1): 92.
- Spear BA (2002) Adolescent growth and development. J Am Diet Assoc 102(3): S23.
- Jenkins S, Horner SD (2005) Barriers that influence eating behaviours in adolescents. Journal of Paediatrics Nursing 20(4): 258-267.
- Patton GC, Sawyer JS, Santelli, Ross DA, Afifi R, et al. (2016) Our future: a Lancet commission on adolescent health and wellbeing. Lancet 387(10036): 2423-2478.
- Akseer A, Al-Gashm, Mehta S, Mokdad A, Bhutta ZA (2017) Global and regional trends in the nutritional status of young people: a critical and neglected age group. Annals of the New York Academy of Sciences 1393(1): 3 -20.
- Abdulkarim AA, Otuneye AT, Ahmed P, Shattima DR (2016) Factors associated with adolescent malnutrition among Nigerian students. Bangladesh Journal of Medical Science 15(02): 243 -248.
- Botero D, Wolfsdorf JI (2005) Diabetes mellitus in children and adolescents. Arch Med Res 36(3): 281.
- Nicklas TA, Demory-Luce D, Yang SJ (2004) Children's food consumption patterns have changed over two decades (1973-1994): The Bogalusa heart study. J Am Diet Assoc 104(7): 1127.
- Uauy R, Solomons N (2005) Diet, nutrition, and the life-course approach to cancer prevention. J Nutr 135 (12): 2934S.
- Whincup PH, Gilg JA, Donald AE, M Katterhorn, C Oliver, et al. (2005) Arterial distensibility in adolescents: the influence of adiposity, the metabolic syndrome, and classic risk factors. Circulation 112(12): 1789-1797.
- McNaughton SA, Ball K, Mishra GD, Crawford DA (2008) Dietary patterns of adolescents and risk of obesity and hypertension. Journal of Nutrition 138(2): 364-370.
- (2010) Food and Agricultural Organisation. Guidelines for measuring household and individual dietary diversity; Nutrition and Consumer Protection Division, Food and Agriculture Organization of the United Nations.
- Sidiga AW, Maha BA (2010) Poor diet quality and food habits are related to impaired nutritional status in 13- to 18-year-old adolescents in Jeddah. Nutrition Research 30(8): 527-534.
- Omobuwa O, CO Alebiosu, FO Olajide, WO Adebimpe (2014) Assessment of nutritional status of in-school adolescents in Ibadan, Nigeria. South African Family Practice 56(4): 246-250.
- Nurul A, Swapan KR, Tahmeed A, Shamsir AM (2010) Nutritional status, dietary intake, and relevant knowledge of adolescent girls in rural Bangladesh. J Health Pop Nutr 28(1): 86-94.
- Manijeh A, Monir BE, Noot R, Rafinejad J, Chinekesh A (2013) Dietary habits among adolescent girls. Global Journal of Health Science 5(5): 1916-9736.
- Ejike CE, Ugwu CE, Ezeanyika LUS (2010) Physical growth and nutritional status of a cohort of semi-urban Nigeria adolescents. Pakistan Journal of Nutrition 9(4): 392-397.
- Adesina FA, Oliemen P, Anochie I, Akani NA (2012) Weight status of adolescents in secondary schools in Port Harcourt using Body Mass Index. Ital J Pediatr 38: 31.
- Alabi A (1998) The relationship between basal blood pressure and body mass index in apparently healthy Nigerian adolescents. April 1998. Dissertation submitted to West African college of physicians. West African College of Physicians, Lagos State.
- Adegoke SA, Olowu WA, Adeodu OO, Elusiyan JB, Dedeke IO (2009) Prevalence of overweight and obesity among children in ile – ife, Southwestern Nigeria. West Afr J Med 28(4): 216- 221.
- Olumakaiye MF (2008) Prevalence of Underweight: A Matter of Concern among Adolescents in Osun State, Nigeria. Pakistan Journal of Nutrition 7(3): 503-508.
- Bamidele OJ, Esther OA, Olarinmoye F, Olajide O, Abodunrin OL (2011) Prevalence and Socio-demographic determinants of under-weight and Pre-obesity among in-school adolescents in Olorunda Local Government Area, Osun State, Nigeria. TAF Prev Med Bull 10(4): 397-402.
- Omuemu VO, Omuemu CE (2010) The prevalence of overweight and its risk factors among adolescents in an urban city in Edo State. Nigerian Journal of Clinical Practice 13(2):128-133.
- Ejike CE, Ijeh II (2012) Obesity in young-adult Nigerians: Variations in prevalence determined by anthropom.etry and bioelectrical impedance analysis, and the development of % body fat prediction equations. International Archives of Medicine 5: 22.
- Adamu Abiba, Adjei Naa Kai Grace, Kubuga Clement Kubreziga (2012) Effects of dietary patterns on the nutritional status of upper primary school children in Tamale Metropolis. Pakistan Journal of Nutrition 11 (7): 591-609.
- Esfarjani R, Roustaee Z, Kamrani M, Hadjifaraji (2006) Assessment of nutritional knowledge and anthropometric status of adolescents in East Tehran. Nutrition and Food Technology Research 35(2006): 522-530.
- Olumakaiye MF (2013) Dietary diversity as a correlate of undernutrition among school-age children in Southwestern Nigeria. Annals of Child and Youth Studies 37(1): 137-145.
- Mahdis, Parvin A, Mehrdad S, Mostafa H (2013) Dietary diversity and its related factors among adolescents: A survey in Ahvaz-Iran 5(2): 181-186.
- Maunder EMW, Matji J, Hlatshwayo-Molea T (2001) Enjoy a variety of foods-difficult but necessary in developing countries. South African Journal of Clinical Nutrition 14(3).
- Swindale A, Bilinsky P (2006) Household dietary diversity score for measurement of household food access: Indicator guide (2). Washington DC. Food and Nutrition Technical Assistance (FANTA) project, Academy for educational Development, p. 1-9.
- Mirmiran P, Azadbakht L, Esmaillzadeh A, Azizi F (2004) Dietary diversity score in adolescents-a good indicator of the nutritional adequacy of diets: Tehran Lipid and Glucose Study. Asia Pacific Journal of Clinical Nutrition 13(1): 56-60.
- Ogle BM, Hung PH, Tuyet HT (2001) Significance of wild vegetables in micronutrient intakes of women in Vietnam: An analysis of food variety. Asia Pacific Journal of Clinical Nutrition 10(1): 21-30.
- Foote JA, Murphy SP, Wilkens LR, Basiotis PP, Carlson A (2004) Dietary variety increases the probability of nutrient adequacy among adults. Journal of Nutrition 134(7): 1779 -1785.
