 Short Communication
Abstract
The analysis of retinal Spectral-Domain Optical Coherence Tomography (SD-OCT) images by trained medical professionals can be used to provide useful insights into various diseases. It is the most popular method of retinal imaging due to its non-invasive nature and the useful information it provides for making an accurate diagnosis. A deep learning approach for automating the segmentation of Cystoid Macular Edema (fluid) in retinal OCT B-Scan images was developed that is consequently used for volumetric analysis of OCT scans. This solution is a fast and accurate semantic segmentation network that makes use of a shortened encoder-decoder UNet like architecture with an integrated Dense ASPP module and Attention Gate for producing an accurate and refined retinal fluid segmentation map. Our system was evaluated against both publicly and privately available datasets; on the former the network achieved a Dice coefficient of 0.804, thus making it the current best performing approach on this dataset, and on the very small and challenging private dataset, it achieved a score of 0.691. Due to the lack of publicly available data in this domain, a Graphical User Interface that aims to semi-automate the labelling process of OCT images was also created, thus greatly simplifying the process of the dataset creation and potentially leading to an increase in labelled data production.
Keywords: Retinal Spectral Domain Optical Coherence Tomography Images; Cystoid Macular Edema; Volumetric Analysis of OCT Scans
Introduction
The use of deep learning for medical analysis becomes the first methodology of choice for automated medical image analysis [1]. Deep learning allows for patterns to be recognised from data without any human input, with the resulting recognised information potentially being so abstract that it be insurmountably difficult for humans to manually construct features for them [2]. It creates such complex representations of data through many multiple layers of abstraction that have brought many breakthroughs to a multitude of fields over recent years [3]. Optical Coherence Tomography (OCT) retinal imaging is a non-invasive technology in which high-resolution cross-sectional images of retinal tissue are acquired, allowing for in-depth assessment and identification of abnormalities. This analysis requires the skill of a trained medical professional, who would ex- amine the images and make judgments on the features that they see present. This is naturally subject to observer error, along with this it is also very much a subjective area and consequently often has inter-observer variability [4], potentially culminating in misdiagnosis which can be detrimental to a patient’s eyesight.
The segmentation of fluid in OCT images is the process of extracting the regions of cystoid macular edema in OCT B-scans. This fluid can be in all shapes and sizes and in many different locations within the retina, often with hairline boundaries separating individual fluid pockets making them particularly challenging to segment accurately. The current issues that face other algorithms in this domain are that many have primarily focused on hand crafting features to assist their deep learning networks with detecting fluid in challenging regions of high noise or distortion, or even ignoring poor quality images completely which happen to be very common in the OCT domain. Along with this, approaches have often had to make use of extra techniques to group regions of fluid together as convolutions typically only take a small region around a pixel into account when classifying, thus resulting in erroneous classifications. Also, there is a lack of publicly available data sets, which was discussed in great detail by Trucco et al [5]. The main contributions are a deep learning approach to fully segment the regions of fluid in 2D OCT B-scan images, an approach for calculating the volume of fluid contained within a series of OCT scans, a dataset that is to be made publicly available, and a complete system that semi-automates the labelling process of OCT images.
Datasets
There were two datasets used for evaluating the performance of each of the proposed implementations. These datasets come from different sources, with one being a publicly available dataset and the other privately acquired. The public dataset that was used was acquired from [6] this dataset was also used by Roy, et al. [7] for their creation of ReLayNet. The dataset consists of 110 images from 10 different patients, with each image labelled by two professionals; Experts 1 and 2. A primary concern with this dataset is that the labels produced by each of these professionals vary drastically, with an inter-rater Dice coefficient of only 0.57. It was therefore chosen that the labels from Expert 1 were utilised for training and the labels from Expert 2 were kept for validation purposes. Due to the small size of this dataset, it was also opted for a 50:50 train/testing split, meaning that both the training and testing sets consisted of 5 patients each, allowing for a fair test. Secondly, a smaller testing dataset was acquired that was manually labelled by an ophthalmologist in his free times using the webbased tool that was provided. The dataset consists of 54 images that aim to test the network on images that were selectively chosen to be particularly challenging undertakings. This was due to a combination of a significant amount of image noise being present and the fluid regions producing boundaries that are difficult to distinguish with the naked eye. This dataset will be available based on requests from authors.
Methods
The popular deep learning semantic segmentation encoderdecoder network UNet [8] was used as the foundation of our project network. This network consists of a series of convolutional layers evaluating features that are gradually downsampled to 1/16th the size of the original input, before being progressively upsampled back to the original input size, concatenating each upsampling layer with the corresponding encoder stage in order to produce a final segmentation map.|
a) Testing Environment: Preliminary testing of the theories was performed using the aforementioned publicly available dataset from Chiu, et al. [6] used by Roy, et al. [8] training each permutation of the network on the training set and monitoring the results achieved on the testing set. For the preliminary training sessions, the network was trained using 256x512 images with a learning rate of 1e-5 and the Adam Optimiser, [9] with the goal of minimising the inverse of the Dice coefficient [10] as the loss function and only saving the network that yields the best performance results. The Dice coefficient was used for the loss function, as there was a significant class imbalance in the labels. After experimenting with varying batch sizes, batches of 5 images were found to be the best performance for the network training, as small-batch training has been shown to provide improved generalisation performance and allows a significantly smaller memory footprint, which might also be exploited to improve machine throughput [11]. After training each to convergence, a network’s performance was then evaluated by its respective Dice coefficients against the labels from both experts.
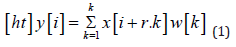
b) Atrous Convolutions: Atrous convolutions facilitate a larger receptive field being used without a loss of coverage. [12] The output y[i] of an atrous convolu- tion of an input signal x[i] with a filter w[k] is considered.
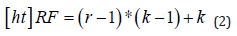
The rate of r is the value that controls the stride at which the input signal is sampled. These were a potentially useful addition to the Encoder module due to the fact that the fluid tends to form in grouped regions, so consequently, in order to classify a given pixel as belonging to a region of fluid, it is not only useful to simply observe immediately neighbouring pixels but also extend the analysis to include a wider domain. However, due to the computationally expensive nature of larger convolution kernels, the integration of atrous convolutions seemed a viable alternative [13]. In order to achieve this, the appropriate atrous rates for each of the layers of the DenseASPP module needed to be calculated based on the resolution of the features that it operates on. The receptive field size, RF, of an individual atrous convolutional layer with rate, r and kernel size, K, needed to be calculated. This can be determined using the following equation,
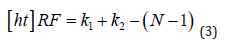
It needed to be taken into consideration when stacking multiple (N) convolutional kernels, as it is done in a pyramid structured module (such as DenseA- SPP), with kernel size, K, the calculation differs slightly. This meant that the resulting overall receptive field of this atrous convolutional pyramid stack can be calculated as follows,
In order to test the DenseASPP module being placed at different layers of the encoder architecture, the 2nd convolutional operation in a given layer was replaced with the DenseASPP module and subsequent layers of the encoder would be re- moved. This meant that the dense features would be used as a final consolidation step within the encoder and the network would always begin the upsampling operations using the immediate output of this dense module. After analysing the results shown in (Table 1), it became clear that introducing the DenseASPP mod- ule at the 3rd layer of the encoder provided the best trade-off between speed and segmentation performance. This was considered to be the case because it had a much lower inference time than UNet whilst still being able to offer very promising results on both the testing and validation sets.
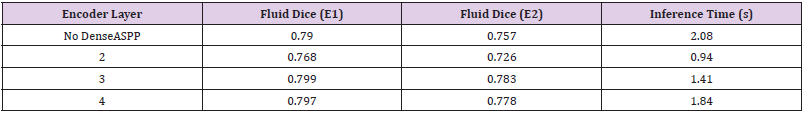
Table 1:Results of Dense ASPP module integration at different encoder layers, with Dice coefficient scores of both Experts, E1 and E2.
c) Attention Gates: Wang, et al. [14] used an Attention Gate to supplement a standard ASPP module, inspired by Chen, et al. [15] They utilised multiplicative attention along with a global sigmoid activation function to highlight the relevant activations in their feature maps. Whilst this approach is more computationally effective, it can be considered less accurate than the additive attention approach [16]. Therefore, we chose to integrate an additive Attention Gate in a similar fashion via combining it instead with the DenseASPP module that has already proven itself to be effective in the earlier tests. During these aforementioned tests, it was deduced that the best performing implementation was to include the DenseASPP module in a 3rd level encoder, as this offered a trade-off between the input to the module being of a sufficient resolution and also it was being deep enough within the encoder that it would be working on a feature- rich input.
The output of both initial convolutional operations, followed by the DenseASPP operations is then utilised as inputs to the Attention Gate, with the subsequent attention gate’s output being concatenated with the 1st convolution. This improved the results, as it achieved Dice coefficients of 0.804 and 0.784 on the testing sets from Expert 1 and 2. However, the inference time did somewhat suffer, as this now had taken 1.83 seconds per image. Despite this sacrifice in speed, the performance improvements were promising, and the network remained 12% faster than UNet. Our final network architecture shown in (Figure 1).
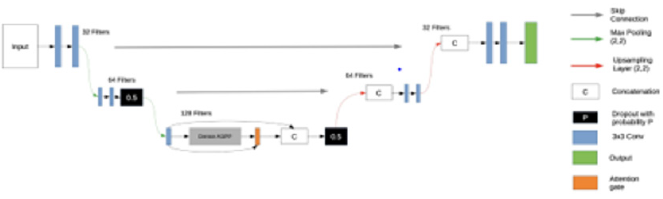
Figure 1: Our final network architecture.
d) Volumetric Estimation: The volumetric estimation algorithm aimed to calculate the overall fluid volume content in a scan. This figure will be an additional quantitative measure for the medical professional. The automated estimation was achieved by running the deep learning algorithm over each individual 2D OCT scan, subsequently stacking these results together using the scanning distance to compile a representation of the data in a 3D space. Individual segmented fluid pockets which are the output of our proposed network converted to binary maps which used to calculate all of the connected components as each of these components was a potential candidate to be a region of fluid; see (Figure 2). The area of each of these potential candidates was calculated utilizing the green formula [17]. These calculated areas were used to filter the potential candidates through the application of a minimum area threshold to remove potential erroneous estimations that could be attributed to noise.
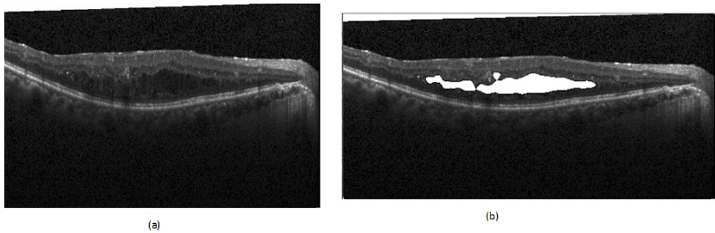
Figure 2: Examples of fluid segmentation performed by the network.
(a) Original Image
(b) Fluid Segmentation.
The remaining connected components and their corresponding areas were consequently considered to be individual representative shapes that encapsulate each of the detected fluid regions. These shapes provided all of the necessary information regarding the boundaries of the fluid that were present in a B-Scan and therefore facilitated the further analysis of each of the potential fluid pockets. The overall volume of a 3D object was then estimated by the sum of the areas of each of the B-Scans, multiplied by the scan distance that was used to acquire the scans.
Semi-Automated Labelling System
It became apparent that there was a severe lack of dataset that was publicly available for research, causing many issues for the development of a system to estimate fluid volume. This can partially be attributed to the time-consuming nature of the labelling process, as each of the individual biomarkers that can be present in a scan has the potential to vary drastically in size and are typically abnormal in shape, making them challenging to label accurately and consistently. In order to address this, we created a system that utilised our network to create a semi-automated labelling system. In order for this to be a usable system in a real-world environment, the complexities of the algorithm needed to be abstracted away ensuring that the system can facilitate faster dataset production. This was achieved through creating a GUI that allows the user to upload their own sets of images and subsequently be presented with labels overlaying each of them, with these labels having been generated automatically using the deep learning network; see (Figure 3). The user is then able to add their own labels or tweak and adjust the boundaries of the automatically generated labels in order to correct any errors that the system may have made. Finally, the user is able to save the results to a local directory, thus building their own labelled datasets for future.
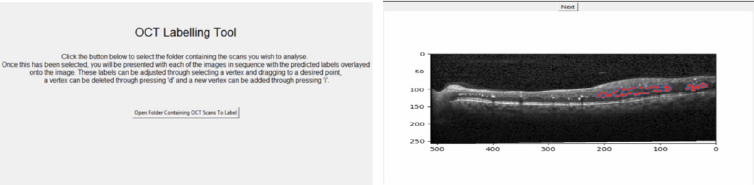
Figure 3: The home screen of the labelling system (left) and an example of the labelling process using the system (right).
Results
(Table 2) shows the results of training various network architectures using a 50:50 train/test set split. This table demonstrates that the network architecture that has been created was able to outperform the implementation of UNet and ReLayNet across both metrics. This network was able to achieve a 2.2% increase with respect to the Dice Coefficient and a 29.8% improvement on inference time, relative to UNet, thus achieving the original goal of being a performant network with respect to segmentation whilst also being useful for environments where there is less computing power available. Cross Validation The dataset from Chiu, et al. [6] was divided patient wise; so, K-fold cross validation [18] was applied using the data from both experts as separate ground truths on which to validate the network’s performance. The Dice coefficient was again utilised as the metric for analysing. A K value of 5 was used, meaning that each permutation of the network was trained with the scans from 8 patients (88 images), with 2 patients (22 images) being held out for testing each time.
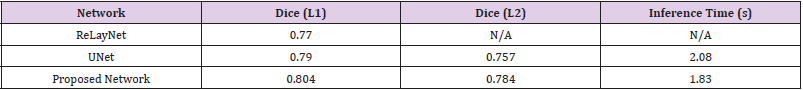
Table 2:Results of the new network implementation when compared to that of ReLayNet [14] and UNet [13].
Each of these folds was trained with a learning rate of 1e-5 and a batch size of 4 until convergence of the network. The results of the K-fold tests utilising the labels from Expert 1 and Expert 2 as ground truth can be seen in column 2 and in column 3 respectively in (Table 3). These results show a high overall mean Dice coefficient, and the standard deviation demonstrates that there was a strong level of consistency across the results. This also shows that the network was able to perform consistently well given a small amount of training data for each of these tests. The various results of the two experts emphasise. Finally, the network was tested using the dataset that was acquired from Sunderland Eye Infirmary. However as previously alluded to, due to this dataset being even smaller than the other, transfer learning [19] was used to utilise the weights from the network that was trained on the previous dataset. In this instance, K-fold cross validation was used with a K value of 6, meaning that each network was trained with 45 images and tested with 9 for each of the sessions. For these tests, a learning rate of 1e- 4 was used and the networks were again trained to convergence.
As seen in (Table 4), the results achieved are again positive overall, especially when it is considered that there was a very small number of training images available each time and the images on which the network has been evaluated had been deliberately handpicked as being challenging to segment. The tests can be considered to have been successful overall as the network achieved a mean fluid Dice coefficient value of 0.678 overall, with a good degree of consistency. amongst the scores, despite all of these hurdles presented. There were however some variations to be seen within these results across some of the K-folds. These inconsistencies can potentially be related to the fact that images contain very densely packed fluid regions with many intricate hairline boundaries delineating them. These conditions create a challenging environment for segmentation algorithms and can consequently negatively impact the score that is achieved.
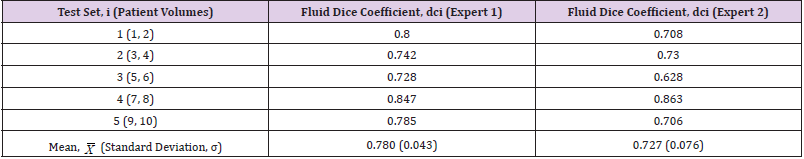
Table 3:K-Fold cross validation results on the dataset from Chiu, et al. [2] labelled by Expert 1 and Expert 2.
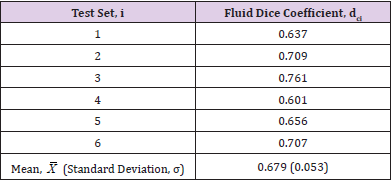
Table 4:K-Fold cross validation results on the dataset from Sunderland Eye Infirmary.
Discussion
We have presented 4 main contributions to the field of automated OCT analysis; a deep learning approach to fully segment the regions of fluid in 2D OCT B-scan images, an approach for estimating the volume of fluid content within a series of OCT scans, a dataset that is to be made publicly available and a complete system that semi automates the labelling process of OCT images. The deep learning created fundamentally utilizes a core encoderdecoder architecture, however, this has been built upon through first integrating a Dense ASPP module for larger receptive field analysis and then through the addition of Attention Gates for filtering irrelevant activation to refine the segmentation output. This combination has proven effective as it was able to segment OCT images to a high standard whilst remaining computationally feasible with lower-end hardware. Our volumetric estimation algorithm was proven to be able to corroborate the opinion of an expert, thus indicating its usefulness in a real-world environment. Whilst fully labelled OCT volumes would have been useful for analyzing the performance of this algorithm.
Restricted access to data became a prevalent issue throughout the research that we have undertaken and was restricting in terms of being able to both develop the system and test it extensively. This further reiterates the points raised by Trucco, et al. [17] as the development of the system required more access to data representative of the challenges that are faced in real-world environments in order to produce the best results possible and for it also to be tested extensively. This issue became particularly prevalent when creating the algorithm to estimate overall fluid content in the volume, due to not having access to complete labelled patient volumes to validate the approach. To coincide with this, the manual labelling of retinal fluid is something that is very subjective and is therefore subject to differences of opinion between Ophthalmologists. This point was demonstrated by the labelling of the dataset provided by Chiu, et al. [6] having such a low interrater Dice coefficient score. This serves to reinforce the need for a robust, repeatable, and most importantly reliable solution to this problem to be implemented and used in clinics across the world as soon as possible. Therefore, we aimed to create a system that simplifies this process and offers more consistency between labels by semiautomating the labelling by using our deep learning network.
References
- Litjens GJS, Kooi T, Bejnordi B, Setio AAA, Ciompi F, et al. (2017) A survey on deep learning in medical image analysis. CoRR.
- Goodfellow I, Bengio Y, Courville A, Bengio Y (2016) Deep learning. MIT press Cambridge 1.
- LeCun Y, Bengio Y, Hinton G (2015) Deep learning. Nature 521(7553): 436-444.
- Lloyd Paul Aiello, Roy W Beck, David M Brown, Donald S Fong, Neil M Bressler, et al. (2007) Relationship between optical coherence tomography measured central retinal thickness and visual acuity in diabetic macular edema. Ophthalmology 114(3): 525-536.
- Trucco E, Ruggeri A, Karnowski T, Giancardo L, Chaumn E, et al. (2019) Validating retinal fundus image analysis algorithms: Issues and a proposal. Invest Ophthalmol Vis Sci 54(5): 3546-3559.
- Chiu SJ, Allingham MJ, Mettu PS, Cousins SW, Izatt JA, et al. (2015) Kernel regression-based segmentation of optical coherence tomography images with diabetic macular edema. Biomed Opt Express 6(4): 1172-1194.
- Roy AG, Conjeti S, Karri SPK, Sheet D, Katouzian A, et al. (2017) Relaynet: retinal layer and fluid segmentation of macular optical coherence tomography using fully convolutional networks. Biomed Opt Express 8(8): 3627-3642.
- Ronneberger O, Fischer P, Brox T (2015) U-net: Convolutional networks for biomedical image segmentation. In: International Conference on Medical Image Computing and Computer Assisted Intervention, pp. 234-241.
- Kingma DP, Ba J (2014) Adam: A method for stochastic optimization. CoRR.
- Sudre CH, Li W, Veratrin T, Ourselin S, Cardoso MJ (2017) Generalised dice overlap as a deep learning loss function for highly unbalanced segmentations. CoRR.
- Masters D, Luschi C (2018) Revisiting small batch training for deep neural networks. CoRR.
- Yu F, Koltun V (2015) Multi-scale context aggregation by dilated convolutions. CoRR
- Deniz CM, Hallyburton S, Welbeck A, Honig S, Cho K (2017) Segmentation of the proximal femur from MR images using deep convolutional neural networks. CoRR abs 8(1): 16485.
- Wang C, Zhu Y, Liu Y, He R, Sun Z (2019) Joint iris segmentation and localization using deep multitask learning framework. CoRR.
- Chen L, Zhu Y, Papandreou G, Schroff F, Adam H (2018) Encoder-decoder with atrous separable convolution for semantic image segmentation.
- Luong T, Pham H, Manning CD (2015) Effective approaches to attention-based neural machine translation. In: Proceedings of the 2015 Conference on Empirical Methods in Natural Language Processing, pp. 1412-1421.
- Kohavi R (1995) A study of cross-validation and bootstrap for accuracy estimation and model selection. In: Proceedings of the 14th International Joint Conference on Artificial Intelligence, pp. 1137-1143.
- Torrey L, Shavlik J. Transfer learning.
- Duduchava R (2001) The green formula and layer potentials. Integral Equations and Operator Theory 41(2): 127-178.
