 Research Article
ABSTRACT
Purpose: Myelodysplastic syndrome (MDS) is a group of tumor diseases derived from hematopoietic stem cells. It has a tendency to progress to acute myeloid leukemia (AML), but the mechanism is not clear due to complicated pathogenesis. Based on the integrated analysis of gene microarray data sets, the present study established a gene expression model related to the pathogenesis of MDS, and screened target molecules which have an impact on disease progression.
Methods: We downloaded three gene microarray data sets (including 397 MDS patients and 45 normal controls) from Gene Expression Omnibus (GEO) database (http:// www.ncbi.nlm.nih.gov/geo). Then differential expressed genes (DEGs) from each data set was screened and integrated for obtaining co-expression DEGs. Enrichment analysis, network construction were performed to elucidate core genes and pathways related to the pathogenesis of MDS. Moreover, the DEGs were used to validate in extra data sets and for further exploration on online Gene Expression Profiling Interactive Analysis (GEPIA) tool (http://gepia.cancer-pku.cn/).
Results: In our study, 325 co-expression DEGs including 141 up-regulated and 184 down-regulated were identified. And we found that these DEGs are enriched in interferonrelated signaling pathways, which also involve participation in antiviral responses. In addition, up-regulated hub genes such as IFIT3 and ITITM have been validated in extra data sets and had an important impact on the prognosis of patients with AML.
Conclusion: Our findings will improve our understanding of the cause and underlying molecular events in MDS and may provide new research directions for treatment strategies.
Keywords: Myelodysplastic Syndrome; Bioinformatics; Hub Genes; Interferon-Related; Differential Expressed Genes
Abbreviations: MDS: Myelodysplastic Syndrome; SEER: Surveillance, Epidemiology, and End Results; DEGs: Differentially Expressed Genes; GEO: Gene Expression Omnibus; GEPIA: Gene Expression Profiling Interactive Analysis; GO: Gene Ontology; KEGG: Kyoto Encyclopedia of Genes and Genomes; GSEA: Gene Set Enrichment Analysis; PPI: Protein-Protein Interaction; TCGA: The Cancer Genome Atlas; OS: Overall Survival; HR: Hazard Ratio; ISGs: Interferon-Stimulated Genes; PAMPs: Pathogen-Associated Molecular Patterns
Introduction
Myelodysplastic Syndrome (MDS) is a cluster of tumorous diseases originating from hematopoietic stem cells. It characterizes aberrant bone marrow hematopoiesis, abnormal blood cell development, manifested as refractory blood cell reduction, hematopoietic failure, and high risk of transforming to acute myeloid leukemia, once referred to as pre-leukemia [1-2]. Previous epidemiological studies have shown that the incidence of MDS in the United States, Europe, and Asia ranges from less than 2 to more than 68 per 100,000 people [3-5]. Another research estimated that there are nearly 170,000 active cases and possibly no less than 50,000 cases of MDS in the US today based on varying methods of prevalence estimation; in fact, this figure may be more because of the population that is continuously aging [6]. Moreover, a study as per the Surveillance, Epidemiology, and End Results (SEER) database reported that the rate of secondary AML among MDS patients is less than that reported earlier, although these patients still have poor rate of survival [7].
Due to the pathogenesis of MDS is poorly understood because of its heterogeneity and complexity, showing the reasons and the inherent biochemical mechanisms, identifying biomarkers for diagnosis at an early stage and customized treatment, is crucial. The development in gene microarray technology has made it possible to present large numbers of high-throughput gene profiles to be extensively used in clinical inspection, diagnosis of cancer, and other facets. And based on this massive data, it is especially appropriate for differentially expressed genes (DEGs) screening [8,9]. In recent years, these data have been re-mined by more and more researchers to discover and provide valuable clues for new research. Nevertheless, the regular approach to microarray analysis can be easily confused by tissue samples heterogeneity or by variations in composition of cell type from a study conducted independently. And the detection of the same type of sample can be also affected by different types of microarray platforms. Thus, if we integrate the DEGs obtained from multiple data sets and conduct an in-depth analysis of co-expressed genes, which can solve the above disadvantages and make the results more reliable.
In our study, three gene microarray data sets GSE4619 [10], GSE19429 [11], and GSE58831 [12] were downloaded from the Gene Expression Omnibus (GEO) database (http://www.ncbi.nlm. nih.gov/geo), which were then evaluated to acquire overlapping DEGs. To identify the hub genes associated with MDS, network construction and functional enrichment were applied. Then we utilized different data sets, such as GSE61853 [13] and GSE145733 [14] to confirm the expression of hub genes. Finally, in order to explore whether hub genes play a driving role in the transition of MDS to AML, we imported these hub genes into online Gene Expression Profiling Interactive Analysis (GEPIA) tool (http:// gepia.cancer-pku.cn/) for further analysis. Identifying hub genes and functional enrichment of DEGs will enable more precise, and a dependable biomarkers for diagnosis in early stages and personalized MDS therapy.
Materials and Methods
Data Source and Processing for the Identification of DEGs
For next-generation sequencing and microarray/gene profile, a free database, NCBI-GEO was used from which the data sets of patients of MDS as well as normal controls (GSE19429, GSE4619, and GSE58831) were obtained. The GSE4619 data set had 55 MDS patients and 11 controls (normal samples). The GSE19429 data set had 183 MDS patients and 17 controls (normal samples). And the GSE58831 data set had 159 patients with MDS and 17 normal controls. All of data sets were set on GPL570 Platforms HG-U133_ Plus_2, (Affymetrix Human Genome U133 Plus 2.0 Array; Thermo Fisher Scientific, Waltham, MA, USA), and the data collation and analysis were conducted by R software (version 3.6.2). To analyze gene expression microarray data, an R package “Limma” was used, which facilitates the capacity to simultaneously assess comparisons between several RNA targets in randomly complicated planned experiments [15-17]. Based on this, this package has been applied to identify the DEGs between normal controls and MDS patients, and genes with |log2FC| > 0.58 & p-value< 0.05 as the criterion for cut-off were selected. Next, we overlapped the DEGs obtained from above three data sets and visualized it by R package “VennDiagram”, for up and down regulated genes, respectively.
Enrichment Analysis of DEGs
To examine the changed biological functions of the DEGs, clustering of data via GO Gene Ontology (GO) and Kyoto Encyclopedia of Genes and Genomes (KEGG) pathway analysis was done by R packages “clusterProfiler”, with which, gene clusters enrichment analysis and the biological term classification could be automated [18]. A statistically significant p-value was <0.05, and the ranking of GO results was done as per the p-value. The top five terms of significance were selected for displaying genes enriched in terms. Then we applied Gene Set Enrichment Analysis (GSEA), a powerful analytical method for gene expression data interpretation [19,20]. The advantage of this method is that it focuses on gene sets, that is, cluster of genes with commonly shared location on chromosomes, biological function, or regulation. At the same time, the most significant terms were selected for visualized, for up and down regulated genes, respectively.
Construction and Analysis Of Protein-Protein Interaction Network and Analysis
The protein-protein interaction (PPI) analysis is crucial in interpreting MDS pathogenesis in terms of molecular mechanisms of the important cellular activities. Here, we imported DEGs to The Search Tool for the Retrieval of Interacting Genes database (http:// stringdb.org), which was used to predict potential interactions among mRNAs. Based on the analysis results, we visualized it and explored the hub-genes by cytoscape 3.7.1. Then, based on topology, the region with most dense connections in the PPI network were detected through the MCODE plugin which may aid in hub genes identification.
Verification of Hub Genes by Gene Expression
Various gene expression data sets of MDS were used to surpass the shortcomings of individual studies. We used the keywords “MDS”, “Study type” as “Expression profiling by array” and “Organism” as “Homo sapiens” to search for GEO. Finally, data sets GSE61853 and GSE145733 were selected for validation. After downloaded both of them, we used heat maps to show hub genes expression in each sample. In addition, the levels of hub genes expression in each data sets were also visualized by box plots.
Exploration of Hub Genes in AML
To explore whether the role of obtained hub genes is crucial in driving the transition of MDS to AML, their expression in normal control and in AML were compared through GEPIA. The expression data of RNA sequencing of tumor and normal samples from The Cancer Genome Atlas (TCGA) were analyzed by GEPIA, a web server that was recently developed, applying a standard processing pipeline [21]. Further, the clinical prognostic significance of the hub genes was evaluated employing the TCGA survival data of AML patients with GEPIA. The overall survival (OS) rate of AML patients was estimated by plotting Kaplan-Meier survival curves. Next, the hazard ratio (HR) and the effect of hub gene expression on the survival rate of AML patients were evaluated through the log-rank test. Statistically significant values had P-values below 0.05.
Results
Identification of the DEGs
The schematics of analysis is shown in Figure 1. The gene microarray data sets GSE4619, GSE19429, and GSE58831 were downloaded from the GEO database. DEGs of MDS patients and normal controls from all of data sets were analyzed by R software using p-value<0.05 & |log2FC|>0.58 as the criterion for cut-off, then 618, 544, 1787 DEGs from GSE4619, GSE19429 and GSE58831 were extracted, respectively. After overlapping these genes, we identified 141 up-regulated and 184 down-regulated co-expressed DEGs, as shown in Figure 1. At the same time, we listed the DEGs in supplementary.
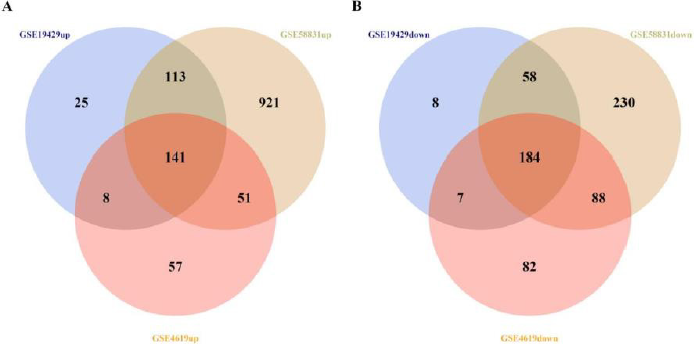
Figure 1: Identification of 325 co-expressed DEGs from three microarray data sets (GSE4619, GSE19429 and GSE58831) using R software (version 3.6.2). Different data sets are represented by different color areas. The co-expressed DEGs are indicated by the cross areas.
(A) 141 up-regulated genes were identified.
(B) 184 down-regulated genes were identified.
DEGs Enrichment Analysis
We carried out a functional enrichment analysis of DEGs, as per the R package “clusterProfiler”. The criterion for cut-off was p-value<0.01. The analysis for enrichment was carried out on the genes were up-regulated and down-regulated, respectively, as shown in Figure 2A~2B. We can easily find that most of the up-regulated DEGs are concentrated in interferon-related items such as the signaling pathway of type I interferon, the associated cellular response, as well as the response to type I interferon, et al. Correspondingly, the other enriched GO terms contained the defense response to virus and response to virus which related to host antiviral mechanism. Besides, the DEGs that were downregulated, were enriched in in physiological processes related to leukocyte growth and differentiation, such as regulation of leukocyte activation, leukocyte cell-cell adhesion. In addition, some biological processes related to adaptive immune response were also enriched in down-regulated DEGs, for instance the activation of T cells and B cells.
Following this criteria, we identified the Top 5 GO categories from both groups of DEGs that were up-regulated and down-regulated (Figure 2C~2D), and the co-expressed genes enriched in these terms were also visualized. Unfortunately, none of our DEGs could be enriched on the KEGG pathway with remarkable significance, which set P-value less than 0.05 as a cut-off criterion. Furthermore, In order to further verify the reliability of our enrichment results, we performed a more accurate GSEA enrichment analysis on the obtained DEGs. According to the results in Figure 2E~2F, we found interestingly that the results obtained by the GSEA analysis did not differ significantly from those obtained by the enrichment analysis of DEGs, which also verified the accuracy of our analysis on the other hand (Figure 2).
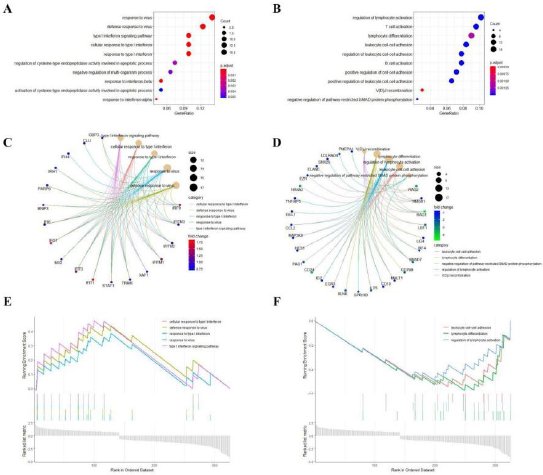
Figure 2: DEGs enrichment analysis.
(A) Analysis of up-regulated DEGs through GO enrichment.
(B) Analysis of down-regulated DEGs through GO enrichment.
(C) Top 5 categories and their related co-expressed genes involved in up-regulated DEGs.
(D) Top 5 categories and their related co-expressed genes involved in down-regulated DEGs.
(E) Analysis of up-regulated DEGs through GSEA.
(F) Analysis of down-regulated DEGs through GSEA.
PPI Construction and Hub Genes Identification
The basis of cellular processing at the level of protein was detected using STRING to predict PPI among DEGs. To start with, a total of the 325 DEGs (141 up-regulated and 184 down-regulated) were deposited to the STRING Website to acquire the data on PPI. Then, we obtained 295 genes for constructing PPI networks and the remaining were taken off because of unsuccessful identification or isolation from interaction network. Totally, the network consisted of 668 edges and 201 nodes, for which, the enrichment p-value was 1.0×10⁻¹⁶. Some nodes that showed no connection with others were hided. Then we obtained a significant network based on the combined score of edges to explore candidate molecules that exhibit crucial roles in the network by using the software cytoscape (https://cytoscape.org/) (Figure 3A).
The edges between nodes in the network was attached with a continuous color attribute. The darker the color, the stronger the relationship between the two node proteins of one edge. Besides, if a node had multiple edges with others, it suggested that this node protein may possibly have a pivotal part in the PPI network, which could also be called hub gene. Next, A significant and in-depth analysis was performed from the PPI network using MCODE plugin obtained in cytoscape. The tool can find closely related regions in the PPI network that may represent molecular complexes, and screen out sub-networks at the same time. In our network, several node proteins, including STAT1, IFIT3, IFIT1, IRF4, IFITM3, IRF9, MX2, XAF1, IFI6 etc. exhibited a robust association with other node proteins, suggesting that these proteins have higher degrees of hub (Figure 3B). These genes were thought to act as core molecules in the PPI interaction.
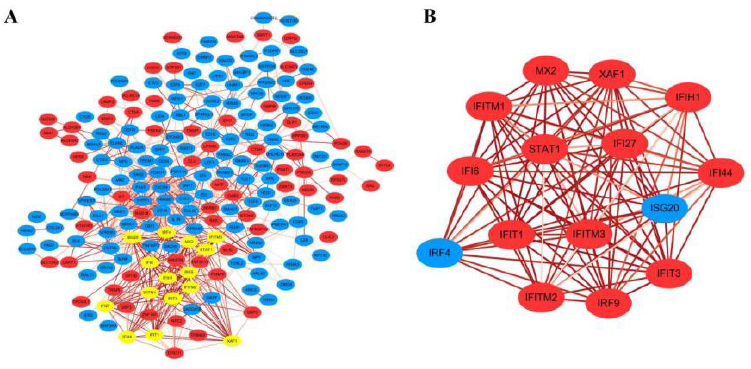
Figure 3:
(A) DEGs PPI network.
(B) Sub-network of hub genes by using MCODE plugin in cytoscape.
The red color exhibits up-regulated genes while the blue means the down-regulated genes. The yellow color highlighted in network represented hub genes analyzed by MCODE. And the depth of the edge color represents the strength of the connection between genes.
Verification Expression of Hub Genes
Although we have screened some hub genes that may have a core role in PPI network, yet this is only based on bioinformatics speculation and statistical probability calculations. Therefore, in order to verify whether obtained hub genes can potentially reveal MDS pathogenesis, we selected two additional data sets from GEO database for verification. As the results showed, we analyzed and visualized the level of hub genes expression in two data sets, GSE61853 and GSE145733. In both of them, we observed that the hub genes expression was differed significantly between control (normal individuals) and MDS patients, which meant a high expression in the MDS group and low expression in the control group (Figure 4A & 4B). Next, after statistically analysis of expression levels among hub genes in samples, we found that several genes such as XAF1, MX2, IFITM1, IFITM2, IFITM3, and IFI6 in GSE61853 data set were significantly different between normal control and MDS patients, whereas IRF9, IFITM3, and IFI27 performed significant in GSE145733 data set (Figure 4C & 4D).
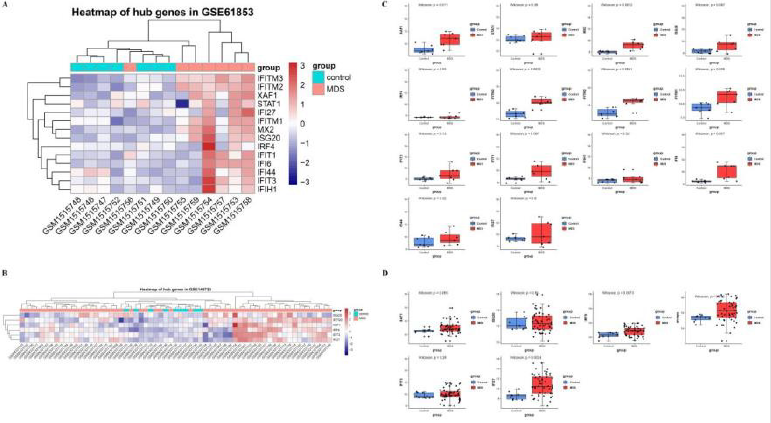
Figure 4: The hub genes expression in GSE61853 and GSE145733 data sets.
(A) The expression of hub genes in GSE61853 visualized by heat map.
(B) The expression of hub genes in GSE145733 visualized by heat map.
(C) Box plots of expression of hub genes in GSE61853 after statistical calculation.
(D) Box plots of expression of hub genes in GSE145733 after statistical calculation.
For (A) and (B), red color exhibits up-regulated genes while the blue means the down-regulated genes. The correlation between color and the fold change of genes expression level is displayed in the upper right. And for (C) and (D), the Wilcoxon test was used to compare the differences of hub genes between MDS patients and normal controls. And set p-value<0.05 as a cut-off criterion.
Exploration of Hub Genes in GEPIA
Given the tendency of MDS to transform to AML, we employed the GEPIA software to further explore the obtained hub genes. According to the analysis of this database, we found that eight hub genes expressed significantly different between normal samples and AML patient samples (Figure 5A). On evaluating the TCGA data to assess the trend of these genes, all expression of hub genes were observed up-regulated in AML group than normal. Moreover, the survival curve of each hub gene was visualized in Figure 5B, such as IFIT3, IRF9, and IFITM3 both exhibited lower survival rates in the AML group, yet other genes failed to show statistically significant under survival curves. Based on the above analysis of hub genes, we speculated that whether a gene that is highly expressed in the AML group or has a large impact on survival rate of patients, it may be a new direction to explore the pathogenesis of MDS and disease progression.
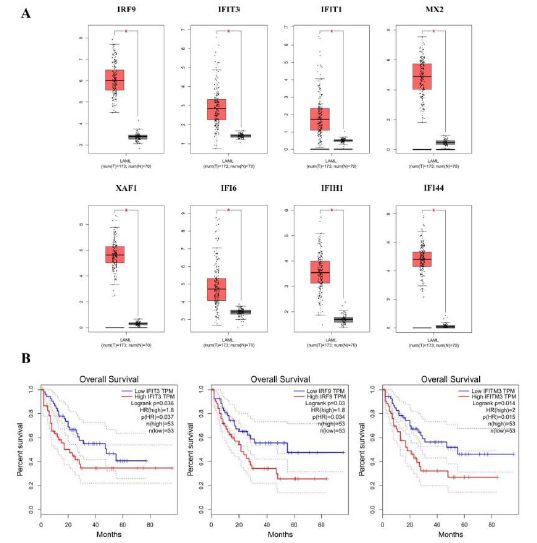
Figure 5: Exploration of hub genes in GEPIA.
(A) Box plots showed the expression of eight hub genes by using GEPIA.
(B) Significant association of three of hub genes with AML patients overall survival, through a log-rank test and a Kaplan- Meier curve.
Based on the median, the patients were categorized into high-level and low-level groups. For (A), red color exhibits AML patients while gray means the normal individuals.
Discussion
Over few decades in past, the causes and inherent mechanisms of the MDS pathogenesis and advancement were examined through several basic and clinical studies. Plenty of researchers have had the same consensus that recurrent cytogenetic aberrations, genetic mutations, and variable expression were closely related to the eventual development of MDS and affect the identification of its subtypes [22-24]. Yet the incidence of MDS is still very high in the world, and mostly progress to AML. This is largely due to the focus of most studies on one genetic event, or the derivation of results from only one cohort study [25-28]. Individual selection of any data set for a single analysis may cause gene redundancy or omission, which can be artificially called false positives or false negatives to some extent. And in recent years, such as integrative analysis had provided a new direction in many disease research for development and diagnosis [29-31]. So, we identified DEGs by integrating three cohorts microarray data sets from various groups, analyzed deeply using bioinformatics methods in our study. Therefore, we could identify a series of hub genes, which may have important part in the pathogenesis of MDS and conversion into AML.
R software and associated packages were powerful for gene expression microarrays analysis. Through this tool, we obtained 141 up-regulated and 184 down-regulated DEGs co-expressed among three data sets. To further discern the physiological function and processes that may contain DEGs, we performed functional enrichment analysis to find possible terms that may be related to the pathogenesis of MDS. The current study found that most of the up-regulated DEGs are concentrated in interferon-related items, mostly concentrate on type I, which mainly for defensing virus, just like other terms that up-regulated genes enriched. This slightly differed from previous research which demonstrated that malignant myeloid cells from MDS patient can use STAT3 pathway as well as PD-1 ligands to survive immunity mediated by Interferon-γ (IFN-γ) and to sustain secondary immune resistance [32]. Since it belongs to the same family as IFN-γ, it is unclear whether type I interferon mediates related signaling pathways in the pathogenesis of MDS and should require further experimental investigation.
And this observation may support the hypothesis that the antiviral immune response caused by continuous stimulation of the virus in the early stages of MDS has an impact on the disease process. After all, one research had shown that some patients with MDS have undergone allogeneic hematopoietic stem cell transplantation to reactivate latent EBV in vivo, which indicated a viral infection in early status of MDS patients [33]. Meanwhile, the DEGs that were down-regulated were found to be enriched in in biological processes associated with leukocyte and lymphocyte function, which suggested significant down-regulation of terms related to adaptive immune response. Previous studies have demonstrated that monocyte from MDS patients may contribute to fighting infection as they do not exhibit gross immune deficit in the peripheral blood [34]. Our results echo this, and we hypothesize that the immune response in patients with MDS is mainly performed by monocytes in the absence of an adaptive immune response. Based on the subsequent GSEA analysis, we know that the results obtained by the enrichment analysis were consistent, which lays the foundation for the next in-depth analysis.
By constructing PPI network, formation of sub-network, through a series of hub genes have been observed, including IRF4, IRF9, IFIT1, IFITM2, IFITM3, IFIT3, IFI6, STAT1, ISG20, IFI44, IFI27, IFITM1, MX2, XAF1, and IFIH1, of which several genes have been reported to associate with MDS. For instance, IFIT1 and IFITM1 were reported as interferon-stimulated genes (ISGs) in normal CD34+ cells, showed the significantly up-regulated, which were potential diagnostic markers for MDS [10]. This is consistent with the findings of our analysis. In our study, it obviously showed that IFIT1 and IFITM1 are not only contained in the most significantly up-regulated gene terms, but also play a core role in the PPI network. In addition, the above two genes also showed upregulated expression in the two data sets which we downloaded for validating hub genes. A study conducted recently also reported the DEGs identification in MDS, in accordance with our study [35]. The study used two of the same data sets (GSE19429 and GSE58831) as ours and identifying DEGs that may be involved in MDS progression and prognosis including IRF4, IFIT1, ISG20, IFITM1 etc., which were as also observed in this study.
Despite the intersection of the data sets used for analysis, unlike Le’ s study [35], our study combined enrichment analysis and GSEA to more accurately interpret the DEGs that may be involved in biological processes and signal pathways. In addition, the network analysis revealed hub genes that were not only verified through additional data sets, but also their role in AML were explored through TCGA online tools. Surprisingly, other hub genes have not been reported in relation to MDS, and it may be possible to find a link to disease after further research. In order to explore whether our hub genes had an impact on the progression of MDS to AML, we analyzed the gene expression and prognosis through the GEPIA online tool. In our study, we revealed that the expressions of totally eight hub genes including IRF9, IFIT1, IFIT3, MX2, XAF1, IFI6, IFIH1, IFI44 were significantly higher in AML patient samples than normal samples. Combined with the expression of these hub genes in the data set we analyzed, we can infer that they play crucial part in the pathological process that drives the transition from MDS to AML.
One research showed that AML was negatively correlated with IRF9, which by SIRT1-p53 pathway repression and that IRF9 may be a potential target for AML treatment [36]. This is inconsistent with the results obtained by us and the results of online analysis. It is speculated that there may be other genes or regulatory factors involved in the gene’s function. Although other genes that are highly expressed in the AML group have not been reported, we found interestingly that interferon-related genes are necessarily associated with MDS or AML. In our study of survival analysis, the only three hub genes showing significant differences in their expression levels (p-value<0.05) were ITIF3, IFITM3, and IRF9. Among them, IFIT3 belonged to the human tetratricopeptide repeats gene family, which were expressed at low levels in most cell types, whereas it may greatly enhanced by viral infection, interferon treatment, and Pathogen-associated molecular patterns (PAMPs) [37]. In addition, a significant part of the interferon signaling pathway, the Interferon-induced transmembrane protein (IFITM) family possibly took part in regulating immune cell adhesion, signaling, and cancer. Moreover, another research indicated that high expression of IFITM3 may provide an adverse prognosis for AML [38]. This evidence once again demonstrated the reliability of our findings.
Conclusion
To conclude, using several microarray data sets and consolidated bioinformatic analysis, 325 co-expressed DEGs were identified, which were enriched significantly in various pathways, primarily related to interferon signal pathway, defense to virus and adaptive immune response in MDS. After filtered by PPI network, the hub genes were undergoing further analysis. These findings will provide an understanding of the causes of MDS and its transformation to leukemia, and the analysis of the hub genes and signaling pathways available can be used in the next in-depth explorations aimed at finding therapeutic targets for the disease.
Author Contribution
Mengyi Zhang and Binhan Guo conceptualized this work, provided study’s design, coordination of the study, and wrote the initial and final version of the manuscript. Mengyi Zhang downloaded data from databases, performed microarray data analysis, including data quality control. Binhan Guo performed survival prediction and statistical and gene network analyses. All the authors have read and approved the final manuscript.
Acknowledgement
The authors would like to thank the NCBI-GEO, GEPIA, and STRING databases for valuable data.
Funding
No funding was received.
Conflicts of Interest
The authors declare that they have no competing interests.
Data Availability Statement
The gene microarray data sets are available at NCBI–GEO: GSE4619, GSE19429, GSE58831, GSE61853, and GSE145733.
Ethical Statement
The authors are accountable for all aspects of the work in ensuring that questions related to the accuracy or integrity of any part of the work are appropriately investigated and resolved.
References
- Shumilov E, Flach J, Kohlmann A, Banz Y, Bonadies N, et al. (2018) Current status and trends in the diagnostics of AML and MDS. Blood Reviews 32(6): 508-519.
- Mufti GJ, McLornan DP, van de Loosdrecht AA, Germing U, Hasserjian RP (2018) Diagnostic algorithm for lower-risk myelodysplastic syndromes. Leukemia 32(8): 1679-1696.
- Chihara D, Ito H, Katanoda K, Shibata A, Matsuda T, et al. (2014) Incidence of myelodysplastic syndrome in Japan. J Epidemiol 24(6): 469-473.
- Dinmohamed AG, Visser O, van Norden Y, Huijgens PC, Sonneveld P, et al. (2014) Trends in incidence, initial treatment and survival of myelodysplastic syndromes: a population‐based study of 5144 patients diagnosed in the Netherlands from 2001 to 2010. Eur J Cancer 50(5): 1004-1012.
- Cogle CR (2015) Incidence and burden of the myelodysplastic syndromes. Curr Hematol Malig Rep 10(3): 272-281.
- Zeidan AM, Shallis RM, Wang R, Davidoff A, Ma X (2019) Epidemiology of myelodysplastic syndromes: Why characterizing the beast is a prerequisite to taming it. Blood Rev 34: 1-15.
- Ye X, Chen D, Zheng Y, Wu C, Zhu X, et al. (2019) The incidence, risk factors, and survival of acute myeloid leukemia secondary to myelodysplastic syndrome: A population-based study. Hematological Oncology 37(4): 438-446.
- Quackenbush J (2006) Microarray Analysis and Tumor Classification. N Engl J Med 354(23): 2463-2472.
- Gusnanto A, Calza S, Pawitan Y (2007) Identification of differentially expressed genes and false discovery rate in microarray studies. Curr Opin Lipidol 18(2): 187-193.
- Pellagatti A, Cazzola M, Giagounidis AN, Malcovati L, Porta MGD, et al. (2006) Gene expression profiles of CD34+ cells in myelodysplastic syndromes: involvement of interferon-stimulated genes and correlation to FAB subtype and karyotype. Blood 108(1): 337-345.
- Pellagatti A, Cazzola M, Giagounidis A, Perry J, Malcovati L, et al. (2010) Deregulated gene expression pathways in myelodysplastic syndrome hematopoietic stem cells. Leukemia 24(4): 756-764.
- Gerstung M, Pellagatti A, Malcovati L, Giagounidis A, Porta MGD, et al. (2015) Combining gene mutation with gene expression data improves outcome prediction in myelodysplastic syndromes. Nat Commun 6: 5901.
- Kim M, Hwang S, Park K, Kim SY, Lee YK, et al. (2015) Increased expression of interferon signaling genes in the bone marrow microenvironment of myelodysplastic syndromes. PLoS One 10(3): e0120602.
- Szikszai K, Krejcik Z, Klema J, Loudova N, Hrustincova A, et al. (2020) LncRNA Profiling Reveals That the Deregulation of H19, WT1-AS, TCL6, and LEF1-AS1 Is Associated with Higher-Risk Myelodysplastic Syndrome. Cancers (Basel) 12(10): 2726.
- Chen An T, Yi Ju C, Chen JJ (2003) Testing for differentially expressed genes with microarray data. Nucleic Acids Res 31(9): e52.
- Phipson B, Lee S, Majewski IJ, Alexander WS, Smyth GK (2016) Robust hyperparameter estimation protects against hypervariable genes and improves power to detect differential expression. Ann Appl Stat 10(2): 946-963.
- Smyth GK (2005) Limma: linear models for microarray data. Bioinformatics and computational biology solutions using R and Bioconductor. New York: Springer, pp. 397-420.
- Yu G, Wang LG, Han Y, He QY (2012) clusterProfiler: an R package for comparing biological themes among gene clusters. OMICS 16(5): 284-287.
- Subramanian A, Tamayo P, Mootha VK, Mukherjee S, Ebert BL, et al. (2005) Gene set enrichment analysis: a knowledge-based approach for interpreting genome-wide expression profiles. Proc Natl Acad Sci USA 102(43): 15545-15550.
- Powers RK, Goodspeed A, Pielke Lombardo H, Tan AC, Costello JC (2018) GSEA-InContext: identifying novel and common patterns in expression experiments. Bioinformatics 34(13): i555-i564.
- Tang Z, Li C, Kang B, Gao G, Li C, et al. (2017) GEPIA: a web server for cancer and normal gene expression profiling and interactive analyses. Nucleic Acids Res 45(W1): W98-W102.
- Bejar R, Stevenson K, Abdel Wahab O, Galili N, Nilsson B, et al. (2011) Clinical effect of point mutations in myelodysplastic syndromes. N Engl J Med 364(26): 2496-506.
- Papaemmanuil E, Gerstung M, Malcovati L, Tauro S, Gundem G, et al. (2013) Clinical and biological implications of driver mutations in myelodysplastic syndromes. Blood 122(22): 3616-3627.
- Shallis RM, Ahmad R, Zeidan AM (2018) The genetic and molecular pathogenesis of myelodysplastic syndromes. Eur J Haematol 101(3): 260-271.
- Hosono N (2019) Genetic abnormalities and pathophysiology of MDS. Int J Clin Oncol 24(8): 885-892.
- Boddu P, Kantarjian H, Garcia Manero G, Allison J, Sharma P, et al. (2018) The emerging role of immune checkpoint based approaches in AML and MDS. Leuk Lymphoma 59(4): 790-802.
- Sánchez JMH, Lumbreras E, Díez Campelo M, González T, López DA, et al. (2020) Ana Eugenia Rodríguez Vicente. Genome-wide transcriptomics leads to the identification of deregulated genes after deferasirox therapy in low-risk MDS patients. Pharmacogenomics J 20(5): 664-671.
- Huang HH, Chen FY, Chou WC, Hou HA, Ko BS, et al. (2019) Long non-coding RNA HOXB-AS3 promotes myeloid cell proliferation, and its higher expression is an adverse prognostic marker in patients with acute myeloid leukemia and myelodysplastic syndrome. BMC Cancer 19(1): 617.
- Tang S, Jing H, Huang Z, Huang T, Lin S, et al. (2020) Identification of key candidate genes in neuropathic pain by integrated bioinformatic analysis. J Cell Biochem 121(2): 1635-1648.
- Zhang YJ, Sun YZ, Gao XH, Qi RQ (2019) Integrated bioinformatic analysis of differentially expressed genes and signaling pathways in plaque psoriasis. Mol Med Rep 20(1): 225-235.
- Zhong X, Huang G, Ma Q, Liao H, Liu C, et al. (2019) Identification of crucial miRNAs and genes in esophageal squamous cell carcinoma by miRNA-mRNA integrated analysis. Medicine (Baltimore) 98(27): e16269.
- Yoyen Ermis D, Tunali G, Tavukcuoglu E, Horzum U, Ozkazanc D, et al. (2019) Myeloid maturation potentiates STAT3-mediated atypical IFN-γ signaling and upregulation of PD-1 ligands in AML and MDS. Sci Rep 9(1): 11697.
- Wang H, Zhang TT, Qi JQ, Chu TT, Miao M, et al. (2019) Incidence, risk factors, and clinical significance of Epstein-Barr virus reactivation in myelodysplastic syndrome after allogeneic haematopoietic stem cell transplantation. Ann Hematol 98(4): 987-996.
- Pollyea DA, Hedin BR, O'Connor BP, Alper S (2018) Monocyte function in patients with myelodysplastic syndrome. J Leukoc Biol 104(3): 641-647.
- Le Y (2019) Screening and identification of key candidate genes and pathways in myelodysplastic syndrome by bioinformatic analysis. PeerJ 7: e8162.
- Tian WL, Guo R, Wang F, Jiang ZX, Tang P, et al. (2018) The IRF9-SIRT1-P53 axis is involved in the growth of human acute myeloid leukemia. Exp Cell Res 365(2): 185-193.
- Pidugu VK, Pidugu HB, Wu MM, Liu CJ, Lee TC (2019) Emerging Functions of Human IFIT Proteins in Cancer. Front Mol Biosci 6: 148.
- Liu Y, Lu R, Cui W, Pang Y, Liu C, et al. (2020) High IFITM3 expression predicts adverse prognosis in acute myeloid leukemia. Cancer Gene Ther 27(1-2): 38-44.
