 Research Article
ABSTRACT
Peri-coronary adipose tissue (PCAT) was an indicator to detect the coronary inflammation. We aimed to analyze the PCAT characteristics of right coronary artery (RCA) with or without plaque using texture analysis by coronary computed tomography angiography (CCTA). This article was a retrospective case-control study. In total, 67 patients with coronary artery disease were enrolled from December 2018 to September 2019. The patients were divided into two groups according to whether there are plaques existing at the RCA vessels. The radiomic features of RCA vessels calculated on the PCAT regions between groups were compared using Mann-Whitney U test. Receiver operating characteristic curve (ROC) analysis was performed to evaluate the performance of each significant features to differentiate the group with or without plaques. 43 patients without RCA plaque and 24 patients with RCA plaque were included in the study. 1218 radiomic features were finally calculated, among which wavelet-based texture features were more significantly different between RCA plaque group and RCA non-plaque group. Furthermore, wavelet_LLL_firstorder_Maximum had the highest Area Under Curve (AUC) 0.78. Therefore, PCAT texture analysis is expected to be used as a new detection method to determine the existence of coronary artery disease.
Keywords: Adipose Tissue; Coronary Artery Disease; Computed Tomography Angiography
Abbreviations: PCAT: Peri-Coronary Adipose Tissue; RCA: Right Coronary Artery; CCTA: Coronary Computed Tomography Angiography; ROC: Receiver Operating Characteristic Curve; AUC: Area Under Curve; IVUS: Intravascular Ultrasound; OCT: Optical Coherence Tomography; CT: Computed Tomography; NCP: Non-Calcified Plaque Load
Introduction
Vulnerable plaques in coronary arteries are at higher risk of rupture and often lead to severe adverse events. Morphological features of vulnerable plaques can be assessed by several methods like coronary angiography, intravascular ultrasound (IVUS) and optical coherence tomography (OCT). All these procedures are invasive and costly, also they are lacking the ability to evaluate the pathophysiology of the plaques. Noninvasive CT based angiography has shown higher value in detecting both vulnerable plaques and peri-coronary adipose tissue (PCAT) [1]. PCAT is defined as any adipose tissue that located in the adventitial layer of coronary arteries and is regarded typically as support material. Recently, it has been proved that PCAT is biologically active and responsible for the progression the coronary plaques [2].The attenuation index of PCAT detected by CCTA was found to be related with plaque characteristics and was associated with severity of coronary artery disease in several studies [3,4]. With the technique advancement of high resolution CT scan, multiple texture features can be acquired and be used to evaluate biological and pathological information of PCAT. In this study, we performed texture analysis of PCAT using CCTA, and sought to establish the correlation between PCAT texture and coronary plaques.
Material and Methods
Patients
This study was approved by the Ethics Committee of the Southeast University Affiliated Jiangyin Hospital and conducted under Helsinki declaration. 67 CAD patients who underwent CCTA in Jiangyin people’s hospital from December 2018 to September 2019 were enrolled in our research. Written informed consents were obtained from all participants. Patients with previous history of coronary stent implantation and/or bypass surgery were exclude.
Coronary CTA Acquirement
Coronary CTA was performed by using Philips Brilliance iCT 256-slice (tube collimation =2×128×0.625mm, pitch=0.18, current=400 mAseff, voltage=120kV, tube-rotation-time=270ms), 25-50mg metoprolol tartrate tablets were administered to acquire a target heart rate of <70 beats/min. 50-60 ml commercial contrast media with 320 mg/ml iodine concentration (VISIPAQUE 320 GE HEALTHCARE, USA) was given by intravenously at a speed of 4.5- 5ml/s via median cubital vein. Retrospective ECG gating techniques was used for plane acquisition and aortic root was used as land marker with the trigger threshold of 110 Hounsfield units.
Plaque Analysis
Coronary plaques were diagnosed by two independent experienced coronary radiologists visually. Whether there were calcium, non-calcium or mixed plaques all need to be identified by radiologists.
A CQK software (Coronary Artery Quantitative Analysis Kit, GE Healthcare, China) dedicated to coronary analysis was used to extract the PCAT region (Figure1). Firstly, the coronary CTA DICOM images were imported into CQK software, then, the RCA was segmented using a pretrained V-NET model, the RCA was expanded using the size same to the vessel diameters. The expanded vessels extracted the initial vessels to obtain the pericoronary regions. Finally, -190 HU to -30HU were adopted as adipose CT decaying range to filter the non-adipose voxels to get the ROI of PVAT. Pyradiomics software (version 3.0.1, https://pyradiomics. readthedocs.io/en/latest/) was used to extract the radiomic features of PCAT using example CT.yaml setting files. Pyradiomics is a widely accepted feature extraction tools complied to the ISBI. 1218 features including shape features, first-order features and texture features were extracted. Shape features describe the geometry of the ROI, first-order represent the gray value distribution within the ROI. Texture features reflect the gray value distribution in space.
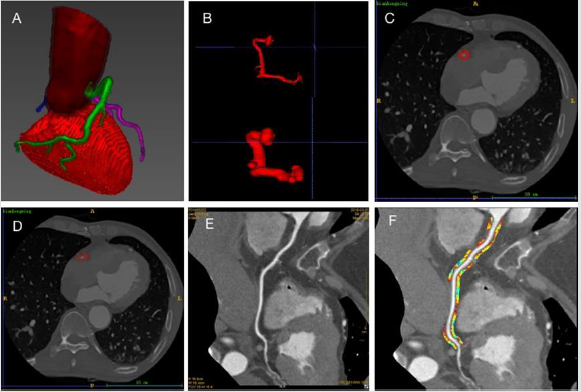
Figure 1: Flowchart of PCAT feature extraction.
A. 3D representation of Coronary artery segmentation.
B. RCA expanded using the size of the maximum diameter of the vessel (figure above, original RCA; figure below, expanded RCA).
C. The peri-coronary area obtained.
D. PCAT obtained after -190 ~ -30HU filtration;
E. Surface reconstruction of artery;
F. Adipose tissue extracted around RCA. RCA: right coronary artery. PCAT: peri-coronary adipose tissue.
Statistical Analysis
R software (version 4.0.1, www.r-progject.org) was used to conduct the statistical analysis. Mann-Whitney U test was performed to compare the radiometric features between nonplaque and plaque groups. Univariate logistic regression analysis was performed to find whether the feature was a significant factor. The performance of the significant feature to differentiate the non-plaque and plaque RCA were evaluated using ROC analysis. We also aimed to build a RF model for discriminating the plaque RCA and non-plaque RCA. mRMR was firstly used to filter the maximum relevant features and minimum redundancy features, and 10 features were finally enrolled into our small sample. Then, a multivariate logistic regression model was built using remaining features. The performance of the model was evaluated using ROC analysis, meanwhile, the cross-validation was used to verifying the robust of the model. We also compared 10 selected features among the patients with different types of RCA plaques. A two-tailed P of < 0.05 was regarded as significant.
Results
Patient Characteristics
Patients were divided into two groups according to whether there was significant lesion in right coronary artery. The demographic and risk factors of all the subjects were presented in (Table1). Finally, we have 24 CAD patients have plaques at RCA (positive group) and 43 patients without RCA plaques (negative group).There was no significant difference between the patients with RCA lesions and patients without RCA lesions regarding age and sex. There was no significant difference in frequency of hypertension, diabetes mellitus, hyperlipidemia, smoking between two groups.
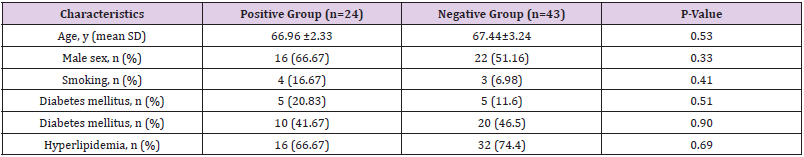
Table 1: Patient characteristics comparison.
Note: Values are presented as number (%) or mean ± SD. P-value<0.05 was considered to be statistically significant.
Correlation Between Radiomic Features and Clinical Data
As shown in (Figure 2), most of significant features were wavelet-based, especially, LHL, LHH and LLL-filtered wavelet features. After mRMR feature selection, 10 features were kept and analyzed using ROC analysis, as shown in (Figure 3), the AUC values of them were all larger than 0.67, and wavelet_LLL_first order_ Maximum had highest AUC 0.78. The ROC of the differentiation model was shown in (Figure 4), the AUC was 1(95%CI: 0.99-1.00). The accuracy, specificity and sensitivity were 0.98, 0.99, 0.97, respectively. The most important feature in the model is original_ shape_Flatness. The cross-validation also showed the model had accuracy. The accuracy, specificity and sensitivity were 0.84, 0.82, 0.86, respectively. The cross validation AUC curve was shown in (Figure 4b), and mean AUC was 0.89. As shown in (Figure 5), the barplot of feature importance in RF model. The longer the blue bar is, the more important the corresponding feature is. We also compared 10 selected features among the patients with different type of plaque, and found wavelet_HHH_glrlm_RunEntropy was significantly different between calcified plaque and soft plaque (p = 0.016), and original_shape_Flateness and wavelet_LHH_glcm_ Cluster Prominence had the trend to be different. See (Figure 6).
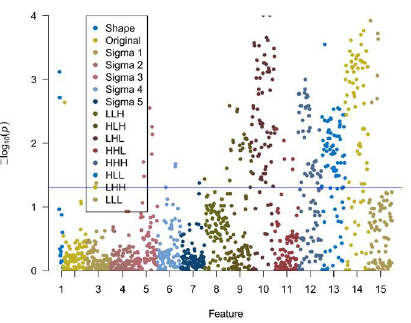
Figure 2: The Manhattan figure of radiomics features -log10(p) values. The p values were calculated using Mann-Whitney U test. The blue line represented as p = 0.05.
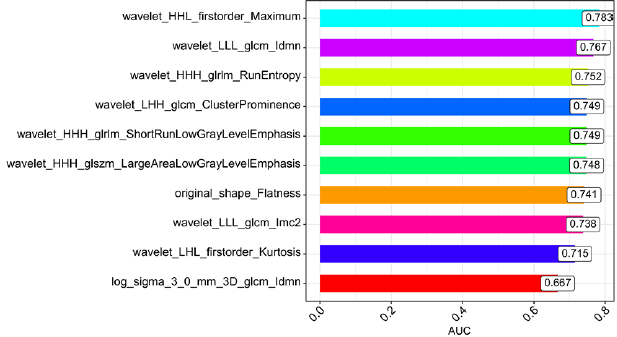
Figure 3: The AUC barplot of 10 radiomic features. The value in the box is AUC value.
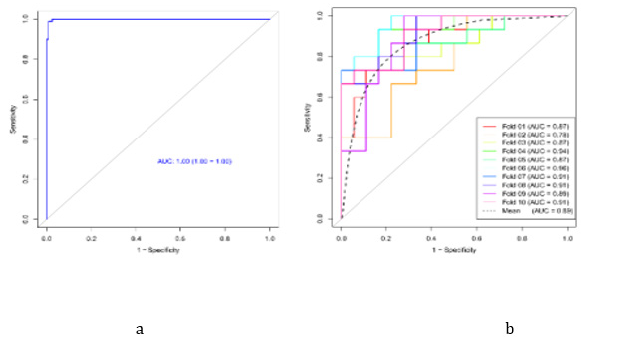
Figure 4:
a) The ROC curve and
b) Mean ROC curve of RF model in discriminating the non-plaque and plaque RCA vessels. The AUC of RF model is 1(95%CI: 1.00-1.00).
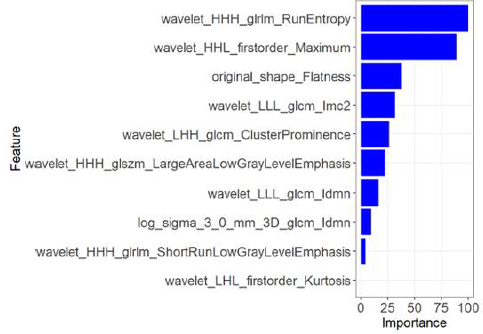
Figure 5: The barplot of feature importance in RF model. The longer the blue bar is, the more important the corresponding feature is.
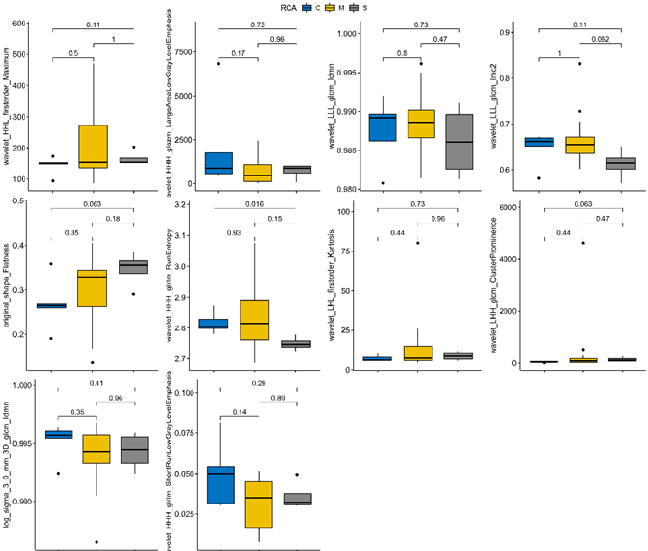
Figure 6: 10 radiomics features comparison among 3 classes plaque. C: calcified plaque, M: mixed plaque, S: soft plaque.
Discussion
This article mainly discussed the difference of texture features of peri-coronary adipose tissue (PCAT) with and without coronary artery lesions by coronary CTA imaging, and found that texture features of PVAT is helpful to predict the existence of plaques in coronary arteries. Among these features, waveket_LLL_firstorder_ Maximum and wavelet_LLL_glcm_ldmn were both good predictors. Marton Kolossvary et al., found that coronary CTA radiomics can identify plaque vulnerability by relevant radionuclide imaging markers, which had high diagnostic accuracy and was significantly better than the conventional CT in the quantitative and qualitative analysis of high-risk plaque features. For radiomics, Intravascular ultrasound (IVUS) was more accurate in judging delayed plaque progression, while optical coherence tomography (OCT) was more suitable for identifying thin-cap fibroatheroma (TCFA), and NaF18- PET was more suitable for identifying invasive and radionuclide imaging markers, the performance of which were all better than the traditional CT index (P<0.001) [5]. Coronary 18F-NaF uptake reflected the rate of calcification of coronary atherosclerotic plaques, and the increase of (PCAT) concentration was related to vascular inflammation. Jacek Kwiecinski et al., found that PCAT density in patients with stable high-risk plaques was associated with coronary artery uptake of CTA [6].
The heart and coronary arteries are surrounded by a layer of adipose tissue, which is a complex organ composed of osteoblasts, stromal cells, macrophages and neuronal networks, nourished by rich coronary microcirculation. PCAT is a kind of visceral adipose tissue originating from mesothelium, which is usually wrapped around the main coronary artery on the surface of the heart and functionally different from the epicardial adipose tissue on the surface of myocardium [7,8]. PVAT is composed of small adipocytes with irregular shape, small accumulation of lipid droplets and low degree of differentiation. Mouse PVAT is composed of white and brown adipocytes. The expression of adipocyte-related genes in PVAT, such as PPAR γ, C/EBP α, Perilipin, ATLG, Leptin and adiponectin, are lower than that in subcutaneous and peri-renal adipose tissue [9]. PVAT can secrete factors locally, increase coronary artery tension and promote inflammation [10]. The pathological processes involved in PVAT include increase or decrease of insulin resistance, vasomotor, vascular smooth muscle cell proliferation, arterial stiffness, anti-atherosclerotic and atherogenic effects (by enhancing ROS production, stimulating angiogenesis, endothelial dysfunction and release of TNF-α, MCP-1, TGF-β, IL-1, angiotensin Ⅱ, etc.) [9]. Based on the biological and anatomical relationships between perivascular AT (PVAT) and coronary arteries, PVAT imaging may provide useful information for cardiovascular risk stratification. However, due to the lack of special algorithms, PVAT imaging in most studies was limited to rough analysis of epicardial adipose tissue. Coronary artery CT angiography provides the best features of PCAT [2].
In our study, we analyzed the texture of adipose tissue around RCA and found that wavelet_LLL_firstorder_Maximum, wavelet_ LLL_glcm_Idmn, original_shape_Flatness, wavelet_HHH_gldm_ Large Dependence Low Gray Level Emphasis and wavelet_LHL_ firstorder_Kurtosis were the most important five features in discriminating RCA with or without plaques. Some studies have shown that in the presence of exogenous inflammatory stimulation, PCAT showed the smaller size of adipocytes, lipid accumulation and poor differentiation, which was related to the transformation of lipophilic components to hydrophilic components in adipose tissue, as well as the decaying gradient of adipose tissue on computed tomography (CT). In conventional coronary CTA, we can track the three-dimensional changes of PVAT phenotype and use it as a dynamic marker of inflammatory state of adjacent vessels [2]. PCAT decaying and non-calcified plaque load (NCP) measured by coronary CTA were associated with the occurrence of cardiac events and contributed to the quantitative assessment of cardiovascular risk [11]. There are still limitations in this study. The laboratory data of patients were not obtained and the relationship between biochemical indicators and coronary plaque characteristics cannot be analyzed. The relationship between vulnerable plaque characteristics and PCAT was also not further studied. In conclusion, we found that PCAT texture analysis is expected to be used as a new detection method to determine the existence of coronary artery disease.
Acknowledgment
This paper and the research behind it would not have been possible without the exceptional support of my friend, Dr. Dong Wang. He is an excellent radiologist. During the whole study, he kept giving inspiration and technique support.
Conflict of Interest
The authors have declared that no conflict of interest exists.
References
- Schlett CL, Ferencik M, Kriegel MF, Fabian Bamberg, Brian B Ghoshhajra, et al. (2012) Association of pericardial fat and coronary high-risk lesions as determined by cardiac CT. Atherosclerosis 222(1): 129-134.
- Mancio J, Oikonomou EK, Antoniades C (2018) Perivascular adipose tissue and coronary atherosclerosis. Heart 104(20): 1654-1662.
- Pandey NN, Sharma S, Jagia P, Sanjeev Kumar (2020) Epicardial fat attenuation, not volume, predicts obstructive coronary artery disease and high risk plaque features in patients with atypical chest pain. Br J Radiol 93(1114): 20200540.
- Antoniades C, Shirodaria C (2019) Detecting Coronary Inflammation with Perivascular Fat Attenuation Imaging: Making Sense from Perivascular Attenuation Maps. JACC Cardiovasc Imaging 12(10): 2011-2014.
- Kolossvary M, Park J, Bang JI, Jinlong Zhang, Joo Myung Lee, et al. (2019) Identification of invasive and radionuclide imaging markers of coronary plaque vulnerability using radiomic analysis of coronary computed tomography angiography. Eur Heart J Cardiovasc Imaging 20(11): 1250-1258.
- Kwiecinski J, Dey D, Cadet S, Sang Eun Lee, Yuka Otaki, et al. (2019) Peri-Coronary Adipose Tissue Density Is Associated With (18)F-Sodium Fluoride Coronary Uptake in Stable Patients with High-Risk Plaques. JACC Cardiovasc Imaging 12(10): 2000-2010.
- Iozzo P (2011) Myocardial, perivascular, and epicardial fat. Diabetes Care 34(2): S371-379.
- Verhagen SN, Vink A, Van der Graaf Y, Frank L J Visseren (2012) Coronary perivascular adipose tissue characteristics are related to atherosclerotic plaque size and composition. A post-mortem study. Atherosclerosis 225(1): 99-104.
- Grigoras A, Amalinei C, Balan RA, Simona Eliza Giusca, Irina Draga Caruntu (2019) Perivascular adipose tissue in cardiovascular diseases-an update. Anatol J Cardiol 22(5): 219-231.
- Owen MK, Noblet JN, Sassoon DJ, Abass M Conteh, Adam G Goodwill, et al. (2014) Perivascular adipose tissue and coronary vascular disease. Arterioscler Thromb Vasc Biol 34(8): 1643-1649.
- Tzolos E, Mc Elhinney P, Williams MC, Sebastien Cadet, Mark R Dweck, et al. (2020) Repeatability of quantitative pericoronary adipose tissue attenuation and coronary plaque burden from coronary CT angiography. J Cardiovasc Comput Tomogr 15(1): 81-84.
