 Research Article
Abstract
An ultraviolet (365 nm) light-emitting diode (UV LED) was used to replace a mercury arc in both a microscope spectrofluorometer and a fiber optic probe to detect the fluorescence of connective tissues in venison meat. Meat samples were from wild Odocoileus virginianus and farmed Cervus elaphus. Apparatus was tested by measuring the fluorescence emission spectrum of uranyl glass. Connective tissues from the Lumbodorsal fascia (a major seam of connective tissue over the main muscle of a rib steak) had a fluorescence emission maximum at 480 nm. The thick fascia of wild venison had a wider spectrum than that of the thin fascia of farmed venison. The fiber optic probe with a UV LED gave correct results when tested on the relatively weak connective tissues of farmed venison. The probe was not sharp enough to penetrate easily through the thick Lumbodorsal fascia of wild venison - the fluorescence signal was constant until the needle tip broke through. Thus, venison may have connective tissues with both strong tensile strength and strong fluorescence. CIE (Commission Internationale de l’Éclairage) chromaticity coordinates were calculated from spectra of visible light through muscle using different optical pathways. The contributions of Fresnel and Lambertian scattering to muscle color were identified. Penetration of low wavelengths through muscle was minimal, so fluorescence peaks may only occur when connective tissues pass an optical window.
Keywords: Ultraviolet; Light-Emitting Diode; Venison; Connective Tissue; Fluorescence
Introduction
There are three major sources of meat toughness – contracted muscle fibers locked in rigor mortis, lack of post-mortem autolysis (ageing) and connective tissues [1]. So far, the only source of toughness predictable by rapid, non-destructive measurements early enough to sort or grade meat before distribution has been a fiber optic probe to detect connective tissue fluorescence. To sort meat before distribution in a commercial environment there is no possibility of using a destructive method (excised meat samples) or fragile apparatus. Fortunately, the two dominant connective tissue proteins causing toughness (elastin and strongly cross-linked collagen) both fluoresce when illuminated with UV light. Thus, UV light may be launched into the proximal window of an optical fiber mounted in a probe, and the fluorescence of connective tissues at the distal window in the probe may be detected from light passing back up the optical fiber. The key component is a dichroic mirror to separate outgoing UV from incoming visible fluorescence. A major problem with this technology was the difficulty of producing UV light. Originally this required a mercury arc which had to be maintained almost vertical, which only lasted a few hundred hours, and which required a high-voltage start-up circuit. In a typical commercial environment for the meat industry, this could only be achieved by having fragile and potentially dangerous parts of the apparatus isolated from the probe in the meat by optical fibers and low voltage communication cables. But now it is possible to generate UV light using diodes which require only a low voltage, have a long working life, and operate in any orientation.
Venison, meat from several species of deer, is an expanding market. Venison commands a premium price because of its novel taste and lack of fat, but its optical properties have not been extensively investigated. It was an interesting material on which to test a UV LED.
Materials and Methods
Samples of wild white-tailed deer in Canada (mature Odocoileus virginianus) were compared with farmed New Zealand red deer (immature Cervus elaphus). Samples were refrigerated at 4°C until measurements were made at approximately 18°C. Spectrophotometer measurements were made with a fluorescence microscope using a Zeiss Ultrafluar objective (×6.3, numerical aperture 0.20) following optimization conditions [2]. A UV LED (Nichia NVSU233B, output 365 nm with 3.85 v supply, Tokushima, Japan) was mounted at the focal point of a Zeiss illuminator with quartz optics Figure 1. UV light was directed downwards on to the sample by the dichroic mirror, while fluorescence from the sample passed upwards for spectrophotometry. But before fluorescence measurements could be made, the UV light was shut off and light with a known emission spectrum from a tungsten source was passed up to the photomultiplier through a small aperture, allowing responses of the photomultiplier to various wavelengths to be corrected. This calibration source was then stopped, and UV light was started to measure a blank (a glass microscope slide without a sample) to measure any intrinsic fluorescence in the optical pathway, which was then subtracted from sample measurements. The system was tested by measuring the fluorescence emission spectrum of uranyl glass Figure 2 [3]. The UV LED was also tested in a fiber optic meat probe Figure 3. Needle penetration measurements were made with a depth detector similar to that used for measurements in beef [4]. The probe had a 2.3-mm outer-diameter hypodermic needle with a tip angle of 30° containing a 1-mm diameter plastic optical fiber (Agilent HFBR).
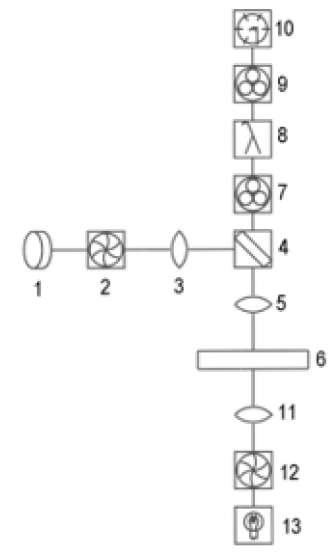
Figure 1: Microscope spectrofluorometer. LED (1), shutter (2), collimating optics (3), dichroic mirror directing UV down but allowing visible light up (4), microscope objective (5), sample (6), variable apertures (7), grating monochromator (8), stray light filters for monochromator (9), photomultiplier (10), substage condenser (11), shutter (12), tungsten bulb (13).
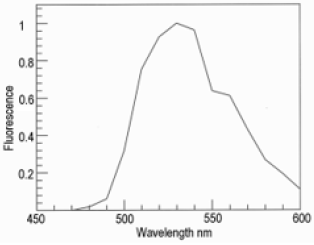
Figure 2: Fluorescence emission spectrum of uranyl glass measured with a UV LED (Nichia NVSU233B).
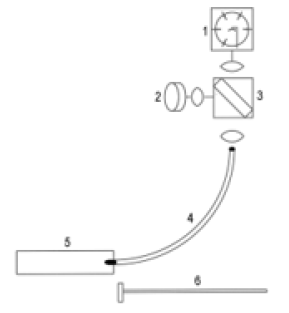
Figure 3: Photomultiplier (1), UV LED (2), dichroic mirror (3), optical fiber with distal tip in a hypodermic needle (4), meat sample (5), and depth detector (6).
Results and Discussion
Figure 4 shows the fluorescence of the Lumbodorsal fascia over the Longissimus dorsi muscle (a layer of tough tissue over the surface of the largest muscle in a rib steak). Both fluorescence maxima were at 480 nm, but the spectrum for wild venison was much wider than the spectrum for farmed venison. This may have been caused by the far greater thickness of the Lumbodorsal fascia in wild compared with farmed venison. The fluorescence probe was tested satisfactorily on farmed venison, as shown in Figure 5. When the probe tip entered the muscle, it detected the epimysium on the muscle surface. Within the muscle, it detected seams of perimysium (connective tissue around bundles of muscle fibers). A UV LED can replace a mercury arc for both fluorescence microscopy and for a fiber optic probe to predict connective toughness in meat. In the first case, a UV LED offers great advantages – a long life illuminator with no problems with high-voltage start-ups, or heat and low-pass filters. In the second case, however, the use of a safe, robust source of UV did not avoid some of the other problems involved with UV meat probes. The basic problem is that meat is an elastic system. When probed, a fluorescent source (such as epimysium or perimysium, Figure 5) is not at the same measured depth when the probe first penetrates a meat sample, as it is when the probe is withdrawn. This may provide markers to measure the elastic deformation of the meat, which also contains useful information [5].
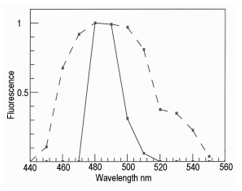
Figure 4: Fluorescence of the Lumbodorsal fascia in wild venison (broken line) and farmed venison (solid line).
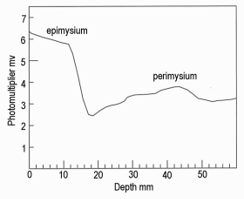
Figure 5: Fluorescence probe measurements using a UV LED through the Longissimus dorsi muscle of farmed venison showing correct detection of the connective tissues on the muscle surface (epimysium) and a major seam of connective tissue within the muscle (perimysium).
Similarly, the force required to penetrate a seam of connective tissue may also be measured with a strain gauge in the system [6], so that the optical probe doubles as a penetrometer. This shows that connective tissues wrap around the probe window – where resistance to penetration is encountered, there is strong fluorescence [7]. In many measurements made through the Lumbodorsal fascia of beef carcasses nothing as extreme as the situation shown in Figure 6 was ever observed. Meanwhile, cooperation with taste panel researchers in Canada, Denmark, England and the USA proved that beef tenderness may be predicted from the fluorescence of connective tissues [8-12]. In Figure 6, once the probe broke through the Lumbodorsal fascia, there was a marked drop in fluorescence. This prompts an obvious question, what are the optical properties of the skeletal muscle underlying the fascia? Little or nothing is known about them apart from the effects of a high myoglobin content [13]. The apparatus in Figure 7 was modified to provide some answers. The UV LED was replaced with visible light from a tungsten source. The dichroic mirror was replaced by a prismatic beam splitter.Color measurements made along the grain of meat (coaxially along the long axes of muscle fibers) differ from measurements made across the grain of meat (perpendicularly to the long axes of muscle fibers) [14]. All measurements made here were in the latter pathway. At a low pH, myofilaments reduce their lateral separation, thus increasing the refractive index of their myofibrils and increasing their lateral reflectance. The effect of pH on the lateral separation of myofilaments may be detected by both polarized light microscopy and x-ray diffraction [15,16].
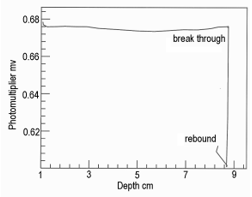
Figure 6: Probe measurements through the Lumbodorsal fascia of wild venison showing detection of the connective tissues on the muscle surface (epimysium), which wrapped around the window of the optical fiber (increasing depth but no change in fluorescence), until the needle burst through the epimysium, followed by an elastic rebound.
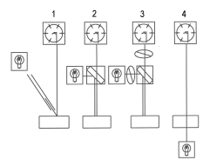
Figure 7: Optical pathways possible with the apparatus in Figure 1. Optical pathways are at 45° illumination of the sample by an optical fiber with vertical photometry (1), vertical illumination with vertical photometry (2), the same again but with crossed polars blocking Fresnel reflectance (3), and transmittance through the sample (4).
Lateral illumination at 45° to the muscle surface is similar to the optical geometry of a colorimeter where any surface gloss is diverted away from the photometer axis. Thus, in meat, the dominant factor in the vertical photometer axis becomes subsurface Lambertian scattering modified by selective absorbance by myoglobin and its derivatives [17,18]. Figure 8 shows the reflectance spectra of farmed venison with pathway 1. Note the dimple around 460 nm showing oxymyoglobin formation [19]. Figure 9 shows the same muscle strip used for Figure 8 but with pathway 2. The reflectance at low wavelengths was much higher than with pathway 1, because the photometer was detecting Fresnel reflectance from the wet sample surface in addition to subsurface Lambertian scattering from muscle fibers, myofibrils and myofilaments. The next experiment was pathway 3, using crossed polars to block Fresnel reflectance Figure 10. The final experiment was pathway 4 (measuring transmittance through ≈ 1 mm muscle). From 400 to around 550 nm, almost no light passed through the muscle strip, but from 550 to 700 nm, a highly variable amount of light was transmitted Figure 11. The CIE chromaticity coordinates for the spectra in Figures 8-11 are given in (Table 1).
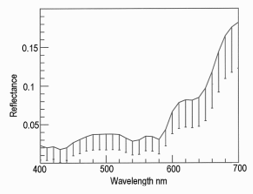
Figure 8: Reflectance spectrum of farmed venison muscle in pathway 1 (n = 20, error bars are standard deviations). Reflectance of 5 layers of white Teflon tape = 1.
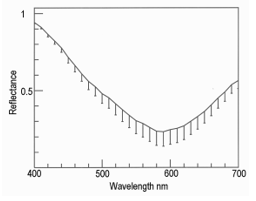
Figure 9: Reflectance with pathway 2 (n = 20, error bars are standard deviations).
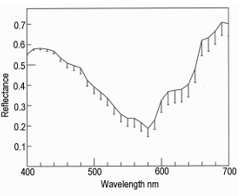
Figure 10: Reflectance with Pathway 3 (n = 20, error bars are standard deviations).
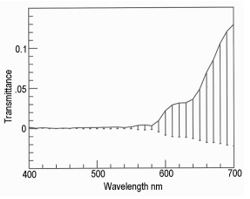
Figure 11: Transmittance with pathway 4 (n = 20, error bars are standard deviations subtracted from the mean). Transmittance = 1 was for the apparatus without a sample in place.
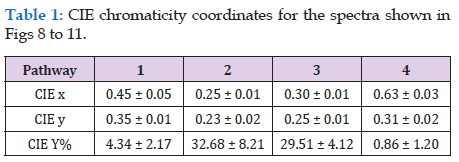
Table 1: Characterization of data on sociodemographic and demographic variables.
Changing from pathway 1 to 2 caused a reduction in CIE x (P < 0.001) which was reduced but still apparent with crossed polars (P < 0.05). With pathway 4 (transmitted light), there was an increase in CIE x (P < 0.05). The changes in CIE y from pathway 1 to 2, were also significant (P < 0.001), and with pathway 3 (crossed polars, P < 0.001), but for transmitted light in pathway 4 there was not much change (P > 0.05). The major changes for CIE Y% were from pathway 1 (P < 0.001), to blocking with crossed polars (pathway 3, P < 0.001), and to pathway 4 (transmitted light, P < 0.001). The changes in CIE Y% were most likely because of differences in path optical length, from an unknown path length of reflected light resulting from Fresnel and Lambertian scattering, to an approximate path length of 1 mm for transmitted light. These changes in chromaticity coordinates support the hypothesis that light scattering in the microstructure of muscle has a noticeable effect on colorimetry, just as it has on a wide range of samples from textiles to museum artifacts [20]. The data of Table 1 are shown graphically in Figure 12; from pathway 1, to 2, to 3, to 4. In other words, different light paths through the venison muscle caused profound changes in its colorimetry. At 1., in Figure 12, this is how a commercial colorimeter might obtain a measurement with lateral illumination and vertical photometry to measure the brown color of venison as an orange hue with low luminosity (CIE % in Table 1). At 2, there was Fresnel reflectance from the wet surface at low wavelengths to produce a blue hue. This was partly cancelled by crossed polarizers at 3. Finally, transmitted light at 4, gave a spectrum with scattering effects removed. Thus, Lambertian scattering has a noticeable effect on meat color when measured with an optical geometry similar to that of a commercial colorimeter.

Figure 12: The CIE diagram for Table 1 data showing pathways 1 to 4.
Conclusion
The main objective was to test a UV LED in both a microscope spectrofluorometer and a UV meat probe. Both tests were completed successfully. In the microscope, heat and low-pass filters were no longer needed. Johann Ploem introduced dichroic mirrors to enable epifluorescence measurements [21] and UV LEDs may enable another advance. The outlook for microscopy is very optimistic. Novel insights were gained in meat colorimetry, explaining how UV meat probes might function. The muscle between connective tissues has very low transmittance of light at low wavelengths so that when the distal window of the optical probe contacts connective tissue there is a flash of fluorescence. In other words, if UV light penetrated muscle to any extent, a UV probe might detect background levels, not peaks. A UV LED has advanced meat probe technology. Needed now are NIR diodes launching into large diameter polarization-preserving fibers to detect contracted muscle fibers [1].
References
- Swatland HJ (1985) On-line Evaluation of Meat. Technomic Publishing, Lancaster, PA.
- Swatland HJ (1989) Questions in programming a fluorescence microscope. Journal of Computer-assisted Microscopy 2: 125-132.
- Swatland HJ (1991) Analysis of signals from a UV fluorescence probe for connective tissues in beef carcasses. Computers and Electronics in Agriculture 6(3): 225-234.
- DeRose PC, Smith, MV, Mielenz KD, Blackburn DH, Kramer GW, et al. (2008) Characterization of Standard Reference Material 2941, uranyl-ion-doped glass, spectral correction standard for fluorescence. Journal of Luminescence 128(2): 257-266.
- Swatland HJ (2001) Elastic deformation in probe measurements on beef carcasses. Journal of Muscle Foods 12(2): 97-105.
- Swatland HJ (2005) A method for simultaneous fluorometry and penetrometry of connective tissues in bulk meat. Meat Science 70(4): 605-611.
- Swatland HJ (2007) Stratification of toughness in beef roasts. Meat Science 77(1): 2-6.
- Swatland H J, Warkup C, Cuthbertson A (1993) Testing a UV fluorescence probe for beef carcass connective tissues. Computers and Electronics in Agriculture 9(3): 255-267.
- Swatland HJ, Gullett E, Hore T, Buttenham S (1995) UV fiber optic probe measurements of connective tissue in beef correlated with taste panel scores for chewiness. Food Research International 28(1): 23-30.
- Swatland HJ, Nielsen, T, Andersen JR (1995) Correlations of mature beef palatability with optical probing of raw meat. Food Research International 28(4): 403-416.
- Swatland HJ, Findlay, CJ (1997) On-line prediction of beef toughness, correlating sensory evaluation with fluorescence detection of connective tissue and dynamic analysis of overall toughness. Food Quality and Preference 8(3): 233-239.
- Swatland HJ, Brooks, JC, Miller MF (1998) Possibilities for predicting taste and tenderness of broiled beef steaks using an optical-electromechanical probe. Meat Science 50(1): 1-12.
- E Wicklund, Farouk, M, Finstead G (2014) Venison: Meat from red deer (Cervus elaphus) and reindeer (Rangifer tarandus tarandus). Animal Frontiers 44 (4): 55-61.
- Elliott RJ (1967) Effect of optical systems and sample preparation on the visible reflection spectra of pork muscle. Journal of the Science of Food and Agriculture 18(8): 332-338.
- Swatland HJ (1989) Birefringence of beef and pork muscle fibers measured by scanning and ellipsometry with a computer-assisted polarizing microscope. Journal of Computer-assisted Microscopy 1: 249-262.
- Diesbourg LH, Swatland HJ, Millman BM (1988) X-ray diffraction measurements of postmortem changes in the myofilament lattice of pork. Journal of Animal Science 66(4): 1048-1054.
- Toldrá F (2017) Lawrie’s Meat Science. 8th edit. Woodhead, Cambridge.
- Williamson SJ, Cummins HZ (1983) Light and Color in Nature and Art. John Wiley, New York. Pp 488.
- Ray GB, Paff GH (1930) A spectrophotometric study of muscle hemoglobin. American Journal of Physiology 94(3): 521-528.
- Swatland HJ (2014) Reflectance versus transmittance: the effects of light scattering on red colorants (carmine, Amazonian red annatto, and Peruvian cochinilla rojo and rosado) in biological, textile and museum science. Color Research and Application 39(6): 599-606.
- Pluta M (1989) Advanced Light Microscopy. Vol 2. Elsevier, Oxford, and Polish Scientific Publishers, Warszawa pp. 494.
