 Research Article
Abstract
The use of Artificial Intelligence techniques has increasingly motivated scientists to detect and classify medical images. It is no different in the field of dermatology, with the use of machine learning to track anomalies of the skin and diagnose cancer, using data sets consisting of dermatoscopic images. The texture analysis of medical images is the result of digital image processing able to extract representative features which may have elements that are impossible to detect through human vision. This research reports on diagnostic prediction results from a set of images of human tissues with nevus and melanoma characteristics as represented by appropriate machine learning tools in order to assist physicians specialized in prognoses undetectable by the human eye.
The results were 96.67% accurate against the benchmark. The study database was classified using the Gradient Boosting classifier, a process that extracts skin images features through the red, green and blue channels.
Keywords: Artificial intelligence; Texture analysis; Melanoma; Computer vision; Machine learning
Introduction
It is known that the chances of successful treatment for most diseases are greatly increased with early diagnosis (ALBAN, 2019). Science obstinately pursues this goal. Artificial Intelligence tools and techniques can help doctors to deliver diagnosis more quickly through medical imaging. This applies also to dermatology, where a digital image processing and analysis systems can promote the early detection and diagnosis of melanoma. Moreover, all these are non-invasive methods. Studies have reported excessive exposure to ultraviolet rays and genetic traits as important factors in the development of skin cancer [1].
Detection in the early stages is vital to prevent the spreading of cancer. This enables decisions ahead of time regarding diagnosis and viable treatments. Early prognosis and detection in its initial stages, coupled with the appropriate treatment, can save lives. The texture informs some interpretation of the visual world. It provides a cue to the shape and orientation of a surface, to segment an image into meaningful regions and to classifying those regions. The surface variations that lead to tactile texture, as in a clinical examination, also tend to lead to variations in the intensity of the light that reaches our eyes, producing what is known as “visual texture” (or simply “Texture”), as shown in Figure 1, depicting an image of melanoma and an image of a benign skin growth [2].
Image quality is essential. This relies upon both the equipment and the quality of the acquired image. Parameters, such as resolution, sensitivity, and signal-to-noise, ratio may influence the quality of the medical image. Artificial intelligence assistance to oncologists and radiologists can be decisive for the early diagnosis of tissue affected by melanoma. There are skin features (e.g. color, brightness, roughness, texture etc.) that can be viewed through images, the characteristics of which can be determined using appropriate statistical tools [3]. Early diagnosis of skin lesion is the key solution to reduce skin cancer death rate. The development of an efficient system for the diagnosis of skin cancer with metrics for evaluating results is essential.
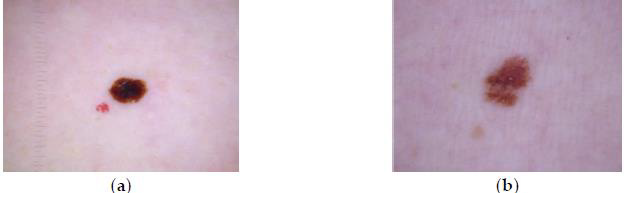
Figure 1: Image of melanoma (a) and nevus tissues (b). Source: ISIC 2019.
A graphical representation of cancer incidents is shown in Figure 2. There were 324.6 thousand cases in 2020 and melanoma was the 17th most common tumor in the world. In 2018, it figured in the 19th position. There were 55.1 thousand deaths from cancer in 2020, according to a study by the International Cancer Research Agency - IARC of the World Health Organization (WHO) Globocan [4].
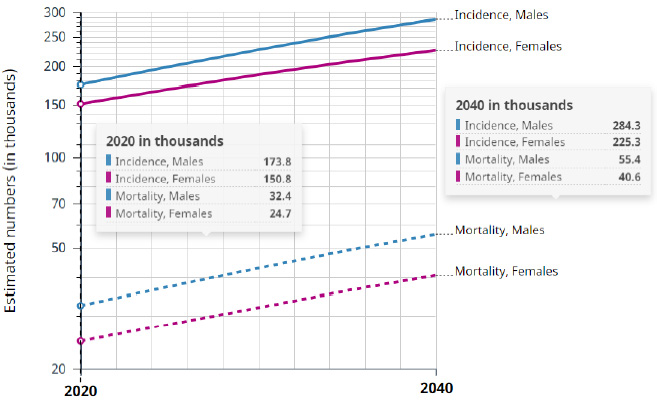
Figure 2: Image of melanoma (a) and nevus tissues (b). Source: ISIC 2019.
The projection indicates 509.6 thousand cases in 2040. The number of deaths from melanoma of skin will reach 96.0 thousand between 2020 and 2040, accounting both sexes, all ages, worldwide. Artificial intelligence can be applied after digital processing of medical images to generate a set of data. This can assist medical specialists identifying suspected regions that are not visible to the naked eye.
The paper is organized as follows:
Section 2 presents the studies related to research. Section
3 deals with the theoretical framework. Section 4 proposes
strategies and solutions using an Artificial Intelligence application
for the detection of melanoma. Section 5 shows the results of the
simulations.
Section 6 presents the conclusions of the referenced study.
Related Works
The following are references from other authors with their respective works and applications, using similar techniques for extracting features in the skin images. Skin cancer detection framework using SVM for early detection of skin cancer [5]. The GLCM system was used to select specific highlights on the image which were then used to help establish the classifier. The classification determined whether the image was of a cancerous or non-cancerous tissue. The accuracy of the proposed structure is 95.00%. Considering a subset of images consisting of dysplastic lesions and melanoma, Mojdeh et al. [6] selected the following classifiers: Support Vector Machine with radial based function kernel, Gradient Boosting and Random Forest. After the experiments, the best result obtained for global characteristics was Random Forest with 98.46% sensitivity and 70.00% specificity [6].
M Krishna et al. [7] selected parameters for texture analysis in high-resolution dermoscopic using a set of 800 images from the ISIC image database in a recent study on Skin cancer. This analysis was based on the MSVM classification and using two effective methods called ABCD and Multi-class Support Vector Machine-MSVM for resource extraction. The accuracy achieved was around 96.25% and specificity 96.32% [7]. Baiying et al. [8] proposed a new and effective model using CNN for the segmentation of skin lesions based on dermoscopic images. Extensive experimental results demonstrate that the proposed network achieves a segmentation performance superior to the latest generation methods, with a maximum precision of 93.50%. The experimental evaluation on the ISIC 2017 challenge skin lesion data sets is available to the public and demonstrates a more generalized proposed model [8].
Shunichi et al used Deep Learning with Convolutional Neural Network to classify data extracted from six classes of images, including Nevus e Melanoma. The accuracy of the classification of six classes for each candidate was graded and the ten precision tests results ranged from 82.50% to 90.00% [9]. The proposed method uses an algorithm based on meta-heuristics to optimize the convolutional neural network in training the biases and weights of the network based on reverse propagation. The proposed method is then tested on images from two well-known databases, including DermIS Digital Database and Dermquest Database, and compared with 10 popular classification methods. The final results show the importance of the accuracy of the proposed system in relation to the compared classifiers. The accuracy of the method was 91.00%, sensitivity 95.00% and specificity 92.00% [10].
Materials and Methods
Consider p (i) the normalized probability for each Region of Interest-ROI:
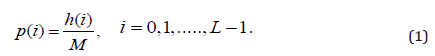
Where, the intensity-level histogram is:
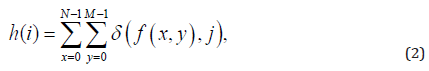
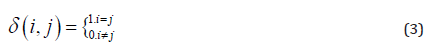
where δ(i, j) is the Kronecker delta function and f (x, y) can assume values for i = 0, 1, . . . ,L−1, and x = 0, 1, . . . ,N−1 and y = 0, 1, . . . ,M−1, where L is the number of grayscale levels. N-1 and M-1 is the number of pixels in the x and y directions, respectively.
Histograms-Based Features, are also known as First- Order Statistics
First order statistical analysis concerns the distribution of gray levels in an image, where the first order histogram is used as a basis for extracting its characteristics (Table 1).
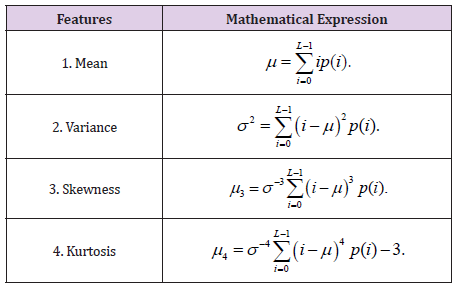
Table 1: First-order statistics- histograms-based features.
The maximum, minimum intensity values for each Red, Green and Blue channel were also added.
Gradient-Based Parameters
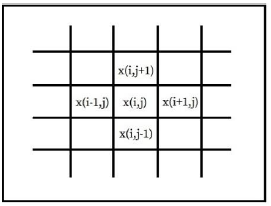
Figure 3: The pixel and its neighbor.
The gradient of an image is a measure of the spatial variations of gray levels across the image. The gradient can be negative or positive, depending on whether the gray level varies from the darkest to the lightest shade or vice versa (Figure 3).
For every pixel within the defined region of interest-ROI or within the sliding mask, as illustrated in Figure 3, an absolute value of image gradient is calculated:
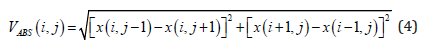
where x(i,j) is pixel luminance at (i, j) position. Assuming that M is a total number of pixels within of region of interest, five gradientbased features are calculated. The characteristics of the gradient are listed in Table 2.
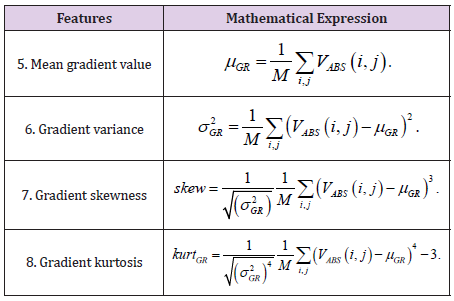
Table 2: Gradient-based parameters.
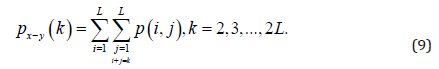
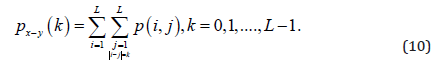
Run Length Matrix Based Parameters
Let p(i,j) be the number of times there is a run of length j having gray level i. Let L be the number of gray levels and Nr be the number of runs. There are 5 run length matrix-based features computed for 4 directions of run (θ = 0°, 45°, 90° and 135°). The Table 3 shows the mathematical expressions.
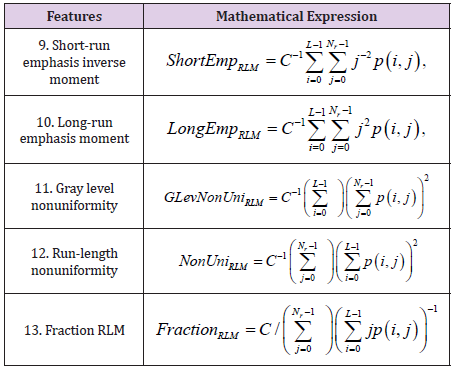
Table 3: Run Length Matrix based parameters.
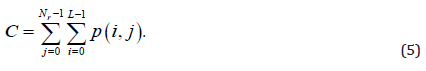
The coefficient C is defined as:
Co-occurrence Matrix Based Parameters
A set of scalar quantities to summarize the information
contained in a Gray Level Co- occurrence Matrix – GLCM was
proposed by Haralick [11], which can be defined as a second order
histogram. This is a square matrix that is formed by elements that
indicate the probability of occurrence for a pair of pixels with
intensities that depend on the distance from the angle θ. This takes
into account the frequency of a pixel with the intensity of the gray
level. The i value occurs in a specific spatial relationship with a
pixel with the j value. Each element (i, j) in the GLCM is calculated
by adding the number of times that the pixel with value i occurred
in the spatial relation specified for a pixel with value j in the input
image [11].
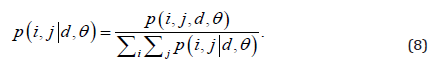
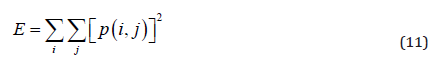
Equations 6 through 13 make up the second-order statistics set.

Where
In this study, the distances considered were d = 1, 2, .., 5, with angles θ = 0°, 45°, 90° and 135°. GLCM expresses the texture feature according to the calculation of the conditional probability of the pixel pair of the gray intensities for the different spatial positions.
GLCM-Based Features
Haralick texture features are common texture descriptors in image analysis. Table 4 shows the features.
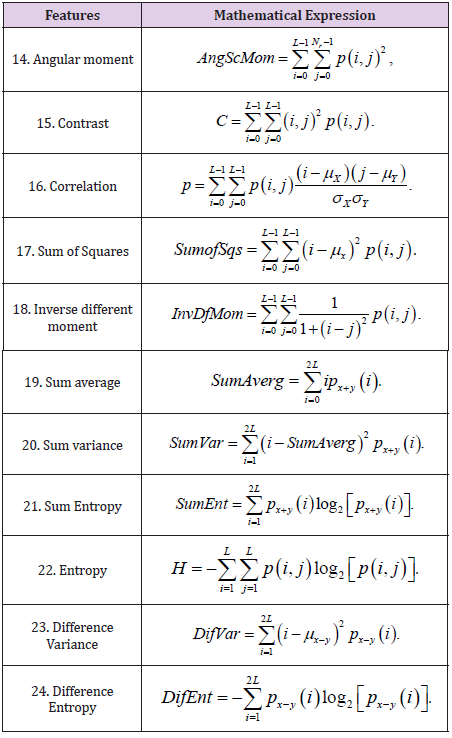
Table 4: Run Length Matrix based parameters.
Where
and
Energy derived from the second angular momentum measures the local uniformity of the shades of gray.
There are eleven features computed for the chosen parameter’s “p” and “q”.
Auto-Regressive Model Parameters
The autoregressive (AR) model infers a local interaction between image pixels so that pixel intensity is a weighted sum of neighboring pixel intensities. Assuming image f is a zero- mean random field, an AR causal model can be defined as
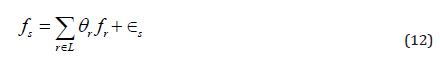
The autoregressive model assumes that pixel intensity is the weighted sum of neighboring pixel intensities. The model is given by:

where ϵ denotes an independent and identically distributed noise and μ is a mean of pixel intensities for a given ROI. Parameters θ1, θ2, θ3 and θ4 are computed within the ROI for minimal noise variance - σ.
The next step presents the solution strategy for implementing the proposed method.
Proposed Strategy
This research is an improvement of the studies initiated by the authors to diagnose the presence or absence of melanoma in human tissue through medical images [12]. The block diagram in Figure 4 shows the strategies for training the model and later the tests. The images initially reserved for training are divided into the components of the red, green and blue channels. Next, the best features of the images are extracted through the keypoints. The model is then trained and uses the python TPOT function. Several classifiers are tested on the models until the best classifier is selected for that training magnet set.
All data sets used are available in the Skin Lesion Analysis Towards Melanoma - International Skin Imaging Collaboration- ISIC 2019 [13]. The database was formed by 800 jpeg skin images, selected at random. The learning process was performed on 70% of the database. As in this research, 10 samples were used per image. The learning process analyzed a total of 5,600 samples. The remaining 30% of the images in the database were used in the testing process, making a total of 2,400 samples in the testing phase. Each sample had a dimension of 6 pixels x 6 pixels.
The proposed system of classification makes use of the Python language and XGBoost [14] and sckit-learn libraries [15]. The python The Tree-Based Pipeline Optimization Tool-TPOT function was configured to take into account the main classifiers used in the academic literature. TPOT was one of the very first AutoML methods and open-source software packages developed for the data science community [16]. To increase the efficiency in the extraction of resources for tissue differentiation, it was necessary to work with all the features described in Tables 1 to 4, which represent the calculated features of the texture of medical images.
After extracting the features of the images, modeling was performed by training the database, using the best-known classifiers and their variations, as found in the academic literature:
a. Linear model Stochastic Gradient.
b. Naive Bayes Gaussian.
c. Naïve Bayes Bernoulli.
d. Naïve Bayes Multinomial.
e. Tree Decision.
f. Ensemble Extra Trees.
g. Ensemble Random Forest.
h. Ensemble Gradient Boosting.
i. Neighbors K Neighbors.
j. Support Vector Machine Linear.
k. Support Vector Machine.
l. Linear model Logistic Regression.
m. Extreme Gradient Boosting.
The best classifier was selected from the thirteen candidates after computational processing, based on the area under the Receiver Operating Characteristics: Gradient Boosting (Stochastic Gradient Boosting).
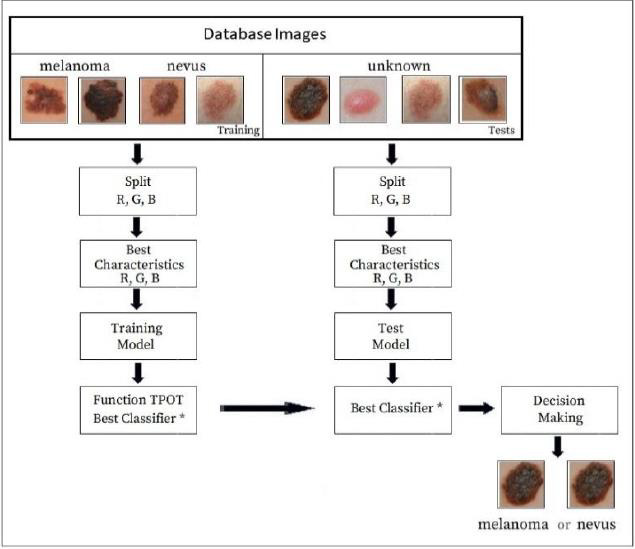
Figure 4: Block Diagram of process.
This study demonstrated that the Gradient Boosting algorithm was the most effective in predicting malignancy.
Based on the algorithm used in this study, the validation of the model was performed on 800 images with a test base of unidentified samples from the training set. The best classifier was used, which was trained in approximately 560 images from the ISIC2019 database. The model used in this research achieved an overall accuracy of 96.67% for the set of test images. This methodology can assist specialists in dermatology to make decisions at the early stages of the disease. The results obtained took into account the ten most relevant texture features of the red, green and blue channels, which best contribute to represent the model, as shown in Figures 5-7.
The intensity of the red color (feature 2) is an important feature for the red channel model. Table 5 shows the description of the term for each feature of the image texture of channel red. Figure 6 shows the ten texture features of the green channel, in order of importance. For the green channel, the intensity of the green color (feature 2) is also an important feature for the model. Figure 7 shows, in decreasing order, the ten-characteristic data of the blue channel texture. For the blue channel, the intensity of the blue color (feature 2) is also an important feature for the model (Table 7).
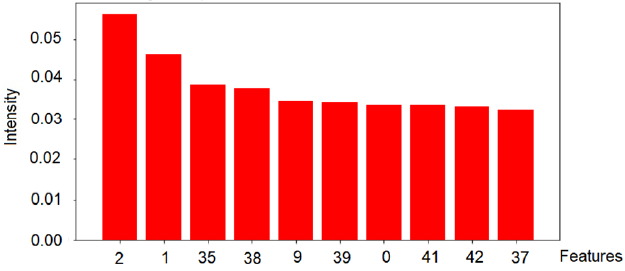
Figure 5: Degree of importance of the characteristics of the Red channel.
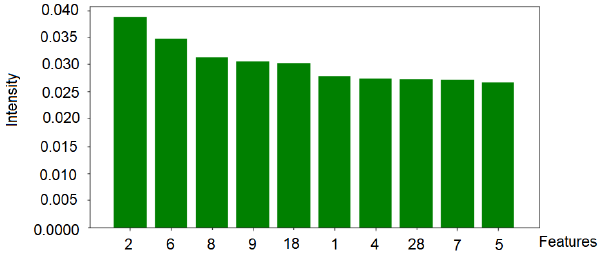
Figure 6: Degree of importance of the characteristics of the Green channel.
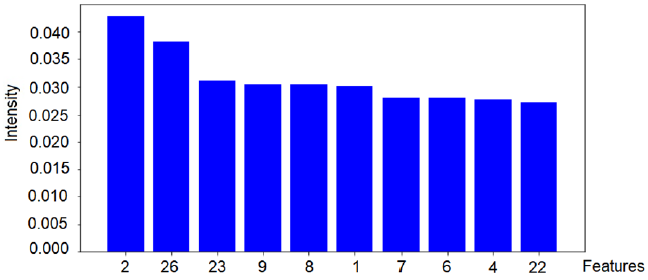
Figure 7: Degree of importance of the characteristics of the Blue channel.
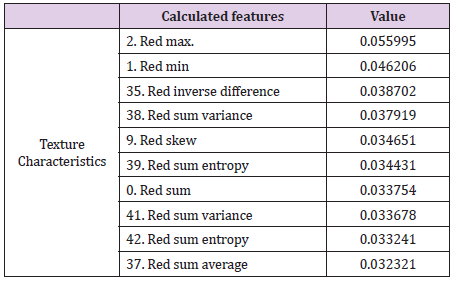
Table 5: Red channel characteristics: Feature ranking.
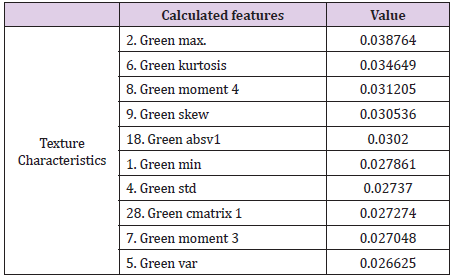
Table 6: Green channel characteristics: Feature ranking.
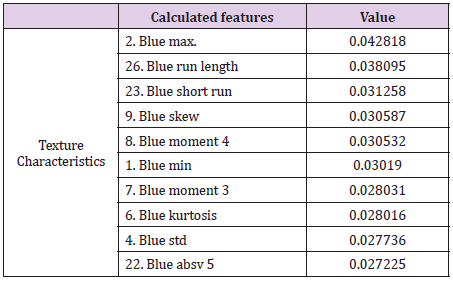
Table 7: Blue channel characteristics: Feature ranking.
Performance Metrics for Classifiers
In academic medical literature, instances are designated as
positive, indicating the existence of the disease, and negative,
indicating the absence of the disease; thus, four possibilities arise
when medical images are submitted to the classifiers:
The metrics that were considered to evaluate the classifiers for
these were (Table 8):
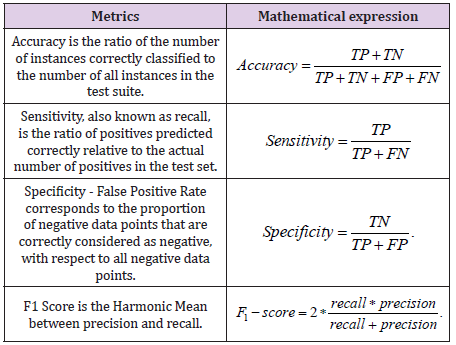
Table 8: Performance Metrics for Classifiers.
The ideal limit for all metrics is to reach the unit value [17]. The metrics taken into account for the best classifiers are shown in Table 9. Figure 8 shows the receiver operating curve – ROC, used to understand the performance of a classification model. A suitable overall measure for the curve is the area under the curve -AUC. A good classifier is one whose AUC is close to 1 [18]. The confusion matrix with normalization and without normalization is shown in Figure 9.
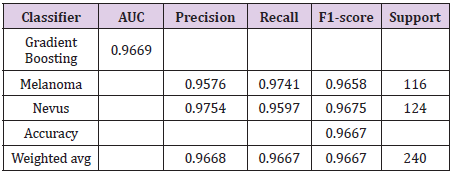
Table 9: Best classifier data.
The False Positive Rate can be calculated: False Positive Rate= FP/(TN+FP) =1- Specificity=4.03%. Specificity is 95.97%. The number of positive and negative outcomes changes as the threshold of the probability values changes to classify a probability value as a positive or negative result. Thus, Sensitivity and Specificity will also change. Another parameter that can evaluate the classifier is the kappa parameter. Cohen’s kappa measures the agreement between two raters who each classify N items into C mutually exclusive categories. For the boosting classifier, the calculated kappa coefficient is κ = 95.82%, this function computes Cohen’s kappa, a score that expresses the level of agreement between two classes on a classification problem.
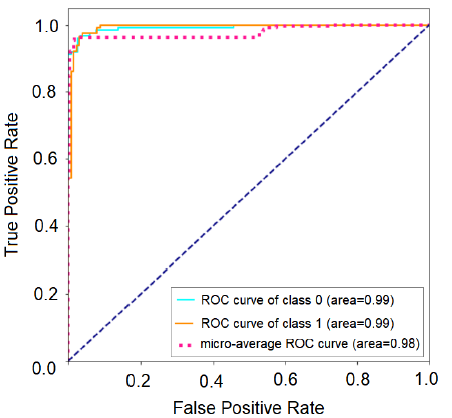
Figure 8: Gradient Boosting Classifier – Receiver operating characteristic.
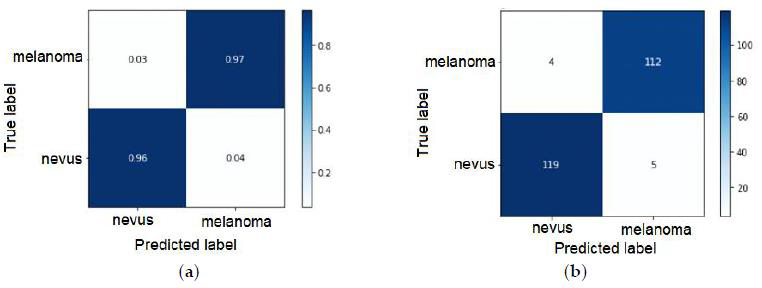
Figure 9: Gradient Boosting Classifier – (a) Normalized confusion matrix and (b) Confusion matrix, without normalization.
Conclusions
The results show that the logistic regression model was the best one for detecting melanoma in human tissues with an accuracy rate of 96.67% and precision against the benchmark dataset, as well as a sensitivity and specificity of 95.97%. It was observed that there are three common texture features in the red, green and blue channels. These contribute to the classifier model, which are: features 2, 9, and 1 - Maximum color intensity, Color skewness and Minimum color intensity, respectively. In addition, the most prominent features are concentrated in the red channel. The study shows that the strategy used for the classification of color medical images presented satisfactory results. Obtaining the texture features of the image by the red, green and blue channels, followed by the selection of the best parameters to train the classifier, resulted in a 96.67% accuracy rate.
Acknowledgment
We would like to thank the International Skin Imaging Collaboration (ISIC), sponsored by the International Society for Digital Skin Imaging (ISDIS) for making publicly available databases on the ISIC Archive containing the largest publicly available collection of quality controlled dermoscopic images of skin lesions.
References
- Esra Karabulut, Turgay Ibrikci (2016) Texture Analysis of Melanoma Images for Computer-aided Diagnosis. Annual Int‘l Conference on Intelligent Computing, Computer Science and Information Systems (ICCSIS-16) 1(1): 26-29.
- Ruth Rosenholtz (2014) Texture perception. The Oxford Handbook of Perceptual Organization.
- Marcos De Almeida, M A Adv, Marcos A Martins de Almeida (2018) Use of Statistical Techniques to Analyze Textures in Medical Images for Tumor Detection and Evaluation. Advanced Molecular Imaging and Interventional Radiology 1(1): 1-6.
- (2021) World Cancer Research Fund – American Institute for Cancer Research.
- Uzma B Ansari, Tanuja Sarode (2017) Skin Cancer Detection Using Image Processing. International Research Journal of Engineering and Technology 4(04): 2875-2881.
- Mojdeh Rastoo, Rafael Garcia, Olivier Morel, Franck Marzani (2015) Automatic differentiation of melanoma from dysplastic nevi. Optical Image Classification. IEEE Computerized Medical Imaging and Graphics 43: 44-52.
- M Krishna Monika, N Arun Vignesh, Ch Usha Kumari, MNVSS Kumar, E Laxmi Lydia (2020) Skin cancer detection and classification using machine learning. ScienceDirect 33: 4266-4270.
- Baiying Lei, Zaimin Xia, Feng Jiang, Xudong Jiang, Zongyuan Ge, et al. (2020) Skin lesion segmentation via generative adversarial networks with dual discriminators. Medical Image Analysis 64: 01-12.
- Shunichi Jinnai, Naoya Yamazaki, Yuichiro Hirano, Yohei Sugawara, Yuichiro Ohe (2020) The Development of Skin Cancer Classification System for Pigmented Skin Lesion Using Deep Learning. Biomolecules 10(8): 1123.
- Long Zhang, Hong Jie Gao, Jianhua Zhang, Benjamin Badami (2020) Optimization of the Convolutional Neural Networks for Automatic Detection of Skin Cancer. Open Medicine 15(13): 27-37.
- Haralick RM (1979) Statistical and structural approaches to texture. Proceedings of the IEEE 67(5): 786-804.
- Marcos AM Almeida, Iury AX Santos (2020) Classification Models for Skin Tumor Detection Using Texture Analysis in Medical Images. Journal of Imaging 6(6): 51.
- (2019) International Skin Imaging Collaboration – ISIC.
- Tianqi Chen, Carlos Guestrin (2016) XGBoost: A Scalable Tree Boosting System. ACM, pp. 785- 794.
- Ravi T Yarlagadda (2018) Python Engineering Automation to Advance Artificial Intelligence and Machine Leaning Systems. SSRN Electronic Journal 5(6): 87-97.
- Trang T Le, Weixuan Fu, Jason H Moore (2021) Scaling tree-based automated machinelearning to biomedical big data with a feature set selector. Bioinformatics 36(1): 250-256.
- Marina Sokolova, Guy Lapalme (2018) A Systematic Analysis of Performance Measures for Classification Task. Information Processing and Management 45(4): 427-437.
- Jinnai S, Yamazaki N, Hirano Y, Sugawara Y, Ohe Y, et al. (2020) The Development of a Skin Cancer Classification System for Pigmented Skin Lesions Using Deep Learning. Biomolecules 10(8): 1123.
