 Research Article
Abstract
This study was objectively conducted to assess trends of forest fire occurrence, burnt area and its causes and management measures in Province-2, Nepal. Altogether 48 Questionnaire Survey and 32 Key Informant Interviews were organized to collect primary data while secondary data were collected from Fire Information for Resource Management System from year, 2002 to 2019. Total 36 maps were produced showing fire occurrences (18) and burnt area pattern (18) of targeted area. Result showed that total 5289 forest fire incidents and total 499,538.9 ha were burnt from 2002 to 2019. The highest number of forest fire incidents was observed in March with 2975 incidents covering 56.24%. The highest incidence was recorded in Lower Tropical Sal and Mixed Broadleaf Forest with 3237 observations. One-Way ANOVA showed that fire occurrence and burnt area among Lower Tropical Sal and Mixed Broadleaf Forest (LTSMF), Hill Sal Forest (HSF) and Outside Forest Region (OFR) were significantly different at 95% confidence level. Mann-Kendal correlation showed that there was positive correlation (R=0.393) between year and forest fire occurrence in LTSMF as well as between year and burnt area of HSF (R=0.09). Principal Component Analysis in Parsa district showed, unextinguished cigarette butts and litter fall was positively correlated.
Keywords: MODIS; Fire Incidence; Burnt Area; People Perceptions; Fire Management
Abbreviations: IAT: Increasing Temperature; DR: Delay Rainfall; LDP: Long Dry Period; ML: More Litter fall; NF: Natural Fire; CS: Cigarette Smoke; PCA: Principal Component Analysis; RUWL: Removing Unnecessary Weeds and Litter; PWP: Public Awareness Programs; RFP: Regular forest Fire Patrolling; SRAF: Strict Rules and Fine Against Forest fire Occurred by Carelessness; CPMFF: Community Involvement in Management of Forest Fire.
Introduction
Forest resources are the vital requirement of every living being to survive on the earth as without this life cannot be imagined. Globally, there are many types of limiting factors which affect the growth of the forest [1]. Some of the important limiting factors are forest fire, extreme rainfall, erosion, illegal logging, invasive species etc., and these limiting factors are normally categorized into two groups known as: natural factors and anthropogenic factors. Among these two groups, the anthropogenic factors have been seriously counted as challenging problem in different sectors and importantly in the forestry sector. A small flame of fire can create huge damage. The recent bush fire in Australia is one of the example of how immense damage a small flame of fire can create, which not only damaged the forest but also caused the extinction of huge number of living being residing in the forest and nearby.3 In fact, the Australian bushfire killed at least 29 people and destroyed about 2,500 homes [2,3]. The destruction to the Australian country’s land and biodiversity is harder to fathom as scientists believed that around 1.25 billion animals have lost their life in the bush fire and the consequences of the fire will not be easy to recover.
It may take thousands of year to restore the forest and restock the wildlives in the forest. The Australian bushfire is itself a fearful example to long-term damage of many sensitive ecosystems that forest fire can bring upon [4]. Another example of the forest fire that has left behind huge consequences in the history was the forest fire in the rainforest that occurred in August 2019. The records showed that on August 20, there was a detection of 39,194 fires in the Amazon rainforest since January. This represented a 77 percent increase in the number of fires from the same time period in 2018 in Amazon [5]. A number of incidents of forest fire were recorded and over 1.2 million trees were lost in Pakistan’s northwest Khyber Pakhtunkhwa province during the time period of July 2018 to June 2019.6 In Sri Lanka massive forest fire was recorded which was found to broke out in the Maragala Mountain area in Moneragala, in the Uva Province and it was found with extreme temperature nearby over 400oC and damaged about 2.023 square km forest area [6]. Over 2,318.88 hectares of forest was lost in July 2019 in Thailand. The MODIS data showed over 30,000 forest fires took place in India in 2019. And it was also found that around 95 percent of the forest fires in India were on account of human activity [7].
Forest fire occurs every year in Nepal too losing large junk of forest. We have no database of how much damage is caused and we have no record of number of lives is lost every year due to forest fire. Thus, such researches are important particular in Province 2, Nepal which is the most vulnerable and prone area to forest fire [8,9]. Of the total forest fire incidences it was found that about 58% forest fire are caused by deliberate burning by grazers, [10] poachers and non-timber forest product collectors, 22% are caused by negligence and 20% occur by accident [11-13]. Along with GIS, the MODIS data is very useful to analyze the forest fire and damage caused [8,14,15]. Nepal lacks proper institutional as well as financial and technological capability to combat forest fires and also the country doesn‘t have the full record of forest fire occurrence and its impacts [8,16]. So, to bridge this gap in the assessment of trend and dynamics of forest fire, this study is an attempt to map the forest fire dynamics and to assess the trend of forest fire occurrence and burnt area pattern in Province number-2 of Nepal using Geographic Information System (GIS) and explore causes of forest fire and its management options in the targeted area.
Research Methodology
Study Area
The study area is located in Province-2 of Nepal. Province-2, lies in the southeastern region of Nepal that was formed after the adoption of the Constitution of Nepal. It is Nepal’s second most populous province and smallest province by area. It borders Province-1 to the east, Bagmati Province to the north, and India to the south. It has an area of 9,661 km2 (3,730 sq. mi) with a population of 5,404,145 as per the 2011 Census of Nepal, making it most densely populated province of Nepal. The total forest area covered by Province-2 is about 263,640 ha. The province includes eight districts from Saptari District in the east to Parsa District in the west. The forest area cover of each district is Parsa district covers forest area of about 76,230 ha, Bara district covers about 46,630 ha, Rautahat district covers about 26,290 ha, Sarlahi district covers about 25,770 ha, Mahottari district covers about 22,240 ha, Dhanusha district covers about 27,150 ha, Siraha district covers about 18,190 ha and Saptari district covers about 21,140 ha forest area respectively (Source: Ministry of Forest and Soil Conservation) (Figure 1).
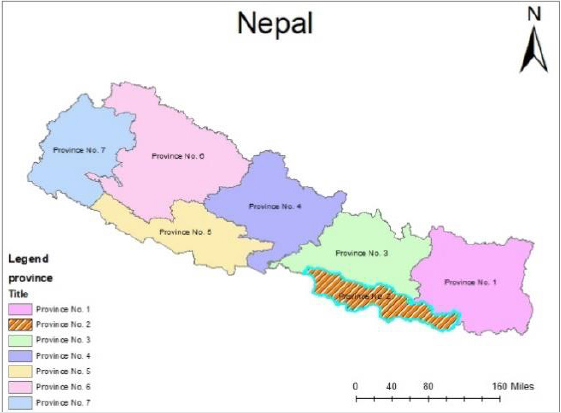
Figure 1: Study area map (Province-2)
Primary Data Collection
The primary data and information was collected using PRA tools like Questionnaire survey and Key Informant Interview. Questionnaire survey was conducted among 48 respondents (6 from each 8 districts) and total 32 Key Informant Interview was organized (4 from each 8 districts). Respondents were from Parsa (10), Bara (10), Rautahat (10), Sarlahi (10), Mahottari (10), Dhanusha (10), Siraha (10) and Saptari (10). For the Key Informant Interview, key informants having deeper understanding about the subject matter were selected. 32 key informants selected were forest officials, local users and CFUG members from each 8 districts. Perception level on damage, causes, consequences and different adaptation measures required for control of forest fire was gathered using the applied PRA tools. Close-ended questions were prepared about the fire, its causes, preventive methods, and management strategies. The email communication, telephone communication and field visits were applied to collect the required data. The closed ended questions were ranked with series of statements using Likert scale and the respondents were to rate their views in the scale ranging from 5 “Highest score” to 1 “Lowest score”. These scores were then analyzed using Principal Component Analysis (PCA) method.
MODIS Data
This study analyzed the trend of occurrence of forest fire and mapped the forest fire incidence and burnt area dynamics of the forest of Province-2 of Nepal using active fire records from multitemporal data of Moderate Resolution Imaging Spectroradiometer (MODIS) on board Terra and Aqua satellites from 2002 to 2019. Fire Information for Resource Management System (FIRMS) provided information on active fires using the Moderate Resolution Imaging Spectroradiometer (MODIS) instrument on board NASA‘s Aqua (evening) and Terra (morning) Satellite [17]. MODIS data from NASA‘s Terra (Afternoon) and Aqua (Morning) earth monitoring satellites, provides the processed data to universities and research institutes as part of the academic frontier project. The MODIS active fire product detects fires in 1x1km pixels that are burning at the time of overpass under relatively cloud-free conditions [18,19]. In concern to Nepal, it does not have own reliable information, tools and technology for the detection and monitoring due to which MODIS vector data were downloaded from NASA‘s official website. The forest fire point and burnt area related shape file was archived from the MODIS data as data sources for this study. The MODIS burned area product (MCD-64) was extracted from NASA’s official website (FIRMS) which gives whole burned area of South Asia (Table 1).
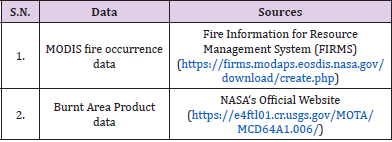
Table 1: List of data for the study.
Ground Verification
Data given by NASA (MODIS fire occurrence and burnt area data) was verified by the information and data provided by the Department of Forest and Soil Conservation and forest officials of each district of Province-2. The record of GPS coordinates of fire occurrence are available in Department of Forest and Soil Conservation which were provided by officials and were used to validate the fire occurrence. The location of the burnt area was verified with the Key Informant Interview during data collection. Field visit was also done to collect the location of frequently fire occurring areas.
Spatial Analysis
MODIS fire data was used to analyze patterns and trend of forest fire incidence and burnt area by forest fire in Province-2 from 2002 to 2019. Software, Arc GIS 10.5 was used for analyzing and interpreting the satellite images, GIS layers data, burnt area pattern and forest fire trend analysis based on density of fire accumulation. Statistical data was entered and analyzed using SPSS. Charts, bar line and graphs was prepared using Microsoft Excel 2010 and Microsoft Word 2010 (Table 2).
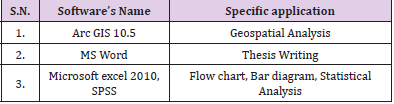
Table 2: Software and tools used in the study.
Statistical Analysis
The collected data particularly, number of fire occurrence and burnt area data in Province-2 from 2002 to 2019 was analyzed using statistical tool. Descriptive analysis like center of tendency (mean) and dispersion (standard error, standard deviation, minimum, maximum, coefficient of variance) was calculated. Normal distribution of the data set was examined using Kolmogorov Smirnov and Shapiro Wilk test, the box plot was prepared and outlier was removed. The data was normally distributed thus, the parametric test was be applied to compare the year wise forest fire frequency and damaged area (One-Way ANOVA and Tukey’s b test). Trend analysis was done using time series analysis. Principle component analysis method was used to assess the causes and management system.
Results
Spatio-Temporal Distribution of Forest Fire Occurrence
The Spatio-temporal distribution patterns of forest fire since 2002 to 2019, in Province-2 of Nepal was analyzed. The result showed that total 5289 forest fire events were recorded by MODIS satellite from 2002 to 2019. Among this, 2498 forest fire incidents were recorded in Parsa district and followed by 757 forest fire incidents in Bara district, 509 forest fire incidents in Rautahat district, 451 forest fire incidents in Sarlahi district, 339 forest fire incidents in Mahottari district, 257 forest fire incidence incidents in Dhanusha district, 90 forest fire incidence incidents in Siraha district and 388 forest fire incidence incidents in Saptari district. Out of total detection, about 4991 fires were detected with greater than 50% confidence. Forest fire distribution pattern in Province-2 in last 18 years are presented in (Figure 2).
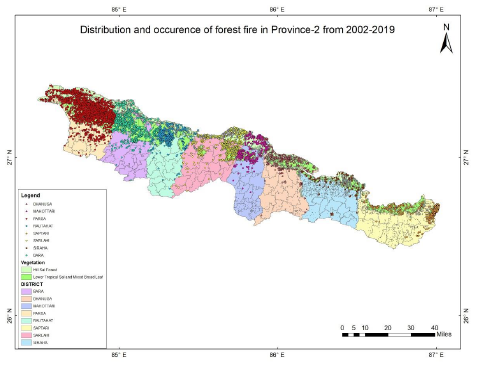
Figure 2: Fire incidence in Province-2 from 2002 to 2019.
Year Wise Spatio-Temporal Distribution of Forest Fire Occurrence
Temporal changes of frequency of occurrence of forest fire in province-2 were analyzed on a monthly and yearly basis from 2002 to 2019. The result showed that the highest fire incidents was recorded in year 2016 with 449 events and followed by 2013, 2018, 2004 and 2014 with fire incidents 447, 432, 390 and 359, respectively. On the other hand, the lowest number of forest fire incidence was recorded in 2002 with 74 events.
Month Wise Spatio-Temporal Distribution of Forest Fire Occurrence
Forest fire occurrence on a monthly basis was studied for each year. The result showed that the highest fire incidents occurred in March with 2975 events followed by April, December and November with incidence numbers 1681, 189 and 98 respectively which is about 93% of total fire incidence from 2002 to 2019 whereas the lowest fire incidents occurred in the month of July with incidence number 2 from 2002 to 2019 (Figure 3).
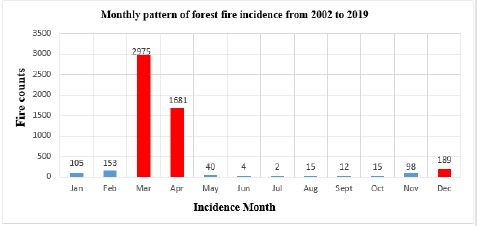
Figure 3: Month wise fire incidence in Province-2
Spatio-Temporal Distribution of Fire Occurrence Based on Forest Types
Forest fire incidents was differed according to the forest types. The result showed that, the highest incidence was seen in Lower Tropical Sal and Mixed Broadleaf Forest (LTSMF) with 3237 incidences and followed by Hill Sal Forest (HSF) with incidence number 1110 but only 942 forest fire incidence was recorded in Outside Forest Region (OFR). (Figures 4 & 5). Statistically, the Kolmogorov-Smirnov and Shapiro-Wilk tests showed that the record of forest fire incidence in 3 different forest types of namely Lower Tropical Sal and Mixed Broadleaf forest (LTSMF), Hill Sal Forest (HSF) and Outside Forest Region (OFR) were normally distributed at 95% confidence level. Since the data sets were normally distributed the parametric test particularly One-Way ANOVA and post-hoc Tukey’s b test were applied to compare the fire occurrences among Hill Sal Forest, Lower Tropical Sal and Mixed Broadleaf Forest and Outside Forest Region. One-Way ANOVA showed that there was a significant difference among fire occurrences in Lower Tropical Sal and Mixed Broadleaf Forest (LTSMF), Hill Sal Forest (HSF) and Outside Forest Region (OFR) at 95% confidence level, as P-value was less than 0.05. The post-hoc Tukey’s b test showed that that there was significant difference between the forest fire occurrence in LTSMF with fire occurrence in HSF and OFR, since the mean value of fire occurrence of HSF and OFR falls in the same subset but mean value of fire occurrence of LTSMF falls under different subset.
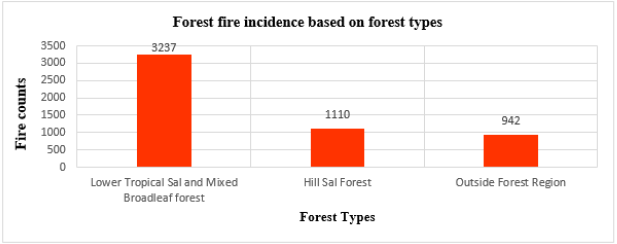
Figure 4: Distribution forest fire incidence in different forest types.
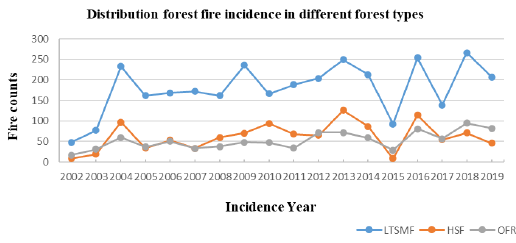
Figure 5: Year wise distribution forest fire incidence in different forest types.
Spatio-Temporal Distribution of Fire Occurrence in Lower Tropical Sal and Mixed Broadleaf Forest
Forest fire occurrence and its distribution were varying in Lower Tropical Sal and Mixed Broadleaf Forest (LTSMF) from 2002 to 2019. The highest incidence was recorded in 2018 with 266 observations and followed by 2016, 2013 and 2009 with incidence number 254, 249 and 236, respectively. However, the least fire occurrence was observed in 2002 with 48 observations (Figure 6). The Mann-Kendal correlation showed that there was a positive correlation R (0.393) between the year and the occurrence of forest fire in LTSMF and it was significant at 5% level of significance since P-value was 0.023. The trend-line showed that there was increasing trend of fire incidence by 5.4706 in LTMSF from 2002 to 2019 (Figure 6).
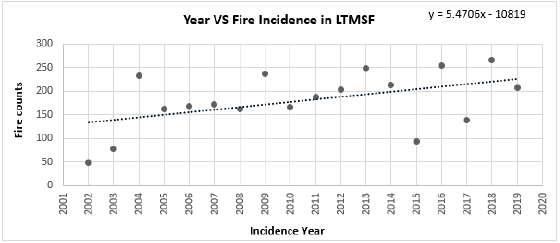
Figure 6: Year wise distribution of fire incidence in LTMSF.
Spatio-Temporal Distribution of Fire Occurrence in Hill Sal Forest
Forest fire occurrence and its distribution were varying in Hill Sal Forest (HSF) from 2002 to 2019. The highest incidence was recorded in the year 2013 with 126 events and followed by year 2016, 2004 and 2010 with incidence number 114, 97 and 94 respectively (Figure 7). The Mann-Kendal correlation showed that there was a positive correlation R (0.249) between the year and the occurrence of forest fire in HSF and it was insignificant at 5% level of significance since P-value was 0.150. The trend-line showed that there was increasing trend of fire incidence by 2.0784 in HSF from 2002 to 2019.
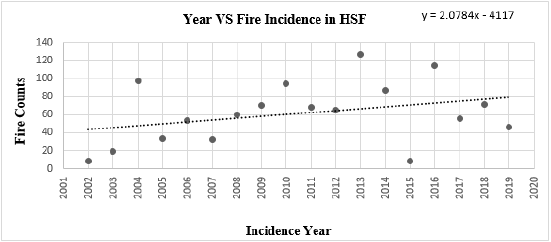
Figure 7: Year wise distribution of fire incidence in HSF.
Spatio-Temporal Distribution of Fire Occurrence in Outside Forest Region
Forest fire occurrence and its distribution were varying in Outside Forest Region (OFR) from 2002 to 2019. The highest incidence was recorded in the year 2018 with 95 incidences and was followed by 82 and 81 incidence number in 2019 and 2016, respectively. The least fire occurrence was recorded in the year 2002 with 17 incidences (Figure 8). The Mann-Kendal correlation showed that there was a positive correlation R (0.485) between the year and the occurrence of forest fire in OFR and it was significant at 1% level of significance since P-value was 0.005. The trend-line showed that there was increasing trend of fire incidence by 2.8194 in OFR from 2002 to 2019.
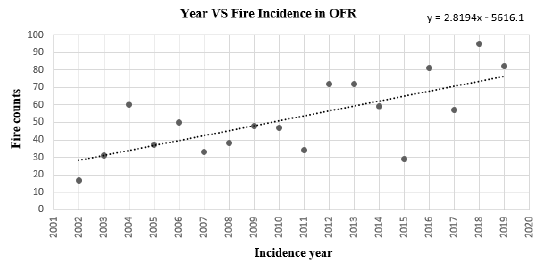
Figure 8: Year wise distribution of fire incidence in OFR.
Year wise Spatio-Temporal Distribution of Burnt Area Caused by Forest Fire
Temporal changes of total area burnt by forest fire in Province-2 were analyzed on a yearly basis from 2002 to 2019. The result showed that total 499,538.9 hectares (ha) were burnt throughout the study period. The highest burnt area was recorded in 2004 covering 61277.018 ha and followed by 2013 and 2014 with 58126.448 ha and 46476.808 ha, respectively. The lowest burnt area was recorded to be 4575.391 ha in 2017 (Figure 9).
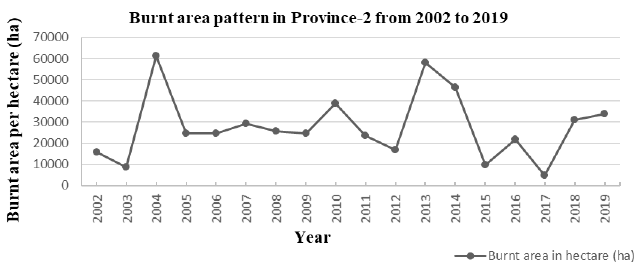
Figure 9: Burnt area pattern in Province-2 from 2002 to 2019.
Spatio-Temporal Distribution of Burnt Area based on Forest Types
The burnt area pattern was differed according to the forest types. The result showed that, the highest burnt area was recorded in Lower Tropical Sal and Mixed Broadleaf Forest (LTSMF) with area of 351875.1 ha and was followed by Hill Sal Forest (HSF) with area of 107207.951 ha and Outside Forest Region (OFR) with area of 40455.72 ha (Figures 10 & 11). Statistically, the Kolmogorov- Smirnov and Shapiro-Wilk tests showed that the record of burnt area by forest fire in 3 different forest types of namely Lower Tropical Sal and Mixed Broadleaf forest (LTSMF), Hill Sal Forest (HSF) and Outside Forest Region (OFR) were normally distributed at 95% confidence level. Since the data sets were normally distributed the parametric test particularly One-Way ANOVA and post-hoc Tukey’s b test were applied to compare the burnt area among Hill Sal Forest, Lower Tropical Sal and Mixed Broadleaf Forest and Outside Forest Region. One-Way ANOVA showed that there was a significant difference among burnt areas of Lower Tropical Sal and Mixed Broadleaf Forest (LTSMF), Hill Sal Forest (HSF) and Outside Forest Region (OFR) at 95% confidence level, as P-value was less than 0.05. The post-hoc Tukey’s b test showed that that there was significant difference between the burnt area at LTSMF with burnt area at HSF and OFR, since the average burnt area value of LTSMF falls under different subset but mean value of HSF and OFR falls under same subset.

Figure 10: Burnt area pattern based on different forest types from 2002 to 2019.
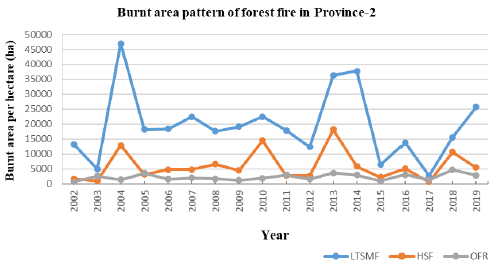
Figure 11: Year wise burnt area pattern based on different forest types from 2002 to 2019.
Spatio-Temporal Distribution of Burnt Area in Lower Tropical Sal and Mixed Broadleaf Forest
Burnt area pattern by forest fire was varying in Lower Tropical Sal and Mixed Broadleaf Forest (LTSMF) from 2002 to 2019. Among the total 351875.1 ha burnt area (2002 to 2019), the highest burnt area was recorded in 2004 with 47008.32 ha and was followed by 2014 and 2013 with 37712.94 ha and 36355.46 ha, respectively. The lowest burnt area coverage was observed in the year 2017 with 2628.38 ha (Figure 12). The Mann-Kendal correlation showed that there was a negative and weak correlation R (-0.020) between the year and the burnt area in LTSMF and it was not significant at 95% confidence level since P value was 0.910. The trend-line showed that there was decreasing trend by 193.7 ha in LTMSF from 2002 to 2019.
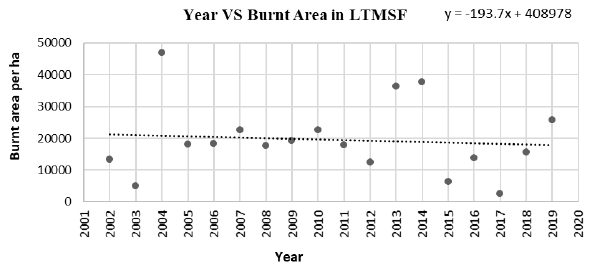
Figure 12: Year wise distribution of burnt area in LTMSF.
Spatio-Temporal Distribution of burnt area in Hill Sal Forest
Burnt area pattern by forest fire was varying in Hill Sal Forest (HSF) from 2002 to 2019. Among the total 107207.951 ha burnt area (2002 to 2019), the highest burnt area was recorded in the year 2013 with area of 18129.15 ha and was followed by 2010 and 2004 with area of 14526.72 ha and 12850.5 ha, respectively. The lowest burnt area coverage was observed in the year 2017 with area coverage of 627.95 ha (Figure 13). The Mann-Kendal correlation showed that there was a positive correlation R (0.098) between the year and the burnt area in HSF and it was not significant since the P value was 0.570. The trend-line showed that there was increasing trend by 97.281 ha in HSF from 2002 to 2019.
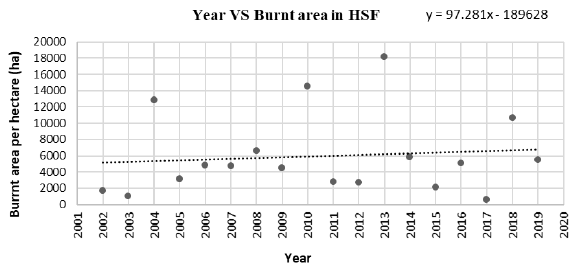
Figure 13: Year wise distribution of burnt area pattern in HSF.
Correlation between Forest fire Incidence and Burnt Area Pattern from 2002 to 2019
Correlation between fire incidence and burnt area in Lower Tropical Sal and Mixed Broadleaf forest: The curve estimation showed that there was a positive correlation (R= 0.547) between the burnt area and forest fire incidences in the LTSMF from the year 2002 to 2019. The equation showed that, y = 102.114*x + 1185.172, where y was the burnt area coverage and x was the fire incidences. The equation depicts that the burnt area coverage in Lower Tropical Sal and Mixed Broadleaf Forest was increased by 102.114 ha every year (Figure 15). ANOVA and t-test were applied to evaluate the equation between the burnt area and forest fire incidences in Lower Tropical Sal and Mixed Broadleaf Forest (LTSMF). The ANOVA showed that there was significant correlation between the burnt area and the fire incidences in LTSMF at 95% confidence level as P-value was 0.019 (i.e. P<0.05). The variables were also examined using the t-test, which showed significant relation between the two variables viz. burnt area and forest fire incidences, as the P-value was 0.019.
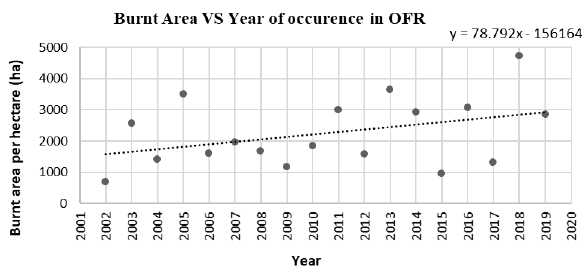
Figure 14: Year wise distribution of burnt area pattern in OFR.
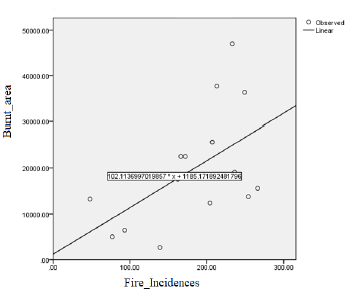
Figure 15: Correlation between fire incidence and burnt area at LTSMF
Correlation between Fire Incidence and Burnt Area in Hill Sal Forest
The Curve estimation showed that there was positive correlation (R= 0.728) between the burnt area and forest fire incidences in the Hill Sal Forest from 2002 to 2019. The equation showed that, y = 106.203*x + -593.183, where y is the burnt area coverage and x is fire incidences. The equation depicts that the burnt area coverage in Hill Sal Forest was increased by of 106.203 ha every year (Figure 16). ANOVA and t-test were applied to test the correlation between the burnt area and forest fire incidences in the Hill Sal Forest (HSF). ANOVA showed that there was a significant correlation between the burnt area and the fire incidences in HSF at 95% confidence level as P-value was 0.001 (i.e. P<0.05). The variables were also examined using the t-test, which showed significant relation between the two variables viz. burnt area and forest fire incidences, as the P-value was 0.001.
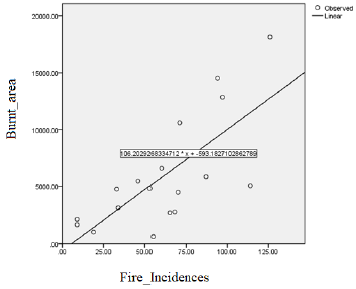
Figure 16: Correlation between fire incidence and burnt area at HSF.
Correlation between Fire Incidence and Burnt Area in Outside Forest Region
The Curve estimation showed that there was positive correlation (R=0.562) between the burnt area and forest fire incidences in the OFR. The equation showed that, y = 28.340*x + 764.408, where y is the burnt area coverage and x is fire incidences. The equation depicts that the burnt area coverage in Outside Forest Region was increased by of 28.340 ha every year (Figure 17). ANOVA and t-test were applied to test the correlation between the burnt area and forest fire incidences in Outside Forest Region (OFR). ANOVA showed that there was a significant correlation between the burnt area and the fire incidences in OFR at 95% confidence level as P-value was 0.015 (i.e. P<0.05). The variables were also examined using the t-test, which showed significant relation between the two variables i.e. burnt area and forest fire incidences, as the P-value was 0.015.
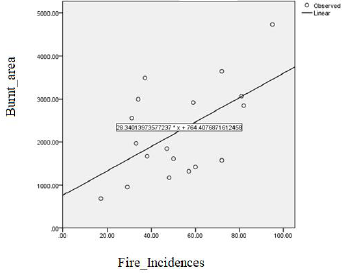
Figure 17: Correlation between fire incidence and burnt area at OFR.
Projection of Burnt Area in Different Forest Types of Province-2: The linear equations were applied to project burnt area in the forest assuming different scenarios. The projection showed that the expected burnt area was likely to be increased in year 2050, 2080 and 2100 assuming three scenarios particularly: business as usual, risk of doubling and risk of tripling. Based on these scenarios the projection on burnt area was assumed on different forest types. Assuming the scenario of business as usual, the burnt area is likely to be 3165.534 ha, 6228.954 ha and 8271.234 ha in next 2050, 2080 and 2100 respectively in Lower Tropical Sal and Mixed Broadleaf Forest. The burnt area is likely to be 3292.293 ha, 6478.383 ha and 8602.443 ha in next 2050, 2080 and 2100 respectively assuming business as usual scenario in Hill Sal Forest. The burnt area is likely to be 878.54 ha, 1728.74 ha and 2295.54 ha in next 2050, 2080 and 2100 respectively assuming business as usual scenario in Outside Forest Region.
Assuming the scenario of risk of doubling, the burnt area is likely to be 6331.068 ha, 12457.91 ha and 16542.47 ha in next 2050, 2080 and 2100 respectively in Lower Tropical Sal and Mixed Broadleaf Forest. The burnt area is likely to be 6584.586 ha, 12956.77 ha and 17204.89 ha in next 2050, 2080 and 2100 respectively assuming risk of doubling scenario in Hill Sal Forest. The burnt area is likely to be 1757.08 ha, 3457.48 ha and 4591.08 ha in next 2050, 2080 and 2100 respectively assuming risk of doubling scenario in Outside Forest Region. Assuming the scenario of risk of tripling, the burnt area is likely to be 9496.602 ha, 18686.86 ha and 24813.7 ha in next 2050, 2080 and 2100 respectively in Lower Tropical Sal and Mixed Broadleaf Forest. The burnt area is likely to be 9876.879 ha, 19435.15 ha and 25807.33 ha in next 2050, 2080 and 2100 respectively assuming risk of tripling scenario in Hill Sal Forest. The burnt area is likely to be 2635.62 ha, 5186.22 ha and 6886.62 ha in next 2050, 2080 and 2100 respectively assuming risk of tripling scenario in Outside Forest Region (Table 3).
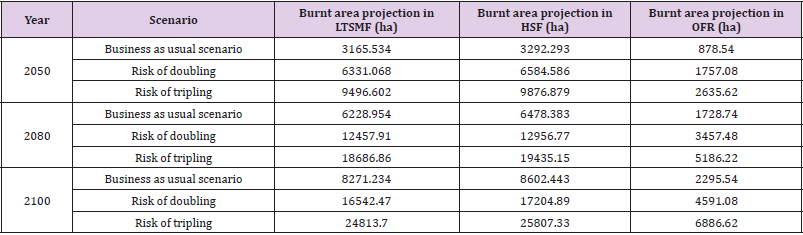
Table 3: Projection of burnt area of different forest types.
Causes and Management Practices of Forest Fire: The result showed that there were 6 major causes of forest fire which were varied according to the districts. These causes were Increasing Temperature (IAT), Delay Rainfall (DR), Long Dry Period (LDP), More Litter fall (ML), Natural Fire (NF) and Cigarette Smoke (CS) i.e. throwing burning cigarettes. Principal Component Analysis (PCA) of the causes of forest fire in Parsa district showed that, the Cigarette Smoke (CS) and More Litter fall (ML) were positively correlated with each other as they fell in the same quadrant. Whereas Delay rainfall (DR) and Long Dry Period (LDP) were also positively correlated with each other as they fell in the same quadrant too (Figure 18). Principal Component Analysis of the causes of forest fire in Bara district showed that the Cigarette Smoke (CS), More Litter fall (ML) and Long Dry Period (LDP) were positively correlated with each other as they fell in the same quadrant. Moreover, Delay rainfall (DR) and Natural fire (NF) were also positively correlated with each other as they fell in the same quadrant too (Figure 19).
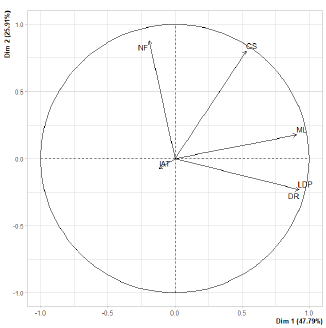
Figure 18: PCA showing causes of forest fire in Parsa district.
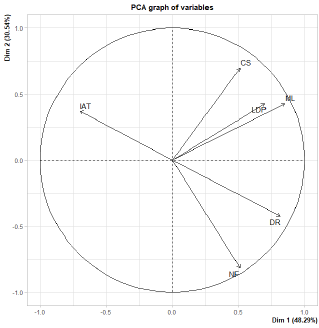
Figure 19: PCA showing causes of forest fire in Bara district
Principal Component Analysis of the causes in Rautahat district showed that the Cigarette Smoke (CS) and Long Dry Period (LDP) were positively correlated with each other as they lied in the same quadrant. Whereas Increasing Temperature (IAT) and More Litter fall (ML) were also positively correlated with each other as they also fell in the same quadrant (Figure 20). PCA of the causes of forest fire in Sarlahi district showed that the Cigarette Smoke (CS), Delay Rainfall (DR) and Long Dry Period (LDP) were positively correlated with each other. Also, More Litter fall (ML) and Increasing Temperature (IAT) were also positively correlated with each other as they fell in the same quadrant too (Figure 21). PCA of causes of forest fire in Mahottari district showed that the Cigarette Smoke (CS), Natural Fire were positively correlated with each other. In addition, More Litter fall (ML) Delay Rainfall (DR) and Long Dry Period (LDP) were also positively correlated with each other as they fell in the same quadrant too (Figure 22).
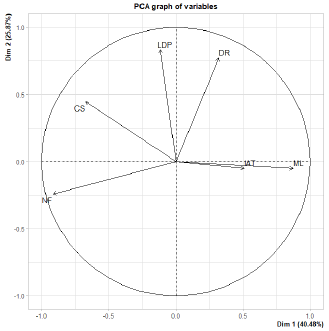
Figure 20: PCA showing causes of forest fire in Rautahat district
PCA of the causes of forest fire in Dhanusha district showed that the Natural Fire (NF), Increasing Temperature (IAT) and Long Dry Period (LDP) were positively correlated with each other as they fell in the same quadrant (Figure 23). The results from the PCA in Siraha district showed that the Natural Fire (NF), More Litter fall (MF) and Cigarette smoke (CS) were positively correlated with each other. Whereas, Increasing Temperature (IAT), Delay Rainfall (DR) and Long Dry Period (LDP) were also positively correlated with each other as they fell in the same quadrant too (Figure 24). The results from the PCA of causes of forest fire in Saptari district showed that the Natural Fire (NF) and Delay Rainfall (DR) were positively correlated with each other. Whereas, Increasing Temperature (IAT), More Litter fall (ML) and Long Dry Period (LDP) were also positively correlated with each other as they fell in the same quadrant too (Figure 25). The result showed that there were 6 major management practices applied in 8 districts of Province-2. These management practices were Use of Fire breakers or fire lines (FR), Removing Unnecessary Weeds and Litter (RUWL), Public Awareness Programs (PWP), Regular forest Fire Patrolling (RFP), Strict Rules and fine Against Forest fire occurred by carelessness (SRAF) and Community Involvement in Management of Forest Fire (CPMFF).
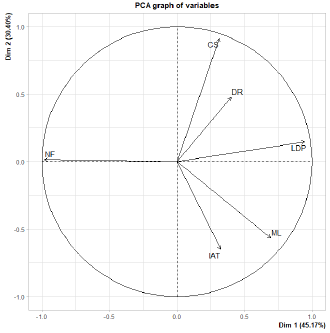
Figure 21: PCA showing causes of forest fire in Sarlahi district
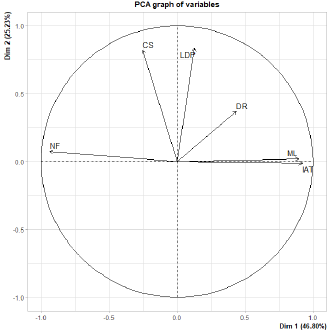
Figure 22: PCA showing causes of forest fire in Mahottari district.
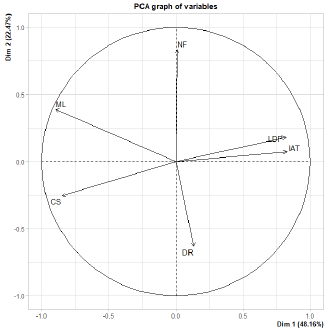
Figure 23: PCA showing causes of forest fire in Dhanusha district.
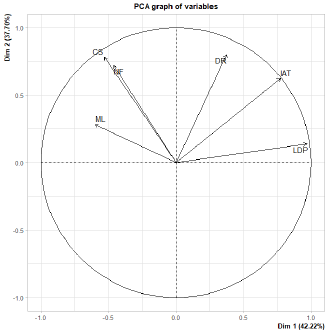
Figure 24: PCA showing causes of forest fire in Siraha district.
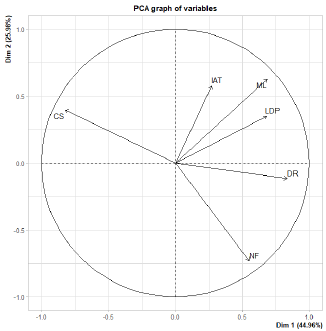
Figure 25: PCA showing causes of forest fire in Saptari district.
The Principal Component Analysis (PCA) of the forest fire management practices applied in Parsa district showed that the Community Involvement in Management of Forest Fire, Use of Fire breakers or fire lines and Removing Unnecessary Weeds and Litter were positively correlated with each other and Public Awareness Programs and Strict Rules and fine Against Forest fire were also positively correlated with each other as they fell in the same quadrant too (Figure 26). The results from the PCA of the ranks provided by the respondents of Bara district showed that the Community Involvement in Management of Forest Fire and Public Awareness Programs were positively correlated with each other as they fell in the same quadrant. Whereas Regular forest Fire Patrolling and Removing Unnecessary Weeds and Litter were also positively correlated with each other as they fell in the same quadrant too (Figure 27). The results from the PCA of the ranks provided by the respondents of Rautahat district showed that the Community Involvement in Management of Forest Fire and Public Awareness Programs were positively correlated with each other as they fell in the same quadrant. Whereas Regular forest Fire Patrolling, Removing Unnecessary Weeds and Litter, Use of Fire breakers or fire lines and Strict Rules and fine Against Forest fire were also positively correlated with each other as they fell in the same quadrant too (Figure 28).
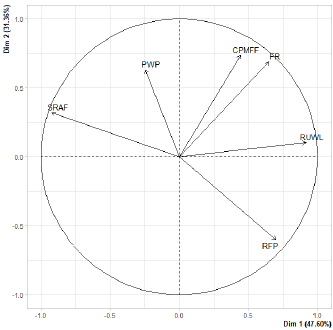
Figure 26: PCA of forest fire management practices in Parsa district.
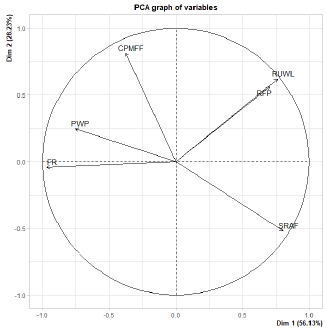
Figure 27: PCA of forest fire management practices in Bara district.
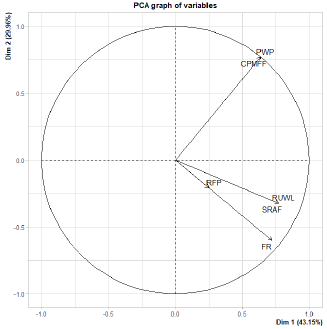
Figure 28: PCA of forest fire management practices in Rautahat district.
The results from the PCA of the ranks provided by the respondents of Sarlahi district showed that the Community Involvement in Management of Forest Fire, Regular Fire Patrolling, Use of Fire breaks and Removing Unnecessary Weeds and Litter were positively correlated with each other as they fell in the same quadrant (Figure 29). The results from the PCA of the ranks provided by the respondents of Mahottari district showed that the Community Involvement in Management of Forest Fire and Use of Fire-breaks and Fire-lines were positively correlated with each other. Also, Regular Fire Patrolling and Removing Unnecessary Weeds and Litter were also positively correlated with each other as they fell in the same quadrant too (Figure 30). The results from the PCA of the ranks provided by the respondents of Dhanusha district showed that the Regular Fire Patrolling and Use of Fire-line and Fire-breaks were positively correlated. Whereas Strict Rules and fine Against Forest fire and Removing Unnecessary Weeds and Litter were also positively correlated with each other as they fell in the same quadrant too (Figure 31). The results from the PCA of the ranks provided by the respondents of Siraha district showed that the Regular Fire Patrolling, Public Awareness Programs and Removing Unnecessary Weeds and Litter were positively correlated.
Also, Strict Rules and fine Against Forest fire and Use of Fireline and Fire-breakers were also positively correlated with each other as they fell in the same quadrant too (Figure 32). The results from the PCA of the ranks provided by the respondents of Saptari district showed that the Regular Fire Patrolling, Strict Rules and fine Against Forest fire due to carelessness and Removing Unnecessary Weeds and Litter were positively correlated. Also, Public Awareness Programs and Use of Fire-line and Fire-breakers were also positively correlated with each other as they fell in the same quadrant too (Figure 33). Key Informant Interviews was carried out via email, phone calls and field visits with the officials from forest departments and local forest users of Parsa, Bara and Rautahat to understand their perception on Prominent, Incidence rate, and Difficulties in fire control and management. When key informants were asked about the prominent month of forest fire then, out of 32 key informants’ majority of them claimed in Chaitra– Baisakhi (March - April), very few responded in Jestha (May). The occurrence rate of forest fire had decreased in past two years according to the informants. The forest officials also mentioned that Parsa district has highest rate of forest fire incidence than any other district in Province-2.
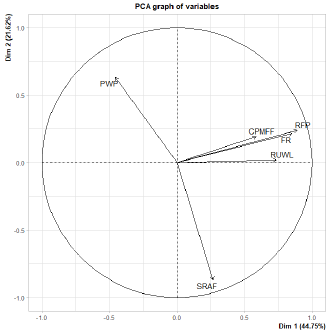
Figure 29: PCA of forest fire management practices in Sarlahi district.
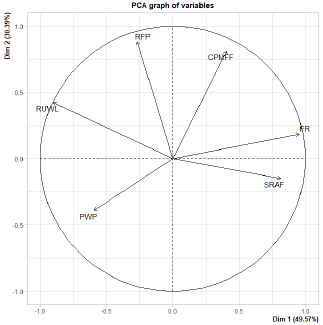
Figure 30: PCA of forest fire management practices in Mahottari district.
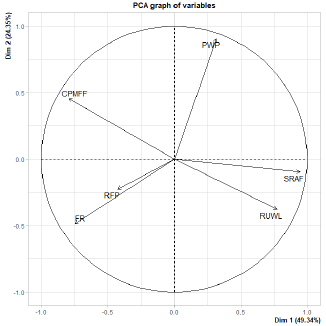
Figure 31: PCA of forest fire management practices in Dhanusha district.
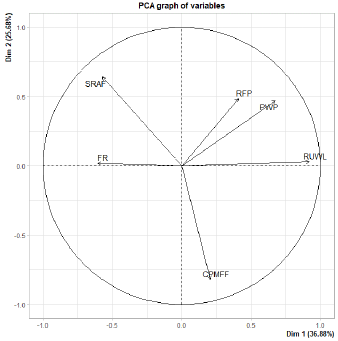
Figure 32: PCA of forest fire management practices.
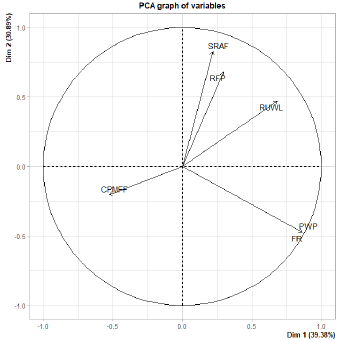
Figure 33: PCA of forest fire management practices.
The key informants also provided information on causes of forest fire. About 75% of them responded that most of the forest fire is caused mainly due to human carelessness like unextinguished cigarettes, debris burning, and carelessness while handling fire etc. and remaining 25% responded that causes as delay in rainfall, accumulation of litter (fuel) etc. are causes of forest fire. When asked about difficulties in fire control and management, 65% informants said that the community participation in control of forest fire has improved in recent years as awareness programs have been facilitated by the Division Forest Office. But the local viewpoint was found to be quite different than the forest officials, who mentioned that the forest fire rate increases due to lack of forest control tools, training and patrolling provided by the responsible departments under Division Forest Office.
Discussion
Spatial and Temporal Trend of Forest Fire
The spatial and temporal distribution patterns of forest fire since 2002 to 2019 were analyzed. The result showed that total 5289 forest fire occurrence were recorded by MODIS satellite from 2002 to 2019 in Province-2. Total of 499,538.9 hectares (ha) was burnt throughout the study period i.e. from 2002 to 2019. Among the total forest fire event, 2498 forest fire incidence was observed in Parsa district, 757 forest fire incidence was observed in Bara district, 509 forest fire incidence was observed in Rautahat district, 451 forest fire incidence was observed in Sarlahi district, 339 forest fire incidence was observed in Mahottari district, 257 forest fire incidence was observed in Dhanusha district, 90 forest fire incidence was observed in Siraha district and 388 forest fire incidence was observed in Saptari district. Out of total detection, about 4991 fires were detected with greater than 30% confidence.
Research shows that highest forest fire incidence in Province-2 was occurred in 2016 and least was occurred in 2002. The research study by Matin et al., (2017)12 shows that the frequency of fires in Nepal was higher during recent years, that is, after 2009 which is similar to the findings of our study where highest fire incidence was seen in 2013, 2016, 2018 and in increasing trend. Research also showed that highest forest area in Province-2 was burnt in the year 2004 and lowest burnt area occurrence was observed in the year 2017. Also, among the total burnt area, highest burnt area by forest fire was observed at Parsa district and lowest was observed in Siraha district. Parsa district was found to be the most vulnerable district to forest fire and Siraha district was found to be the least vulnerable district to forest fire. One of the major reason behind this might be the forest cover area of the districts i.e. Parsa having the largest forest area of about 76,230 ha and Siraha having the least forest area of about 18,190 ha.
The study also showed that the most of fire incidents occurred during the month March followed by April which is consistent with the study conducted by Matin et al., (2017)12 which states that March is the peak fire month in the eastern Terai region of Nepal followed by the month April. The reason for the increasing fire events in the month of March and April may be because of the heavy accumulation of fuel loads due to leaves shed by trees, litter, weeds, and undergrowth having low moisture content only because of high temperature, low relative humidity and precipitation and high wind velocity in this season [20]. This research study shows that the lowest fire incidence was observed from the month of June to October which is supported by the study by Khanal (2015) [21] which states that low fire activity was observed in the period between July to October in Nepal. Comparing this study with the study of forest fire in other countries in South Asia it was found that the fire occurrence month in other South-Asian countries were almost similar to Nepal. The study by Tian (2013) [22] shows that among the forest fires in China, March was the month with the most fires (60.0%), followed by April (13.1%), February (10.9%), December (7.3%), and other months (0.2–3.8%) which aligns with the forest fire occurrence in Nepal which is highest from March- May based on this research study. Lying on the same continent and being neighboring country with almost similar climatic conditions might be one of the major region for the similarity in the forest fire occurrence month.
This study shows that 61.20% forest fire occurrence and 70.43% burnt area coverage is found in Lower Tropical Sal and Mixed Broadleaf Forest, 20.98% forest fire occurrence and 21.46% burnt area coverage is found in Hill Sal Forest and 17.8% forest fire occurrence and 8.09% burnt area coverage is found Outside Forest Region of Province-2. This suggests that highest fire incidence and burnt area occurrence by forest fire was found in Lower Tropical Sal and Mixed Broadleaf Forest which is also supported by the study by Matin et al., 12 which says that about 80% of forest fires occur in the broadleaved forest because the tropical broadleaved forest experiences heavy leaf fall during summer (i.e. March–June) which results in the accumulation of a large amount of leaf litter, fuelling frequent and prolonged occurrences of fire during summer. The study by on Fires in the South Asian Region, 2008 states that the moist deciduous forest with species as Shorea robusta, are frequently disturbed by fires and even 60% are occasionally affected by it [23-28].
It also depicts that these moist deciduous forest is the most vulnerable forest ecosystem to fire in India which also aligns with our study which shows that species as Shorea robusta and other deciduous and lower broadleaf forest species as the most vulnerable species to forest fire in Terai region of Nepal. The study by Matin (2017)12 shows that the broadleaf forest has the highest risk to forest fire in Nepal mainly in Terai region which aligns to the outcome of our study which shows that the highest fire incidence was observed in the Lower Tropical Sal and Mixed Broadleaf forest making it most vulnerable to forest fire. It is known that majority of the forest fires occurred in the low-altitude areas mainly in broadleaf deciduous forest in China [22] and majority of deciduous forest in Thailand and India are lost due to forest fire [23] which is similar in the case of Nepal as our study shows that high incidence of forest fire was seen in Lower Tropical Sal and Mixed Broadleaf followed by Hill Sal Forest in Province-2.
The equation obtained from the curve estimation method depicted that the brunt area coverage of Lower Tropical Sal and Mixed Broadleaf Forest (LTSMF), Hill Sal Forest (HSF) and Outside Forest Region (OFR) was increasing by 102.114 ha, 106.203 ha and 28.340 ha respectively every year. This shows that the efficiency of forest fire management practices have not been applied adequately in LTSMF and HSF as compared to OFR. The increasing trend of burnt area coverage also shows that there is higher need of application of appropriate management practices mainly in Hill Sal Forest followed by Lower Tropical Sal and Mixed Broadleaf Forest. The projection of burnt area coverage in LTSMF, HSF and OFR for the year 2050, 2080 and 2100 showed the increasing pattern of burnt area which illustrates that if effective management practices are not applied mainly in the fire risk season (March-May), the coverage of burnt area is likely to increase in massive rate by the year of 2100.
Major Causes of Forest fire and its Management Practices
According to the study conducted it was analyzed that most of the fires are caused due to human carelessness such as throwing butts of unextinguished cigarettes, unplanned grazing, carelessness while handling fire, campfires which is also supported by the study; NBS (2002) [24] and Sharma (2006) [25]. The results from Principal Component Analysis of causes and management practices in each district was obtained and the major 6 causes which were taken forward for ranking and analysis were, increasing temperature, delay rainfall, long dry period, more litter fall, natural fire and cigarette smoke. The positive correlation between any two of the cause’s variable showed that when the extent of occurrence of one variable increases, the extent of another variable also increases contributing towards forest fire events. For example: In Parsa district, the correlation between delay in rainfall and long dry period shows that long dry period and delay in rainfall can together aid to forest fire.
Also, the correlation between more litter fall and cigarette smoke shows that unextinguished cigarette and accumulated litter can also cause forest fire. Similarly, in Bara district it was found that there was a positive correlation between cigarette smoke, more litter fall and long dry period which suggests that long dry period leads to accumulation of more litter in the forest floor and human carelessness such as throwing cigarette butts in such litter accumulated area can induce forest fire and lead towards damage of forest area. This finding of causes of forest fire in Bara district was also justified by the study done by Gentle (1996) [26]. Another study done by Padillah (2006) [27] showed that human induced fire caused due to discarded cigarette butts, uncontrolled litter/ weeds burning, shifting cultivation are the major causes of forest fire in Terai region of Nepal which is consistent to our study which also showed that discarded cigarettes, long dry period leading to accumulation of litter (fuel) are the major causes of forest in Province-2 which lies in Terai region. The study done by Benndorf (2008) [28] depicts the major region of forest fire in South Asian countries as Bhutan, India, Nepal etc. are for over 90% related to human interactions i.e. fires are provoked because of people carelessness, by throwing cigarette butts away and by workers burning debris which supports the finding of our study too.
In the paper Report on Fires in South Asian Region it has been mentioned that Bhutan’s climate conditions during winter (lack of rainfall, and high wind velocities) very much favor ignition of fires. Also, the end of the dry winter season is used to prepare the fields with burnings and it is very common that these fires escape and cause damage. Based on this research it has been found that long dry period, delay in rainfall and uncontrolled burning of accumulated litter were major causes of forest fire in Province-2 which shows similarity in research by Benndorf (2008) [28]. This shows that South-Asian countries as Bhutan, Nepal, India, China shares almost similar causes of forest fire. Similarly 6 major management practices which were taken forward for ranking and analysis were use of fire breakers or fire lines, removing unnecessary weeds and litter, public awareness programs, regular forest fire patrolling, strict rules and fine against forest fire occurred by carelessness and community involvement in management of forest fire. The positive correlation between any two of the management practices variable showed that two or more of these variable when used together can contribute towards effective management of forest fire. For example: In Parsa district, the correlation between community involvement in management of forest fire, use of fire breakers or fire lines and removing unnecessary weeds and litter together can contribute towards effective management of forest fire. Also, the correlation between public awareness programs and strict rules and fine against forest fire occurred by carelessness when practiced together can also help in effective management of forest fire in Parsa district. This study shows that community involvement in management of forest fire is one of the most important management strategies to control forest fire in Province-2 which is supported by the study done by Padillah (2006) [27].
Community involvement in monitoring and management of forest fire must be considered effective as they possess valuable knowledge of place, fire history, traditional management practices, fuel loading etc. and having ownership makes these communities feel more inclined and responsible for the management practices. Our study also depicts the increasing need of public awareness programs as a management strategy which is also supported different studies in Gambia, Honduras and India [29]. Public awareness can be used as an effective tool for fire management as increase in public awareness program can lead towards increase in active participation of forest users in forest fire management and forest biodiversity enhancement activities. Our study clarifies that the creation of fire lines and fire breakers can be used as an efficient tool for forest fire management which is consistent to the study by Padillah (2006) [27]. Fire-lines are effective management approach as construction of fire lines around and inside the forest helps to align the fuels which ultimately helps to segregate, stop and control forest fire.
Similarly regular forest fire patrolling, removing unwanted weeds and litter and strict laws and fine against carelessness to forest fire are other important practices as shown by this research study that must be taken in consideration for management of forest fire in Province-2, which is also supported by the study done by Benndorf (2008) [28]. The study by Benndorf [30-32] states that practices as provision of a legal and financial basis of fine, strict law enforcement, provision of basic tools and materials for fire patrolling and launching of forest fire management programs must be reinforced for management of forest fire which utterly supports the findings of this research study for management of forest fire in Province-2.Conclusion
The fire incidence was found varying in different year in different districts of Province- 2. The highest forest fire occurrence was recorded in the year 2016 and the lowest in year 2002. The highest burnt area coverage was recorded in the year 2004 which was followed by year 2013. It also showed that fire occurrence and burnt area were found to be increasing every year. The highest forest fire was recorded in the month of March followed by April. The highest risk of forest fire incidence and vulnerability to forest fire was observed in the month of March, April and May. So, highest attention to forest fire management and intensive forest fire management strategies should be adopted in the forest area of Province-2 especially from March-May. The forest management activities should be started from February but it should intensify by the month of March since the highest fire occurrence in Province-2 was seen in this month.
The highest fire incidence and burnt area coverage was observed in the Lower Tropical Sal and Mixed Broadleaf Forest but it was found to be lowest in Outside Forest Region. This shows that Lower Tropical Sal and Mixed Broadleaf Forest is highly prone to forest fire among all forest types. The research also found that the forest fire incidence may be increase in 2100 if proper management practices are not applied. The Principal Component Analysis showed that causes as long dry period, more litter fall, delay in rainfall and unextinguished cigarette butts are the most influential factors of causes of forest fire. And it also showed that management practices as construction and use of fire-line, fire-breakers, public awareness programs and regular forest fire patrolling are the most influential factors for management of forest fire. Construction of fire-lines, fuel management, forest fire education, support and coordination from Division Forest Office, and infrastructures for fire management are other important measures for the control and management of forest fire in Province-2. More research and study needs to be carried out regarding forest fires in continuation or independently. A study should be extended on Spatio-seasonal pattern of fire incidents and covering risk zone mapping and study based on prediction of forest fire in Province-2 and other Provinces of Nepal is highly required.
References
- C Nellemann, E Corcoran (2010) Dead planet, living planet: Biodiversity and ecosystem restoration for sustainable development: a rapid response assessment. UNEP/Earthprint.
- PR Butler (2015) Central Appalachians forest ecosystem vulnerability assessment and synthesis: a report from the Central Appalachians Climate Change Response Framework project. Gen Tech Rep NRS-146. Newtown Square, PA: US Department of Agriculture, Forest Service, Northern Research Station 310(146): 1-310.
- Y Xin, RA Williams (2019) Effects of burn season on large seedlings of oak and other hardwood regeneration three years after shelterwood harvest. Forestry Studies 71(1): 1-16.
- SS Hasan (2019) The role of big data in China’s sustainable forest management. Forestry Economics Review 1(1).
- R Radu (2020) Understanding Climate Change in Nursing Practice: An Educational Tool for Nurses. (Doctoral dissertation, University of British Columbia).
- MI Cruz López (2019) Spatial Distribution of Forest Fire Emissions: A Case Study in Three Mexican Ecoregions. Remote Sensing 11(10): 1185.
- G Xanthopoulos, N Nikolov (2019) Wildfires and fire management in the eastern mediterranean, southeastern Europe, and middle-east regions. Fire Management 77(1).
- B Ghimire, K Bhujel, K Rijal (2014) Fire hazard zonation of Bardia National Park, Nepal: A disaster preparedness approach. Nepal Journal of Environmental Science 2: 27-33.
- A Parajuli (2015) Spatial and temporal distribution of forest fires in Nepal. International Union for Conservation of Nature, Kathmandu, Nepal.
- AC Teodoro, L Duarte (2013) Forest fire risk maps: A GIS open source application - a case study in Norwest of Portugal. International Journal of Geographical Information Science 27(4): 699-720.
- RM Kunwar, S Khaling (2006) Forest fire in Terai, Nepal - causes and community management interventions. International Forest Fire News 34: 46-54.
- MA Matin (2017) Understanding forest fire patterns and risk in Nepal using remote sensing, geographic information system and historical fire data. International Journal of Wildland Fire 26(4): 276-286.
- SNBM Said (2017) Forest Fire Risk Assessment Using Hotspot Analysis in GIS. The Open Civil Engineering Journal 11(1): 786-801.
- K Gharehbaghi, K Mc Manus, K Robson (2019) Minimizing the environmental impacts of mega infrastructure projects. Journal of Engineering, Design and Technology 17(4).
- A Bonk (2019) Fire occurrence and the current state of palaeo fire reconstructions based on sedimentary charcoal from natural archives in Poland. Bulletin of Geography. Physical Geography Series 17(1): 49-60.
- (2014) GON Nepal national biodiversity strategy and action plan 2014-2020. Nepal Ministry of Forest and Soil Conservation.
- (2002) NASA/University of Maryland. MODIS Hotspot / Active Fire Detections. Data set. MODIS Rapid Response Project, NASA/GSFIC.
- L Giglio (2003) An enhanced contextual fire detection algorithm for MODIS. Remote Sensing of Environment 87(2-3): 273-282.
- L Giglio (2008) Active fire detection and characterization with the advanced space borne thermal emission and reflection radiometer (ASTER). Remote Sensing of Environment 112(6): 3055-3063.
- BW Van Wilgen (2004) Response of savanna fire regimes to changing fire management policies in a large African National Park. Conservation Biology 18(6): 1533-1540.
- S Khanal (2015) Wildfire trends in Nepal based on MODIS burnt-area data. Banko Janakari 25(1): 76-79.
- X Tian (2013) Distribution characteristics and the influence factors of forest fires in China. Forest Ecology and Management 310: 460-467.
- (2004) U Nations International Forest Fire News No.29.
- (2002) NBS Nepal Biodiversity Strategy Kathmandu, Nepal: Ministry of Forest and Soil conservation. Kathmandu Nepal.
- SS Sharma (2006) Participatory forest fire management: an approach. Int Forest Fire News No. 32.
- P Gentle (1996) A study on forest fire at Bara district of the Nepal’s Terai. Banko Janakari 7(1): 39-42.
- Padillah (2006) Forest Fire in Terai Nepal. International Forest Fire News (IFFN) 34(34): 58.
- AM Benndorf, JG Goldammer (2008) Fire management working papers: Global forest resources assessment 2005 report on fires in the South Asian region. Working Paper FM/14/E. FAO, Rome.
- P Firefight, S East (2003) Community-based fire management: case studies from China, The Gambia, Honduras, India, the Lao People’s Democratic Republic and Turkey. RAP Publication.
- KM Bajracharya (2002) Forest fire situation in Nepal. International Forest Fire News 26: 84-86.
- (2007) FAO Forest Management-Global Assessment 2006. FAO Forestry paper No. 151, Rome.
- (2013) GON Nepal disaster report, 2013. Ministry of Home Affairs (MoHA), Government of Nepal.
- (2012) ICIMOD Forest fire Detection and Monitoring and Monitoring System in Nepal Brochure. International Center for Integrated Mountain Development, Kathmandu, Nepal.
