Abstract
This paper applies multivariate Cornish-Fisher techniques to calculate the asymptotic critical values of the bivariate Mann-Whitney statistic, which is used in two-stage study designs.
Introduction to Mann-Whitney Statistic and Two- Stage Test
Consider the problem of testing a difference in two groups. Suppose that the continuous responses X1, . . . , XM are from a control group, and the continuous responses Y1, . . . , YN are from a treatment group. The Mann-Whitney U test [1], equivalent to the Wilcoxon rank sum test [2], uses the statistic
 (1)
(1)Here I(Xi < Yj )is 1 when Xi < Yj holds and 0 otherwise. The statistic U is designed to test the null hypothesis that the distribution of Xj is the same as that of Yj, vs. the alternative hypothesis that P [Yj ≥ Xj] > 0.5, at level α. A critical value c is selected as the smallest value so that P0 [U ≥ c] ≤α . If U is larger than the critical value, the treatment group is determined to be superior to the control group.
Due to ethical concerns and resource management, common designs allow for early stopping in the presence of strong, early evidence. Spurrier and Hewett [3] provide a two-stage test based on the Mann-Whitney statistic. Wilding, et al. [4] discuss such a procedure in the context of clinical trials.
The two-stage test has two critical values, c1 and c2. First, gather m observations from control group and n observations from treatment group. Define
 (2)
(2)If U1 meets or exceeds the first critical value c1, stop the trial early to declare the treatment group is superior to control group. If U1 is less than c1, gather observations from the control group and observations from treatment group, where , . Define
 (3)
(3)If U2 is larger than or equal the second critical value c2, claim the treated is superior to the controls.
The critical value of Mann-Whitney statistic in one dimension can be easily calculated. The critical values for the two stage test are more difficult to calculate. Due to the complexity of the mass function for two dimensional Mann-Whitney statistics, obtaining exact critical values is computationally intensive. Kolassa, et al. [5] present a plan for approximating these critical values using a bivariate Cornish–Fisher expansion; this expansion requires bi- variate cumulants of U1 and U2. Furthermore, they use a bivariate Edgeworth expansion to approximate power; this expansion also requires bivariate cumulants, in this case for an alternative distribution. This manuscript provides tools for calculating these bivariate moments, and hence bivariate cumulants. Under the null hypothesis, Xi and Yi are jointly independent and identically distributed. The second section defines certain indicator functions and gives their null expectation. The third section presents first and second order joint moments of the Mann-Whitney statistics. The fourth section presents third- and fourth-order mixed moments. All of these moments are calculated under conditions general enough to encompass both the null and alternative distributions. The fifth section discusses the calculations of cumulants from moments.
Indicator Function Definitions and Expectations
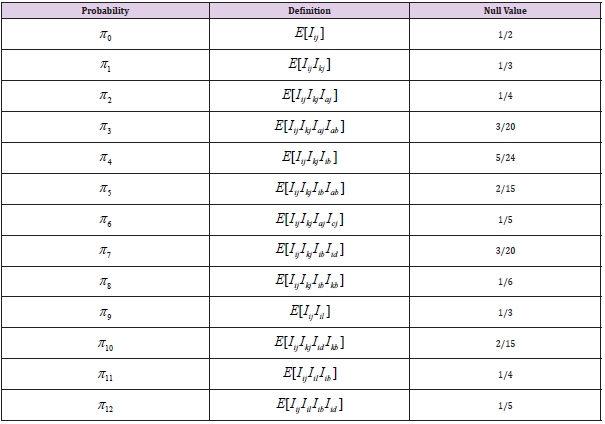
Let Iij take the value 1 if Xi < Yj , and 0 otherwise. Products of these indicators represent indicators of more complicated sets. For example, Iij Iil Ikj = 1 means that all of Xi < Yj , Xi < Yl , Xk < Yj hold, and Iij Iil Ikj= 0 means that at least one of them does not hold. Below, moments of U = (U1,U2 ) will be expressed as sums of such products. Terms will be factors with non-overlapping indices. Table 1 summarizes expectations of these factors. Zhong, et al. [6] performs these calculations in detail. Null values can be calculated using symmetry properties.
First- and Second-Order Moments
In general, using Table 1,  {probdef}
Note that

By the same reasoning,

Higher Moments
As a tool for calculating E[U32 ] and E[U42 ] first define some sums that make up parts of this product. Let
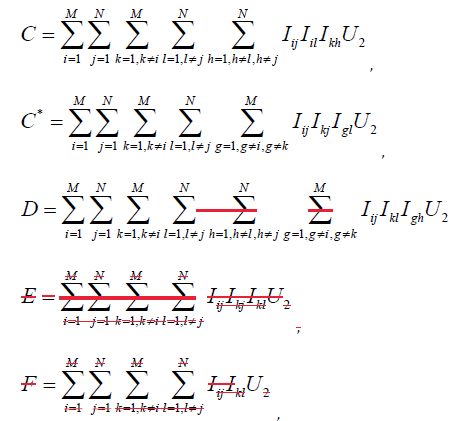
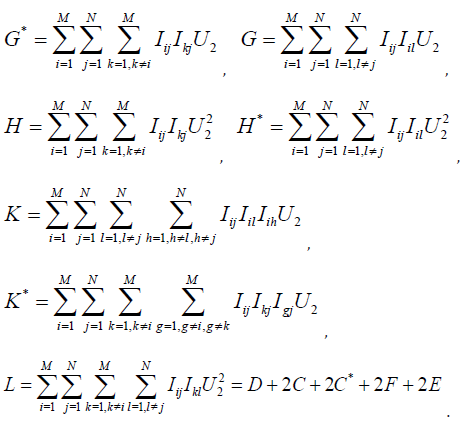
Expectations of these sums of products of indicators can be calculated by separating the sums into quantities with indices replicated and independent quantities whose expectations are given in Table 1, to obtain:
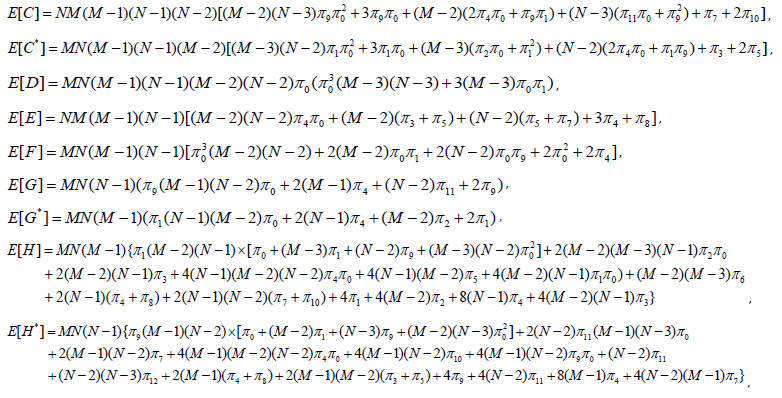
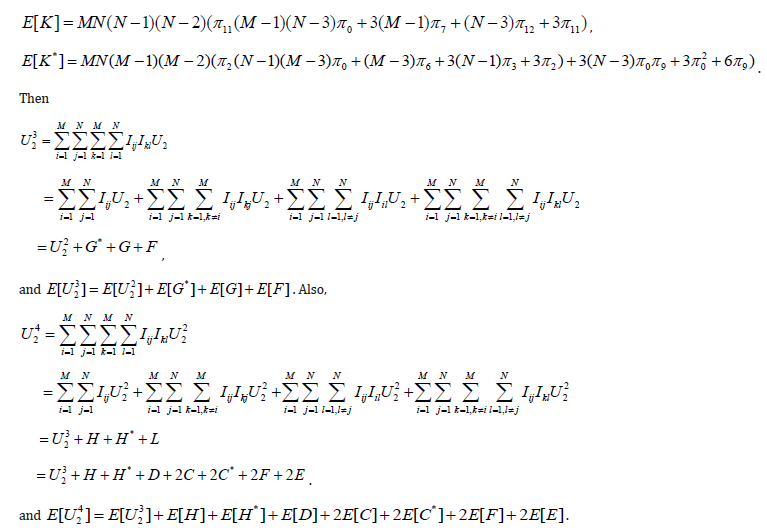
Moments of U1 are calculated substituting m and n for M and N respectively. Conditional expectations are used to find mixed moments. In order to calculate expectations of mixed moments, introduce indicators indicating whether the observation ranked i in the first sample falls among those observations collected before the interim analysis, and similarly with the observation ranked j among the second sample:
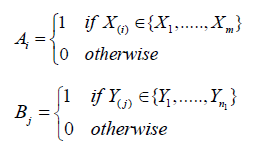
Then the Mann–Whitney statistic calculated using data before the interim analysis is

The law of iterated expectations will be used to calculate mixed moments, by first conditioning on order statistics of the two samples ordered separately:
Z =(X(1),.....,X(M), Y(1),......Y(N)).
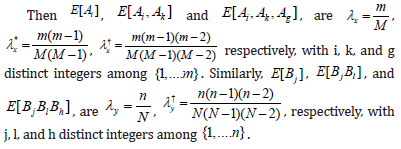
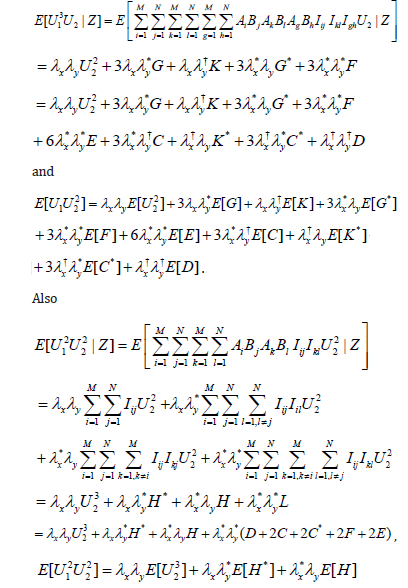
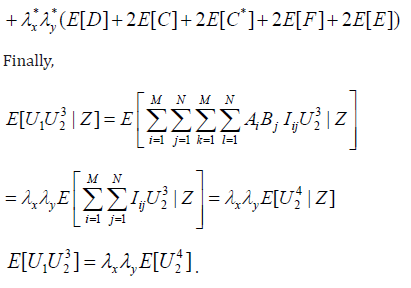
Calculation of mixed moments will proceed by expressing U1TU2S in terms of quantities from U1, C, D, E, F, G, G*, H, H*, K, and K* as above, times
the indicators Ai, one such quantity attached to each distinct value of the first index, and times the indicators Bj, one such quantity attached to each distinct value of the second index. Then the expectations of products such as AiAk with i ≠ k are expectations of products from a multinomial, and similarly with the B indicators.
Then λx, λ*x, and λ†x are the expectations of products of one, two, and three such A, respectively, and λy, λ*y, and λ†y are the expectations of products of one, two, and three such B. Then
E[U1 U2] = [E[E[U1 U2 |Z| = E[U22] λx λy.
Also,
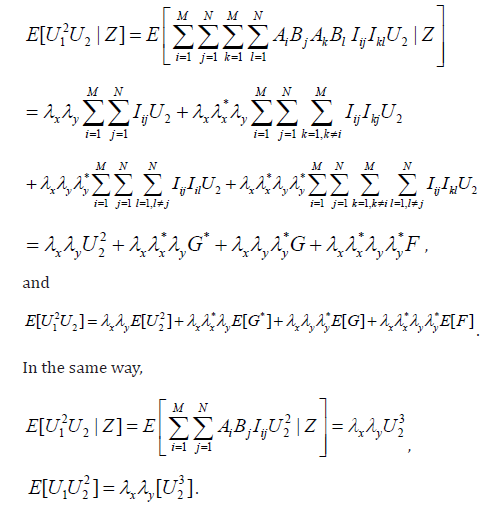
Next,
Multivariate Cumulants
Multivariate cumulants can then be calculated from these moments. Let
μij....k= E[Ui Uj..... Uk ],
for indices i, j, …., k taking values in {1, 2}. Define the moment generating function
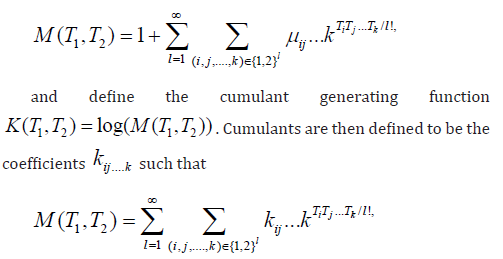
such that coefficients with indices permuted are equal. Analytic expressions for cumulants in terms of moments are simple in one dimension but are complex enough to be unusable in as few as two dimensions. Kolassa [7] presents software to perform these calculations numerically, as a result of using a symbolic calculus tool to output numerical code directly.
References
- Mann HB, DR Whitney (1947) On a test of whether one of two random variables is stochastically larger than the other. Ann Math Statist 18(1): 50-60.
- Wilcoxon F (1945) Individual comparisons by ranking methods. Biometrics Bulletin 1(6): 80-83.
- Spurrier JD, JE Hewett (1976) Two-stage Wilcoxon tests of hypotheses. Journal of the American Statistical Association 71(356): 982-987.
- Wilding GE, G Shan, AD Hutson (2012) Exact two-stage designs for phase ii activity trials with rank-based endpoints. Contemporary Clinical Trials 33(2): 332-341.
- Kolassa J, X Chen, Y Seifu, D Zhong (2020) Power calculations and critical values for two-stage nonparametric testing regimes. Under review.
- Zhong D, J Kolassa (2017) Moments and Cumulants of The Two-Stage Mann-Whitney Statistic. Technical report.
- Kolassa J (2018) Two Stage: Two Stage MWW. R package version 1.0.

 Case Report