 Research Article
Abstract
Wheat is an important staple food and cash crop of the world. To obtain better yield from saline soils and saline waters, it is imperative that salt tolerant wheat varieties should be developed. Soil salinity is one of the greatest problems faced by agriculture today. There are many mechanisms by which plants tolerant the problems associated with salinity all of which are genetically controlled. Salt tolerance is a mixture of different morpho-physiological processes which are controlled by many genes across the wheat genome. DNA markers enhance the recovery rate of isogenic recurrent genome after hybridization and facilitate the introgression of multiple genes with additive effects necessary to increase stress tolerance. Molecular markers are used to transfer alleles of interest from wild relatives into cultivated genotypes. SSR primer pairs were used to find DNA marker linked with salinity resistance. A total 200 SSR primer pairs used. Out of which four SSR primers were polymorphic with the parents. These four polymorphic primers applied on F2 population. Development of microsarellite markers provided a new approach to MAS in breeding practice. Based on these criteria microsatellite markers are preferable to RFLP markers. Once developed microsatellite markers are easy to use and less expensive to assay because the procedure for microsatellite analysis virtually involves only amplification and electrophoresis.
Keywords:Wheat; Salinity; Marker; SSR
Introduction
The salt concentration in the soil, when reached a level
that is harmful for growth, salinity is said to be developed.
The accumulated salts are mostly the soluble salts of calcium,
magnesium and potassium. The anions found are mostly chlorides
and sulfates with some carbonates and bicarbonates [1]. Although
plants growing in salty soils (halophytes) do not normally required
high salinity, some like Halogeton glomerata, will not survive in
non-saline culture solution, while other like salicornia, and grow
only poorly [2]. One solution is to make the soil environment more
suitable for the healthy growth of a wide range of plants. This can be
achieved through a hydrological agricultural engineering approach
in conjunction with the chemical/biological reclamation of saltaffected
soils. However, certain limitations especially insufficient
supply of canal water, saline underground irrigation water, the
increasing price of energy-intensive inputs, poor soil drainage
and mismanagement of water and soil resources mean that the
technological approach is unlikely to achieve the desired success.
Since many of salt affected soils are beyond the reach of
conventional reclamation techniques, a major scientific thrust
has been aimed at developing suitable salt tolerant cultivars to
bring these lands into agricultural productivity. Nevertheless, it
must be emphasized that both approaches are complementary
and not mutually exclusive. In Pakistan, wheat is grown on about
8.46 million hectares with total production of over 21.07 million
tones, but a significant part of the wheat-growing area suffers from
salinity and sodicity which adversely affects crop fields. If varieties
of wheat capable of giving high yields on slight to moderately saltaffected
soils could be developed, the productivity of such lands
would be increased manifold and it might also permit expansion of
agriculture into more marginal lands.
Salinity tolerance in wheat has been and is being extensively
researched in Pakistan and elsewhere in the world but still efforts to
improve salt tolerance have been hampered by a number of factors,
particularly the lack of understanding of the mechanisms of salt tolerance and interaction of salinity with various environmental
factors with regards to plant growth. Wheat tolerance to salinity
varies with the stage of plant growth, nature and level of salinity,
duration of stress and is affected by soil moisture, climate, nutrition
and management practices. Different physiological traits such
as selectivity for potassium, exclusion and compartmentation of
sodium and chloride ions an osmotic adjustment by the accumulation
of organic solutes have all been related to salt tolerance of wheat
crop plants [3]. The demand for wheat is expected to grow faster
than any other major agricultural crop. Due to land limitations, the
enhancement of wheat production must come from higher absolute
yields, which can only be met by the concerted action of scientists
involved in diverse agricultural disciplines and in particular by
increased efforts in plant breeding [4].
In addition to continuous investments in conventional breeding
methods, biotechnological tools and the better understanding of
the current and expanded genetic diversity should be considered
for raising the yield frontier in wheat. Genetic diversity is prerequisite
for any successful breeding program. Cultivation or
germplasm with a narrow genetic base entails a risk due to genetic
vulnerability. Many wheat cultivars conserved in seed banks are
not sufficiently characterized to inspire breeders ‘interest for
their efficient exploitation. Patterns of genetic variation within
and among wheat land cultivars are usually unknown [5]. Little
information about the genetic variation within and among land
cultivar accessions is available.
Molecular markers can support a more detailed characterization
of genetic resources. Avast potential lies in their ability to identify the
structure of genetic diversity within and among accessions, which
can be of great importance for the optimization of collections, the
planning of seed regeneration, and the successful implementation
of pre breeding approaches. Molecular markers provide a direct
measure of genetic diversity and go beyond the indirect diversity
measures based on agronomic traits or geographic origin. Simple
sequence repeats (SSRs) are highly polymorphic in wheat and,
therefore, suitable for the discrimination of genotypes. They are
generally genome specific, abundant, co dominant, and cover all
21wheat chromosomes. They have been successfully employed to
characterize genetic diversity in seed bank collections of improved
wheat germplasm [6] and wild relatives [7,8].
Materials and Methods
The Plant Material
In the present studies, F2 segregating populations and their
parents, which obtain by crossing
(S-24 x DN-27).
Generation of Bluks
Two DNA pools contrasting for salinity resistance were formed by mixing the same amount of DNA from individual, plants. One pool or bulk consisted of equal amounts of DNA of 15 F2 plants showing resistance to salinity, and the other was similarly formed from DNA of 15 F2 plants susceptible to salinity. These two DNA were then used in polymerase Chain Reaction (PCR) to find polymorphism.
DNA Extraction
DNA was extracted following (Plaschke et al. 1995) with some
modifications. Fresh leaf tissue (0.1-0.2 g) was ground with a pestle
and mortar in liquid nitrogen and transferred into two Eppendrof
tubes and added to them 0.75 ml of heated 2% CTAB buffer
(Cetyltrimethyl ammonium bromide) containing 6μl mercaptoethanol.
This was incubated for 30 minutes at 65°C, then 0.75ml
of chloroform: isoamyl-alcohol (24:1) was added and the tube was
inverted gently for its proper mixing. Spinning it at 10,000 rpm for
5 minutes separated the plant debris. Avoiding the interface, the
supernatant containing nuclear material was removed to a new
tube and an equal volume of ice-cold isopropanol was added to it.
Gentle mixing for 5 minutes allowed the DNA to precipitate and
further centrifugation for 5 minutes at 10,000 rpm caused DNA to
accumulate as a pellet. Supernatant was poured off and DNA was
allowed to dry by inverting the tube over a tissue paper. DNA was
resuspended in 1 ml 70% ethanol.
Ethanol was discarded after spinning for 5 minutes at 13,000
rpm in a microcentifuge. To further purify the DNA, it was
resuspended in 400 μl TE (0.01M Tris HCl and 0.001 M EDTA
(ethylene diamine tetra acetic acid disodium salt), pH 8.0), 40 μl
3M sodium acetate and 800 μl 95% ethanol. After 5-7 minutes
this DNA was again centrifuged at 13,000 rpm for five minutes
and supernatant was discarded leaving the DNA as pellet in the
tube. This DNA was re-suspended in 1 ml 70% ethanol and spun at
13,000 rpm for 5 minutes. The supernatant was discarded, and DNA
pellet was dried under vacuum by inverting the tube upside down
for 30 minutes. The DNA pellet obtained was suspended in 100 μl
sterile deionised water (SDW) at room temperature to dissolve it
properly and stored in an Eppendorf tube at –20°C until required
for further use.
DNA Quantification
Solutions of nucleic acids strongly absorb ultraviolet light with λmax 260 nm. The intense absorption is due to presence of aromatic purine and pyramidine bases. A solution of a double stranded DNA at a concentration of 50 μg/mL in a 1-cm quartz cuvette will give an A260 reading of 1.0. Therefore, the concentration (X) of double stranded DNA solution with A260 of 0.15 is,
50/1.00 μg/mL = X/0.15 μg/mL then X = 7.5 μg/m
SSR Analysis
The amplification reaction was performed in a total volume of 20 μl following Roder et al. (1998) protocol SSR (PCR) reaction. Polymerase Chain Reaction (PCR) mixture was prepared using the following composition for each DNA sample.
Sterilized Deionized Water (SDW)= 8.0μl
Primer Forward = 0.5μl
Primer Reverse = 0.5μl
DNA template = 1.0μl
ReadyMixTM PCR Master Mix = 10.0μl
Total volume = 20.0μl
Out of the total PCR volume, 10 μl of each sample was taken and loaded in the high resolution (Metaphor) 2% agarose gel for visualization of PCR products
SSR Profile
A total of 61 Polymorphic SSR primers were applied to fingerprint the accessions. Roder et al. [10] protocol was used for SSR (PCR) profile:
Lid temperature 110 °C
Initial Denaturation 94 °C 4 minutes
Denaturation 94 °C 1 minute
Annealing 58-60 °C 1 minute 45 Cycles
Extension 72 °C 1 minute
Last extension 72 °C 10 minutes
Hold at 22 °C
Preparation of 2% Agarose Gel
The PCR products were run on 2% fine Agarose (EL grade) and bands were resolved by staining with ethidium bromide solution. Gel tray and combs were rinsed in distilled water. Appropriate combs were placed in gel tray. Prepared 100mL of 0.5 X TBE electrophoresis buffer was measured with graduated cylinder and poured into 250 mL conical flask. Added 2 gm of Agarose powder was to make 2 % gel and placed in microwave until it boils (1-2 minutes). Add 4 μL ethidium Bromide was added and gently swirled. The Agarose solution was gently added to gel tray taking care that no bubble was formed and removed if any formed. The gel was allowed to settle at room temperature for about 20-30 minutes then combs and end pieces of paper tape were removed.
Running a Gel
Gel box was filled by 0.5X TBE buffer and gel was placed in gel box. Added 3 μL migration dye was added to PCR products. Using the pipette 10 μl of each sample is loaded into appropriate lanes of the gel. 5 μl of ladder DNA was loaded on each end of wells. Run at 80 volts for 1hour. When dye is reached to opposite ends, the gel tray was removed, and gel was placed on UV Transiluminator to see the bands.
Data Analysis
The fingerprints were examined under ultraviolet Transilluminator and photographed using SyneGene Gel Documentation System. The SSR bands were counted, and the presence and absence of bands were scored by 1 (present) and 0 (absent). The data was analyzed for estimation of genetic diversity and similarities among accessions by using Popgen software Version 1.32.
Result and Discussion
They arise from different classes of DNA mutations such as substitution mutations, rearrangements or errors in replication of tandemly repeated DNA [11]. A total of Sixty one SSR primer pairs were used to find DNA markers linked with salinity tolerance. The conditions for polymerase chain reaction (PCR) were optimized for each of the SSR primers. Microsatellites are simple, tandemly repeated sequence motifs flanked by unique sequences. SSR polymorphism (SSRP) reflects polymorphism based on the number of repeat units in a defined region of the genome being investigated [12]. The genomic DNA of S-24 and DN-27 wheat parents were used to optimize the PCR condition for the SSRs. A concentration of 32.6 ng was found optimum for good amplification in final volume of 20 μl. Similarly, 2mM of MgCl2 was found optimum in 20 μl final volume. In PCR, 2-2.5 units of Taq Polymerase are normally used in 100 μl final volume. However, in the present study, 1 unit/20μl reaction was used to amplify the loci without non-specific products [13-20].
Annealing temperature is one of the most important parameters that need adjustment in the PCR. The normal range of annealing temperature is 36-75μC.
Screening of Wheat Genotypes Involved in Crossing
The S-24 and DN-27 were screened with the SSR primer pairs. Polymorphisms were observed among the parents with Xgwm52- 3D, Xgwm98-3D, Xgwm 115-4B and Xgwm137-2A primer pairs. The other was found monomorphic. The primer pair Xgwm52-3D amplified two alleles. The estimated size of alleles at one locus was 190 bp (a1) in S-24 and 185 bp (a2) in DN-27 but at the second locus the parents were monomorphic. Similarly, two alleles were amplified with Xgwm98-3D. The approximate size of polymorphic allele at one allele was 205 bp in the salinity resistant parent S-24, while it was absent in salinity sensitive parent (DN-27). Thus, the behaviour of this allele was dominant. The second allele was found monomorphic (Figure 1). These markers are selectively neutral because they are usually located in non-coding regions of DNA. With the use of molecular marker techniques, it would now be possible to hasten the transfer of desirable gene among varieties and to introgression of novel genes from related wild species. Polygenic traits which were previously very difficult to analyze using traditional plant breeding methods, would now be easily tagged using molecular markers [21-23].
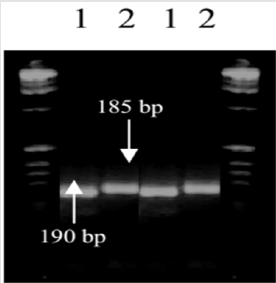
Figure 1: Screening of wheat genotypes involved in crossing with Xgwm52-3D. 1= S-24, 2= DN-27.
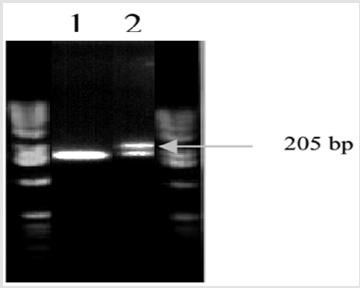
Figure 2: Screening of wheat genotypes involved in crossing with Xgwm98-3D. 1= S-24, 2= DN-27.
A total of two loci were detected with the primer pair Xgwm
115-4B. The estimated size of polymorphic allele at one locus was
240 bp in S-24 and was dominant in nature. At the second allele
the parents were monomorphic. However, the polymorphism was
only at first allele. Typically, they may be di-nucleotides (AC)n,
(AG)n, (AT)n; trinucleotides (TCT)n, (TTG)n; or tetra-nucleotides
(TATG)n, where ‘n’ is the number of repeating units. The (AT)n dinucleotides
are the most abundant type of SSR in plants, and AG, TC
and AC motifs are less frequent (Powell et al., 1996). Similarly, the
amplified product size with the primer pair Xgwm137-2A was in
the range of 175-200 bp. The polymorphic product of Xgwm137-2A
locus was easily resolved on 2.5% agarose gel. A total of two alleles
were detected and designated as `a1’ (200bp) and `a2’ (175 bp).
The polymorphic allele (a1.200bp) was present in S-24 but it was
absent in DN-27. Thus, the expression of this locus was dominant
(Figure 2). The second locus was found monomorphic. They are valuable genetic markers because they are co-dominant, detect high
levels of allelic diversity, and are easily and economically assayed
by the polymerase chain reaction (PCR). Results from screening a
wheat genomic library suggest that there are about 5700-10,000
microsatellite in wheat, with different repeats and their relative
frequency decreases with increasing size of the repeat motif [24-
28].
Microsatellites are highly mutable lici which may be present
at many sites in a genome. As the flanking sequences at each of
these sites may be unique, once SSR loci are cloned and sequenced.
Primers can be designed to the flanking sequences. The resultant
sequence tagged microsatellite usually identifies a single locus
which, because of the high mutation rate of SSR, is often multi-allelic.
Alleles which differ in many base pairs of length can be resolved
on agarose gels but often SSR,s are visualized on sequencing gels
where wingle repeat differences can be resolved and thus, all
possible alleles can be detected. SSR are high informative markers
because they are co-dominant (unlike RAPDs and AFLPs) and
generally highly polymorphic. The nature of the PCR-based assay
used in their amplification and detection implies that they are
highly reproducible between laboratories.
Linkage of Microsatellite Markers with the Salinity Resistance Gene
The primer pairs Xgwm52-3D, Xgwm98-3D, Xgwm 115-4B and Xgwm137-2A that amplified polymorphic products among the parents were selected to amplify the genomic DNA of 30 each F2 extreme salinity resistant and salinity sensitive plants derived from the crosses S-24 x DN-27. Firstly, the linkage analysis was conducted on F2 resistant plants. The primer pair Xgwm52-3D amplified two alleles. At the first locus, 26 out of 30 homozygous resistant F2 plants amplified `a1’ allele. While, `a2’ allele was amplified by 24 out of 30 homozygous susceptible F2 plants. Thus, at this locus, `a1’ allele was linked with the salinity resistant locus. The recombination frequency at this locus was 18.7%. Similiarly at the second locus two alleles were amplified (b1and b2). The recombination frequency at this locus was 20.1%. Two alleles were found with primer Xgwm137-2A in F2 population of S-24 x DN-27 CROSS.A total of 30each salinity resistance plants were surveyed with the primer pair. Out of 30 salinity resistance plants amplified `a2’ allele and the rest were recombinants. But seven of the salinity sensitive plants yielded amplification profile like parent (a2) indicating recombinant plants. The frequency of the recombination at this locus was 19%.
References
- Ashraf M, JW O'Leary (1996) Responses of some newly developed salt-tolerant genotypes of spring wheat to salt stress: II. Water relations and photosynthetic capacity. Acta Bot Neerlandica 45(1): 29-39.
- Greenway H, R Munns (1980) Mechanisms of salt tolerance in nonhalophytes. Annu Rev Plant Physiol 31: 149-190.
- Watson R, J Pritchard, M Malone (2001) Direct measurement of sodium and potassium in the transpiration stream of salt-excluding and non-excluding varieties of wheat. J Exp Bot 52(362): 1873-1881.
- Braun H Payne, TS Morgounov AL, Ginkel M, Rajaram S (1998) The challenge: one billion tons of wheat by 2020. In: Slinkard AE (Ed.), Proc 9th Int wheat Genet Symp, Saskatoon, Canada.
- Gollin D, M Smale, B Skovmand (2000) Searching an ex-situ collection of wheat genetic resources. Am J Agric Econ 82(4): 812-827.
- Li YC, Fahima T, Peng JH, Roder MS, Kirzhner VM, et al. (2000) Edaphitic microsatellite DNA divergence in wild emmer wheat triticum dicoccoides at a microsite: Tabigha, Israel. Theor. Appl.Genet. 101: 1029-1038.
- Borner A, S Chebotar, V Korzun (2000) Molecular characterization of the genetic intergrity of wheat (Triticum aestivul L.) germplasm after long term maintenance. Theor Appl Genet 100: 494-497.
- Hammer K (2000) Microsatellite markers. Anew tool for distinguishing diploid wheat species. Genet Resource and Crop Evol 47: 497-505.
- Bayai J, P Szucs, I Kasai, K Meszaros, C Cuti, LZ Bedo (2006) Identification of winter wheat cultivars by simple sequence repeats. Cer Res Comm 34(2-3): 865-870.
- Roder MS, V Korzun, K Wendehake, J Plaschke, MH Tixier, et al. (1998) A Microsatellite Map of Wheat. Genetics 149(4): 2007-2023.
- Paterson AH (1996) Making genetic maps. In: AH Paterson (Ed.), Grnome mapping in plants. R.G. Landes Co. San Diago Calif. Academic Press Austin, Texas U.S.A. pp. 23-39.
- Jacob HJ, K Lindpaintner, SE Lincoln, K Kusumi, RK Bunker, et al. (1991) Genetic mapping of a gene causing hypertension in the stroke-prone spontaneously hypertensive rat. Cell 67(1): 213-224.
- Charcosset A, L Moreau (2004) Use of molecular markers for the development of new cultivars and the evaluation of genetic diversity. Euphytica 137(1): 81-94.
- Collard BYC, MZZ Jahufer, JBR Brouwe, ECK Pang (2005) An introduction to markers, quantitative trait loci (QTL) mapping and Marker-assisted selection for crop improvement: The basic concepts. Euphytica 142: 169-196.
- Fu YB, GW Peterson, JK Yu, L Gao, J Jia, KW Richards (2006) Impact of plant breeding on genetic diversity of the Canadian hard red spring wheat germplasm as revealed by EST derived SSR makers. Theor Appl Genet 112(7): 1239-1247.
- Gao LF, RL Jing, NX Huo, Y Li, XP Li, et al. (2004) One hundred and one microsatellites loci derived from ESTs (EST-SSR) in bread wheat. Theor Appl Genet 108(7): 1392-1400.
- Leigh F, V Lea, J Law, P Wolters, Wl Powel, et al. (2003) Assessment of EST-and genomic microsatellite markers for variety discrimination and genetic diversity studies in wheat. Euphytica 133: 359-366.
- Li YC, T Fahima, JH Peng, MS Roder, VM Kirzhner, A Beiles, et al. (2000a) Natural selection causing microsatellite divergence in wild emmer wheat at the ecologically variable microsite at Ammiad, Israel. Theor Appl Genet 100: 985-999.
- Liu ZH, JA Anderson, J Hu, TL Friesen, JB Rasmussen, et al. (2005) A wheat intervarietal genetic linkage map based on microsatellite and target region amplified polymorphism markers and its utility for detecting trait loci. Theor Appl Genet 111(4): 782-794.
- Ma L, E Zhou, N Huo, R Zhou, G Wang, et al. (2007) Genetic analysis of salt tolerance in a recombinant inbred population of wheat. Euphytica 153: 109-117.
- Mahmood A, PS Baenziger, H Bodak, KS Gill, I Dweikat (2004) The use of microsatellite markers for the detection of genetic similarity among winter wheat lines for chromosome 3A. Theor Appl Genet 109: 1494-1503.
- Medini M, S Hamza, A Rebai, M Baum (2005) Analysis of genetic diversity in Tunisian durum wheat cultivars and related wild species by SSR and AFLP markers. Genet Res Crop Evol 52: 21-31.
- Plaschke J, MW Ganal, MS Roder (1995) Detection of genetic diversity in closely related bread wheat using microsatellite markers. Theor Appl Genet 91: 1001-1007.
- Somers JD, P Isaac, K Edwards (2004) A high density microsatellites consensus map for bread wheat. Theor Appl Genet 109: 1105-1114.
- Torada A, S Ikeguchi, M Koike (2005) Mapping and validation of SSR-based markers associated with a major QTL for seed dormancy in wheat. Euphytica 143: 251-255.
- Winter P, G Kahl (1995) Molecular marker technology for plant improvement. World J Microb Biotech 11: 438-448.
- You GX, XY Zhang, LF Wang (2004) An estimation of the minimum number of SSR loci needed to reveal genetic relationships in wheat varieties: Information from 96 random accessions with maximized genetic diversity. Mol Breed 14: 397-406.
- Zhang LY, C Ravel, M Bernard, F Balfourier, P Leroy, et al. (2006) Transferable bread wheat EST-SSRs can be useful for phylogenetic studies among the Triticeae species. Theo Appl Genet 113(3): 407-418.
