 Research Article
Abstract
During strenuous exercise, individuals face a significant risk of developing heatrelated illnesses, such as exertional heatstroke (EHS). Parameters that have demonstrated an important role in monitoring and prevention of EHS development include heart rate (HR), hydration status (determined by serum electrolyte concentrations), and core body temperature. In this study, the performance of two integrated HR monitor and pulse oximeter modules (AFE4403 from Texas Instruments and MAXIM30101 from Maxim Integrated) in capturing raw photoplethysmography (PPG) signals was evaluated during resting, exercise, and motion. PPG signals collected from a wrist-worn device using green light-emitting diodes (LED) provided good HR estimates. However, the device was not resistant to motion artefacts. Further work was conducted to fabricate sensors that could measure sodium concentrations in sweat, and core body temperature from the skin. Once each sensor prototype is finalized, sensor integration could result in a device that measures three bodily parameters to a sufficient degree of accuracy in order th predict the onset of EHS. The fabrication of the other two sensors has not been described in this report.
Keywords:Medical Technology; Heart Rate; Pulse Oximetry
Abbreviations: EHS: Exertional Heatstroke; HR: Heart Rate; LED: Light-Emitting Diodes; PPG: Photoplethysmography, RMSE: Root-Mean-Squared Error; PD – photodetector; NJRC – New Japan Radio Co.; IR – infrared; MEMS – micro electromechanical system. MAPE: Mean Average Percentage Error
Introduction
The sophisticated technology available today has enabled
the integration of biotechnology into modern clinical practice
and has created novel opportunities for advice pertaining to
overall wellbeing to be delivered through virtual platforms [1].
Elegant technologies have potentiated prospects for individuals
to monitor their health in the absence of clinical supervision, by
quantifying physiological parameters and relaying the appropriate
information to users [2]. Refined techniques have been employed
to measure parameters through wearable devices, to facilitate
an extended monitoring period, and to encourage compliance
[3]. A common challenge that non-invasive, user-friendly health
monitoring devices face, however, is obtaining measurements
with both accuracy and feasibility. Another challenge is the lack of
personalization offered by these devices. This report proposes a
multimodal monitoring device comprising three sensors, that could
aid the prediction and prevention of exertional heat stroke (EHS).
The device would be designed to benefit exercising individuals, for
whom the development of EHS is more likely, and thus the value
of continuous monitoring is more pronounced. EHS is defined as a core body temperature exceeding 40°C, associated with
neurological dysfunction [4], and is a major cause of endurancerelated
morbidity [5].
Milder forms of heat-related injury may predict eventual
development of EHS [6]. However, due to the non-specific nature
of the symptoms of this ‘precursor state’, and possible neurological
impairment, an individual may be unaware of their increasing risk
of EHS development without monitoring assistance [7]. Identifying
individuals within the precursor state would provide a means
for preventative intervention and could potentially extend the
lifesaving “golden hour” treatment window in those identified in
early stages of EHS manifestation [8]. The concept of a wearable
technology designed to prevent EHS is not entirely original, and
existing literature modelled our expectations when building a
suitable device. Lin, et al. [9] described a device that measured HR,
body temperature, environmental temperature, and humidity; the
device comprised a wearable component, wireless transmission,
and a back-end monitoring system (to analyze heatstroke risk)
and employed corrective filtering algorithms [9]. Gao, et al. [10]
measured concentrations of glucose, lactate, sodium, and potassium
in the sweat; this mechanically flexible and fully integrated sensor
array for multiplex in situ perspiration was fabricated as a ‘smart
wristband’ with a wireless, flexible printed circuit board component
[10]. Wu, et al. [11] went on to include measurements of sweat pH;
this was achieved by an antimony ion-selective electrode. However,
the report lacked detail regarding the roles that sweat pH and skin
temperature measurements play in a health-related setting [11].
Several measurable parameters were deliberated in the early
stages of the research. The parameters eventually chosen included
photoplethysmography (PPG), sweat sodium concentration and core
body temperature. Parameters were selected on the basis that they
could be measured non-invasively and are implicated in one’s risk
of EHS development. In this report, the evaluation of different heart
rate (HR) and pulse oximetry modules is described in detail, as is an
area of vast interest in research pertaining to wearable technology.
The other elements to the device (measurement of sweat electrolyte
concentrations and body temperature) have not been reported.
PPG is a non-invasive, optical method for detecting changes in
blood volume in living tissue. It allows for the instantaneous
computation of both heart rate and peripheral perfusion index.
EHS itself develops due to loss of the normal thermoregulatory
response, exacerbation of systemic inflammatory responses, and
altered expression of heat shock proteins during heat stress. This
results in a range of abnormal physiological responses, summarized
in (Figure 1) [12]. This pathological process involves changes in
cardiac output and tissue perfusion, and thus monitoring of these
processes using PPG is beneficial when assessing one’s risk of EHS.
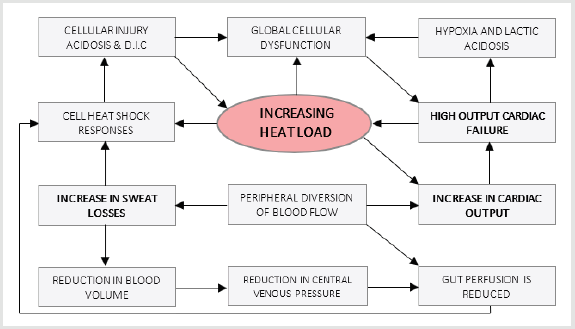
Figure 1: Abnormal pathophysiological responses occurring with loss of normal thermoregulation, as described, and depicted by Hunt and Smith, 2005.
Methods
Device Construction
The performance of two integrated HR monitor and pulse oximeter modules AFE4403 (Texas Instruments) and MAXIM30101 (Maxim Integrated) was evaluated using their respective evaluation modules AFE4403EVM (Texas Instruments) and MAXIM30101ACCEVKIT (Maxim Integrated) respectively. The two different sensor systems were utilised to capture the raw PPG signals. The sensor configurations used for each system are shown in (Table 1). A case for the MAX30101 sensor system was designed in SOLIDWORKS and printed using a Prusa I3 MK3 3D printer with Verbatim PET-G transparent filament. The MAX30101DBEVKIT daughter board was housed in the bottom half of the case (Figure 2) while the USBOSMB mother board was housed in the upper half of the case (Figure 3).
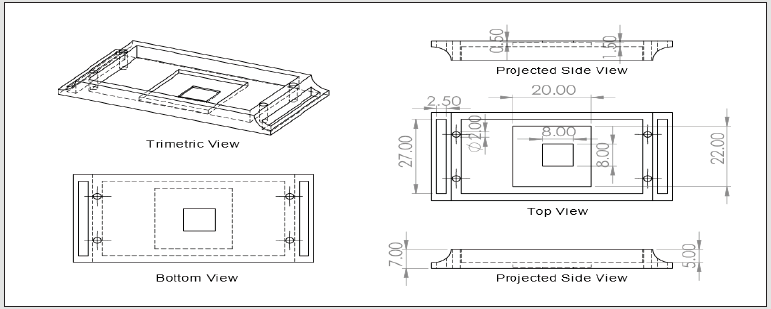
Figure 2: Bottom half of MAX30101 wearable case, units in mm.
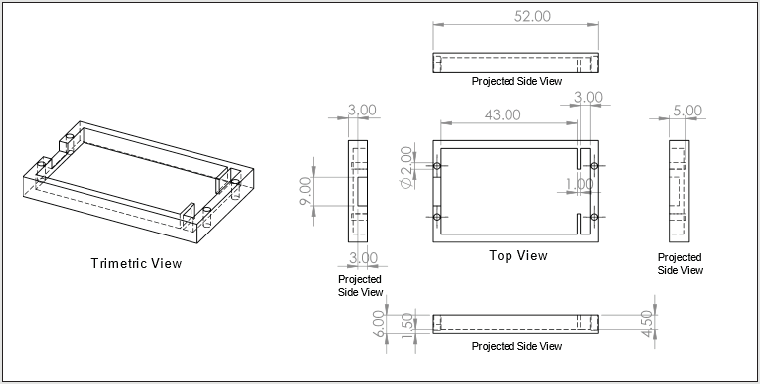
Figure 3: Bottom half of MAX30101 wearable case, units in mm.

Table 1:Summary of sensor configurations used for capturing of PPG data. Separate sensor boards NJL5310R and SPH7050 from the AFE4403EVM were used to capture each of Green and Red LED channels, respectively. The MAX30101ACCEVKIT contains a daughter board comprising multi-channel optical, motion and thermal sensing modules, which was configured to capture data from both Green and IR LEDs simultaneously.
Data Acquisition
Signals from the AFE4403EVM and the MAX30101ACCEVKIT were captured using the AFE4403EVM GUI and MAX30101 EV Kit Software, respectively. Prior to data acquisition, the AFE4403EVM was calibrated using the in-built calibration routine in the AFE4403EVM GUI. The various sensor positions tested are shown in (Figure 4). All data processing was carried out in MATLAB R2019a.

Figure 4: Positioning of sensor for capturing PPG signal.
a) Anterior wrist: Sensor secured 1cm below wrist line in centre of wrist, secured by tape.
b) Anterior wrist with case: Sensor secured 2cm below wrist line in centre of wrist with watch-style straps securing case made
of tape.
c) Chest: Sensor secured in centre of chest directly below the sternum and secured using tape.
Signal Properties
To calculate the signal-to-noise ratio (SNR) of the collected PPG signals, the clean PPG waveform was extracted by applying a bandpass filter to detrended raw PPG signals using the MATLAB function detrend and bandpass. A frequency band of 0.5 to 4Hz was chosen, corresponding to the typical physiological range of HR [17]. The clean PPG waveform was composed of the fundamental HR component as well as its harmonics. The noise component of the waveform was obtained by applying a high pass filter using the MATLAB function high pass with a threshold frequency of 4Hz. For clarity, frequencies below 0.5Hz were not considered in the computation of SNR. The collection of data is summarized in (Table 2).
The SNR is calculated by the formula:
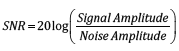

Table 2: PPG signals acquired under stationery and motion conditions.
Heart Rate Algorithm
The proposed HR estimation algorithm framework is presented in (Figure 5) and was implemented by a custom MATLAB function rory(xPPG,fsPPG). The function takes in the raw PPG time series data and the sampling rate of the sensor (in Hz), and outputs the estimated HR in beats per minute (bpm). The algorithm can be divided into 3 stages: noise removal, interval estimation, and HR estimation (Figure 5). The discrete processing steps involved in each stage is outlined in (Table 3).
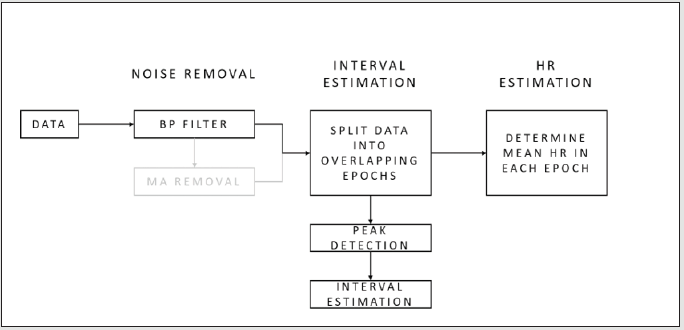
Figure 5: Heart rate estimation algorithm framework utilizing raw PPG data input, each block representing different processing steps. (In grey: motion artefact removal - not included in current algorithm).

Table 3: Processing steps in proposed HR estimation algorithm.
Evaluation of HR Estimation Algorithm
The HR estimation algorithm was evaluated using external databases and raw PPG data collected in this study (Table 4). The root-mean-squared error (RMSE) between the estimated HR calculated from the HR estimation algorithm and the reference HR is calculated by the following formula:
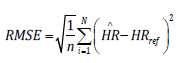

Table 4: Datasets for the evaluation of the proposed HR estimation algorithm.
Results
The SNR of the raw PPG signal was computed from 20 samples taken from a single participant for both green and red light each using the AFE4403EVM and presented in (Table 5). An example of the raw PPG signal for each wavelength is shown in (Figures 6 & 7). The SNR of the raw PPG signals were calculated from 3 simultaneous readings obtained from a single participant using the AFE4403EVM and MAX30101ACCEVKIT with green light and summarized in (Table 6). An example of the spectrogram and the frequency spectra of the signal is shown in (Figure 8). The SNR of 10 raw PPG waveforms was obtained from a single participant using the MAX30101ACCEVKIT housed within a custom 3D-printed case and positioned on the anterior wrist while the participant remained stationary. The results are summarized in (Table 7). 3 measurements of each motion type were taken using the AFE4403EVM and the MAX30101ACCEVKIT with MAX30101 for both periodic and non-periodic movements. An example of the raw PPG waveforms is provided in (Figure 9). An example of the spectrogram and the frequency spectra of the signal obtained from AFE4403EVM during periodic and non-periodic ulnar deviation is shown in (Figure 10). The accuracy of the proposed HR estimation algorithm was tested using 53 physiological recordings of patients from BIDMC.
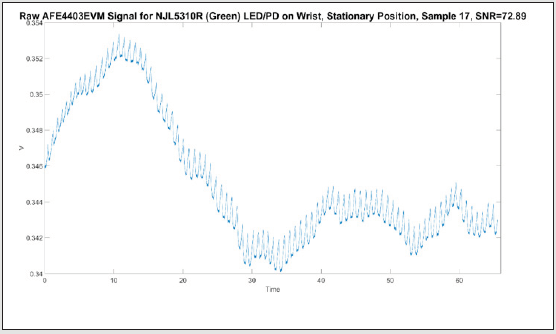
Figure 6: Example raw PPG waveform from AFE4403EVM with NJL5310R green LED/PD on anterior wrist, stationary position. SNR = 72.89.
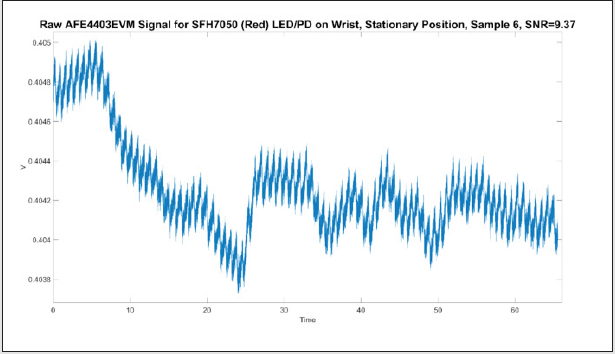
Figure 7: Example raw PPG waveform from AFE4403EVM with SFH7050 red LED/PD on anterior wrist, stationary position. SNR=9.37.

Table 5: Comparison of SNR performance of NJL5310R (green LED/PD) and SFH7050 (red LED/PD) using the AFE4403EVM.
Note: Comparison of SNR performance of PPG signal between green and red LED/PD

Figure 8: a) Spectrogram of raw PPG signal obtained from AFE4403EVM with NJL5310R, λ=525nm, generated using short-time
Fourier transform with a rectangular window of 5000 samples with 4500 sample overlap, sampled at 500Hz.
b) Frequency spectra of 1 second segment of the same PPG signal.
c) Spectrogram of entire raw PPG signal obtained from MAX30101ACCEVKIT with MAX30101 integrated green optical
sensing module, λ=537nm, generated using a rectangular window of 1000 samples with 900 sample overlap, sampled at 100Hz.
d) Frequency spectra of 1 second segment of the raw PPG signal from MAX30101ACCEVKIT with MAX30101 generated using
short-time Fourier transform.
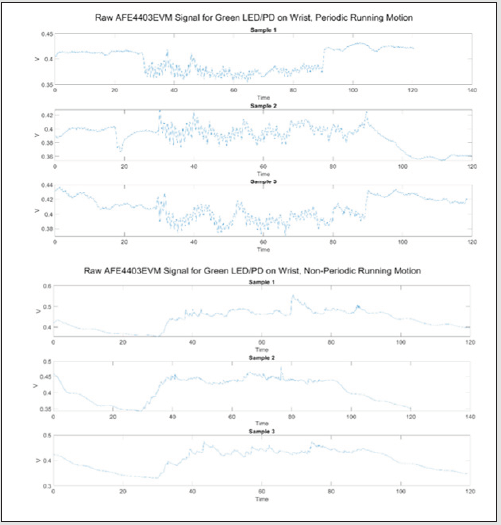
Figure 9: Raw PPG waveform from AFE4403EVM with NJL5310R green LED/PD on anterior wrist during periodic (top) and non-periodic (bottom) running arm swing motion.
Note: Effect of motion artefacts (periodic and non-periodic) on raw PPG signals obtained from AFE4403EVM and MAX30101ACCEVKIT
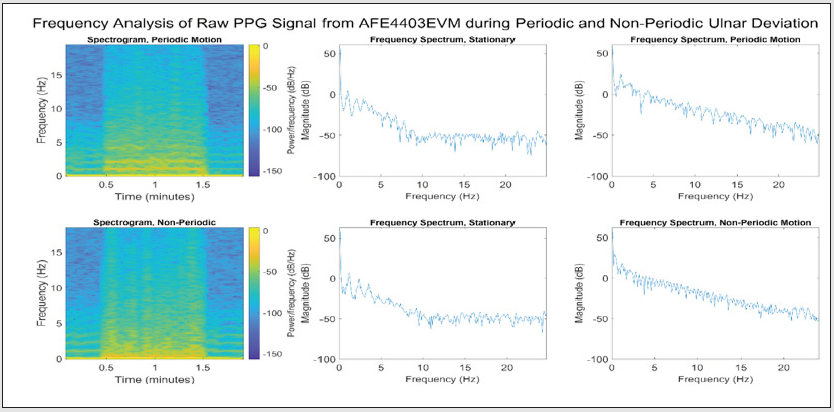
Figure 10: Spectrogram and frequency spectra of raw PPG obtained from AFE4403EVM with NJL5310R, λ=525nm, for periodic (top) and non-periodic (bottom) ulnar deviation. The spectrogram was generated using short-time Fourier transform with a rectangular window of 5000 samples with 4500 sample overlap, sampled at 500Hz. The frequency spectra were taken from a 1 second segment of the raw PPG signal while stationary (t=20s) and during motion (t=60s).

Table 6: Comparison of SNR performance of AFE4403EVM and MAX30101ACCEVKIT using green light.
Note: Comparison of SNR performance of PPG signal obtained from AFE4403EVM and MAX30101ACCEVKIT (on wrist) using green LED/ PD

Table 7: SNR performance of MAX30101ACCEVKIT with case, using green light.
Note: Evaluation of SNR performance of PPG signal obtained using MAX30101ACCEVKIT (on wrist) with case, using green LED/PD
The estimated HR was plotted against the reference HR included within the data set. Of the 53 samples, samples 40 and 41 were excluded from the calculations as the PPG and ECG recordings showed significant corruption of the signals. The correlation and agreement across all datapoints (n = 24070) contained in the 51 samples were calculated and plotted in (Figure 11). 3 simultaneous measurements were taken using the AFE4403EVM and MAX30101ACCEVKIT and the smartwatch for each condition tested (Table 8). The RMSE, standard deviation of RMSE (SD RMSE), and mean average percentage error (MAPE) for each condition is summarized in (Table 8). An example of the comparison of HR estimates from our proposed algorithm and from the smartwatches is given in (Figure 12). The HR estimation algorithm was tested using PPG signals obtained from four subjects while running and walking on a treadmill taken from the dataset “Wrist PPG during exercise” available from the Physio Net database. The RMSE, SD RMSE, and MAPE were calculated between the estimated HR from PPG and the reference HR calculated from simultaneous ECG measurements and summarized in (Table 9). The correlation and agreement across all datapoints (n=800) for each exercise is plotted in (Figures 13 & 14). The performance of the HR estimation algorithm was also tested on the raw PPG waveforms obtained using the AFE4403EVM and MAX30101ACCEVKIT on a range of movements. The results were analysed in 3 segments corresponding to the stationery and motion segments of the PPG signal measured. A summary of the variance of HR in each segment is presented in (Table 10).
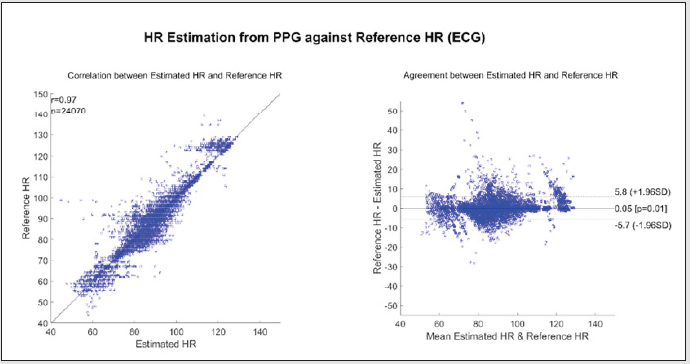
Figure 11: Correlation (left) and Bland-Altman agreement plot (right) between estimated and reference HR.
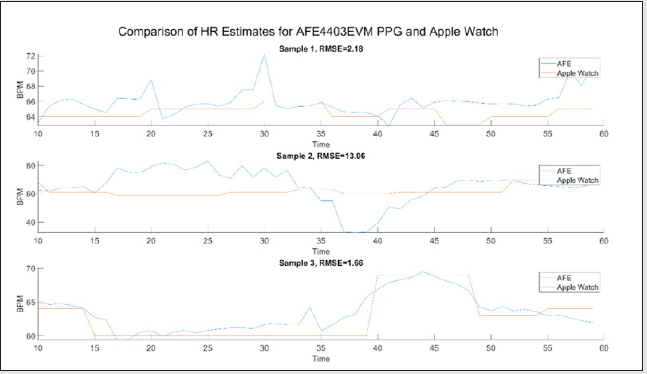
Figure 12: Comparison of HR estimated using the proposed algorithm on raw PPG waveforms measured with AFE4403EVM and HR estimates from the Apple Watch Series 5.

Table 8: Average root-mean-square error (RMSE), standard deviation of RMSE (SD RMSE), and mean absolute percentage error (MAPE) of estimated HR from raw PPG measurements taken using AFE4403EVM and MAX30101ACCEVKIT from the wrist and chest compared to estimated HR from wrist-worn smartwatches.
Note: Comparison of HR estimation algorithm against different smartwatches
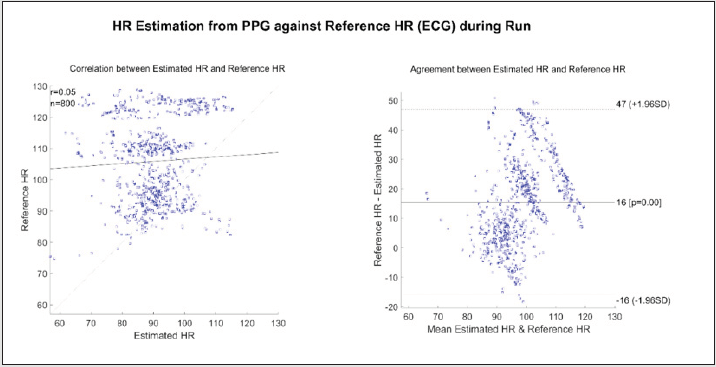
Figure 13: Correlation (left) and Bland-Altman agreement plot (right) between estimated and reference HR during run.
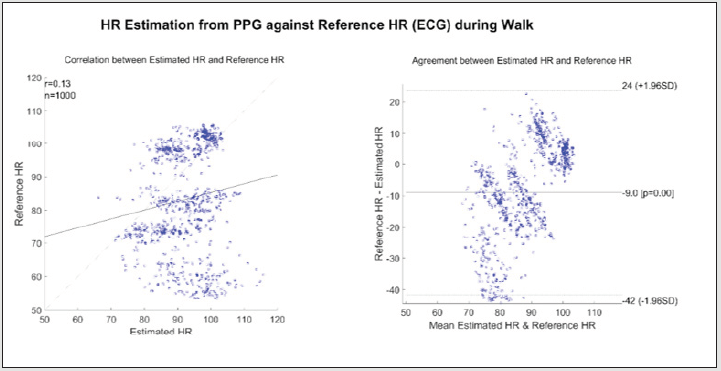
Figure 14: Correlation (left) and Bland-Altman agreement plot (right) between estimated and reference HR during walk.

Table 9: Average RMSE, SD RMSE, and MAPE calculated between estimated HR from PPG and reference HR from ECG.
Note: Evaluation of HR estimation algorithm during exercise and motion

Table 10: Average variance of estimated HR for stationary and motion segments for difference motion types.
Discussion
PPG signals generated using green light resulted in a significantly higher SNR compared to red light. This result is expected as the reflectance pulsation spectrum of blood is greatest around 575nm and smallest around 650nm. Red and infrared wavelengths of light are also known to have deeper tissue penetration, thus picks up more physiological noise such as the movement of blood or tissue beneath the sensor which are the predominant contribution to experimental noise in PPG measurements [13]. As the sensors should be able to function as part of an exercise-focused wearable device, PPG measurements using green light should be used for HR estimation. While it has been reported that skin pigmentation affects the intensity of the reflected light in PPG measurements [13] (due to green light being more strongly absorbed by melanin compared to red light thus resulting in relatively shallower penetration into tissue [14,15]), this was not investigated in this study. While the AFE4403EVM shows better performance compared to MAX30101ACCEVKIT in terms of SNR, the SNR of the MAX30101ACCEVKIT was sufficiently high enough to be amenable to HR estimation. From the spectrograms and frequency spectra of the PPG obtained using the AFE4403EVM and MAX30101ACCEVKIT (Figure 8), the fundamental frequency of the HR and its harmonics can be clearly identified from the peaks occurring between 0-5Hz and is easily distinguishable from the background noise. The periodic HR component can easily be obtained with appropriate filtering and thresholding.
Currently, it was easier to implement the MAX30101ACCEVKIT into the proposed device due to the smaller hardware size and flexible 10-pin FFC ribbon cable (compared to the DB9 to 8 pin header sensor cable for the AFE4403EVM). The MAX30101ACCEVKIT also contained an integrated accelerometer for 3-axis motion tracking, which could be used for MA removal. As such, the proposed device was constructed using MAX30101ACCEVKIT as the PPG sensor. The SNR for the MAX30101ACCEVKIT system housed within the case was found to be approximately 30% higher than without the case. This indicates that the set-up does not appear to impair signal collection and has a SNR comparable to that of the AFE4403EVM system. This increase in SNR may be due to the differences in contact pressure between the sensor and skin when securing the sensor to the wrist with and without the case. However, due to the small number of samples, it was not possible to determine the significance of this difference in SNR within this report. The effect of contact pressure on SNR could be explored in future to optimize the device design. Voluntary motion artefacts were qualitatively observed to introduce large changes in the pulse shape, amplitude, and frequency for the ranges of periodic and non-periodic motions tested. Frequency analysis of the PPG signal obtained showed that motion artefacts resulted in noise that lied within the range of physiological frequencies (0-5Hz) and obscured the frequency peaks indicating the fundamental HR frequency. This decreased the confidence of HR estimation.
It was also observed that movements involving the wrist had a more pronounced effect on the PPG pulse waveforms than those involving the arm. Wrist motions were likely to cause greater movement of tissues beneath the wrist-worn sensor compared to arm motions, and thus introduced more physiological noise than arm movements. Alternative sensor placements could be explored in the future, such as on the chest or forehead, which are prone to less ranges of voluntary movements. The thinner layers of skin and the high impedance of the skull may also result in a high SNR for reflectance-based PPG measurements taken from the forehead. The HR estimation algorithm described in this study closely predicted the user’s actual heart rate. A strong correlation between the estimated HR and the reference HR was observed, with a Pearson coefficient of r = 0.97 and a reasonable limit of agreement of [-5.7 5.8] (Figure 11). The estimated HR showed a slight negative bias of 0.05 bpm. The current HR estimation algorithm provides a good approximation of the actual HR when the subject remains stationary, however, the accuracy of the HR estimation is dependent on the quality (SNR, presence of MA) of the PPG signals obtained. Furthermore, the HR estimation algorithm described in this study was comparable to smart watches. Comparison between the estimated HR using the current proposed algorithm and commercially available wrist-worn smartwatches showed that the estimated HR from the proposed algorithm was able to follow the trend of the estimated HR from the smartwatches with a small margin of error indicated by the MAPE (Table 9).
The estimated HR by the Apple smartwatch appeared to be more robust against sudden large changes in HR compared to the Garmin smartwatch (Figure 12). HR estimated from PPG measurements taken from the chest using the AFE4403EVM were shown to have a higher percentage error against both smartwatches, while measurements taken from the chest using the MAX30101ACCEVKIT did not show large changes in percentage error compared to measurements taken from the wrist. The HR estimation algorithm described was not robust to motion. Comparison between the estimated HR from PPG measurements against reference HR from ECG measurements in the walk and run datasets showed poor correlation and agreement, with Pearson coefficients of 0.05 and 0.13, and broad limits of agreement of [-16 47] and [-42 24] for running and walking respectively (Figures 13 & 14). Additionally, results of the motion tests showed that the HR estimation during the motion displayed significantly larger variance compared to the stationary segments, caused by large fluctuations in the estimated HR due to motion artefacts (Table 10). The bandpass filter implemented in the proposed algorithm can remove high frequency noise and baseline drifts from the raw PPG signal but is unable to correct motion-induced artefacts as these tend to occur within the bandpass threshold. Numerous methods can be explored for the removal of motion artefacts from a range of movements, some of which requiring additional data input such as acceleration or multichannel PPG signals (Table 11).

Table 11: Current methods for motion artefact detection, correction and/or removal.
The current HR estimation algorithm is not optimized in terms of processing speed or complexity. The current algorithm recalculates the peak intervals for all peaks in each window, including redundant overlapping datapoints between adjacent windows. This could be modified in future such that the calculation of peak intervals is only performed on new data points. A different approach using spectral analysis (such as periodogram, short-time Fourier transform, continuous wavelet transforms, sparse-signal reconstruction based spectral estimation) could be performed given that PPG waveforms are quasi-periodic. The current algorithm is also written for post signal acquisition analysis and will need to be modified for realtime signal analysis.
Conclusion
Once final prototypes of each of the aforementioned sensors are developed, the next steps pertain predominantly to integration of the sensors, and mobile application development for data display. The challenges of integration include miniaturization, noise reduction, resilience to MA and bodily attachment of each individual sensor; over the remainder of the project, each team will work to ease the eventual integration process, whilst simultaneously designing a suitable mobile application to accompany the device.
Acknowledgement
We would like to express our gratitude to Professor Martyn Boutelle and Dr Michelle Rogers, who have guided us throughout the integration of the sensor.
References
- Basatneh R, Najafi B, Armstrong DG (2018) Health Sensors, Smart Home Devices, and the Internet of Medical Things: An Opportunity for Dramatic Improvement in Care for the Lower Extremity Complications of Diabetes. Journal of Diabetes Science and Technology 12(3): 577-586.
- Ray TR, Choi J, Bandodkar AJ, Krishnan S, Philipp Gutruf, et al. (2019) Bio-integrated wearable systems: A comprehensive review. Chemical Reviews 119(8): 5461-5533.
- Izmailova ES, Wagner JA, Perakslis ED (2018) Wearable Devices in Clinical Trials: Hype and Hypothesis. Clinical Pharmacology and Therapeutics 104(1): 42-52.
- (2018) NHS England. Heat Exhaustion and Heatstroke.
- Yankelson L, Sadeh B, Gershovitz L, Werthein J, Karin Heller, et al. (2014) Life-threatening events during endurance sports: Is heat stroke more prevalent than arrhythmic death? Journal of the American College of Cardiology 64 (5): 463-469.
- Helman RS (2019) Heatstroke.
- Mazerolle SM, Ruiz RC, Casa DJ, Pagnotta KD, Danielle E Pinkus, et al. (2011) Evidence-based practice and the recognition and treatment of exertional heat stroke, part I: A perspective from the athletic training educator. Journal of Athletic Training 46(5): 523-532.
- Heled Y, Rav Acha M, Shani Y, Epstein Y, Daniel S Moran, et al. (2004) The “Golden Hour” for Heatstroke Treatment. Military Medicine 169(3): 184-186.
- Lin SS, Lan CW, Hsu HY, Chen ST (2018) Data analytics of a wearable device for heat stroke detection. Sensors (Switzerland) 18(12).
- Gao W, Emaminejad S, Nyein HYY, Challa S, Kevin Chen, et al. (2016) Fully integrated wearable sensor arrays for multiplexed in situ perspiration analysis. Nature 529(7587): 509-514.
- Wu Q, Zhang X, Tian B, Zhang H, Yang Yu, et al. (2017) Wearable sweat detector device design for health monitoring and clinical diagnosis. IOP Conference Series: Earth and Environmental Science 69(1).
- Hunt PAF, Smith JE (2005) Heat illness. Journal of the Royal Army Medical Corps 151: 234-242.
- Cui W, Ostrander LE, Lee BY (1990) In Vivo Reflectance of Blood and Tissue as a Function of Light Wavelength. IEEE Transactions on Biomedical Engineering 37(6): 632-639.
- Lee J, Matsumura K, Yamakoshi KI, Rolfe P, Shinobu Tanaka, et al. (2013) Comparison between red, green and blue light reflection photoplethysmography for heart rate monitoring during motion. In: Proceedings of the Annual International Conference of the IEEE Engineering in Medicine and Biology Society 2013: 1724-1727.
- Anderson RR, Parrish JA (1981) The optics of human skin. Journal of Investigative Dermatology 77(1): 13-19.
