 Research Article
Abstract
Background: Cereal grains are one of the richest sources of important dietary fibers, proteins, vitamins, minerals, antioxidants, and other phytochemicals. However, flat flavor and poor sensorial properties make them less preferable to be consumed as raw. Fermentation improves the functional properties, texture, flavor, aroma, and restricts the growth of pathogens in the final product. Cereal based fermented drink has advantages over milk-based fermented food for vegans and people with milk allergies or lactose intolerance.
Methods: In the present study, to obtain a fermented beverage, a cereal mix was formulated using wheat flour, rice flour, and germinated barley flour in a 4.5:4.5:1 ratio and fermented with curd for 24 hrs. Proximate analysis, microbial analysis, and sensory analysis were done to evaluate the quality and shelf life of the fermented drink.
Results: Titratable acidity as lactic acid and protein content, was found 0.23% to 0.41% and 4.80% to 5.12% respectively. The fermented drink contained 9.83-10.12mg calcium, 9.29-9.38mg Iron, 7.36-7.49mg Sodium, and 7.13-7.88 mg magnesium per 100 gm. Sensory analysis showed overall acceptability of product till 10 days of storage. The product was found microbiologically safe, as no pathogens, mold, and fungi were observed.
Conclusion and Objective: The present study focused on developing healthpromoting cereal-based fermented beverage using rice flour, germinated barley, and other food adjuncts. The sensory, quality aspects, and microbial analysis for the above product were found acceptable among the consumers.
Keywords: Fermented Beverage; Cereals; Germination; Total Soluble Solids; Acidity; Microbial Analysis
Abbreviations:SEM: Scanning Electron Microscope; TSS: Total Soluble Solids; QDA: Quantitative Descriptive Analysis
Introduction
Fermentation is an anaerobic metabolic process of
microorganisms which is one of the foremost ancient ways to
preserve food. In addition to that, it is also a natural way to
enhance the nutritive value and also the appearance of the food
while destroying the detrimental elements of food [1]. The use of
fermented food is a long tradition, and a large number of fermented
food products are consumed throughout the world. Types of
fermented foods produced in a particular region depending on
the availability of raw material in that region and microorganisms
used for fermenting them. For instance, Kefir is a fermented drink
made from milk and Mushroom. Kavas is a traditional fermented
beverage of Russia made up of Rye flour and malt, Kumyss is
prepared in Russia and Turkey from sour and fermented milk. India
is also known for the consumption of a variety of fermented food
and different types of fermented foods and beverages also prepared
in a different region of India [2,3]. They are produced using various
manufacturing techniques [4]. In modern times, changes in lifestyle
and dynamic dietary pattern have led to the increasing supersede
of diseases like type 2 diabetes, coronary cardiovascular disease,
cancers, periodontal diseases, and obesity. Therefore, consumers’
demand for health-improving functional food has increased
tremendously in the last few years.
Now a day’s food is not only looked at as a way for satiety but
also as a mean for supplementation for disease prevention and control. Hence, wholesome foods are required to meet the public
requirement of healthy food. There are many kinds of fermented
beverages are available in the market, which are mostly milk or
fruits based fermented drinks. These beverages provide many
health benefits and serve as a good source of vitamins and minerals
that contribute to the overall strength of our body. Fruit-wine is
one of the fruit beverages which is undistilled alcoholic beverages
typically made up of grapes or alternatives fruits. Milk-based
fermented products have anti-microbial, anti-mutagenic, anticarcinogenic,
and anti-hypertensive properties [5-7]. Although
dairy products are good for health, but lactose intolerance and
cholesterol content are associated with them. Hence, to overcome
these demerits, non-dairy cereal-based beverages/foods could be
the best alternative to fruits or milk-based fermented dinks. Cereal
based fermented beverages are preferred over other fermented
beverages because cereals like rice and barley are the richest source
of dietary fibers, and minerals, fermentation improves their other
nutritional properties and enrich them in essential amino acids and
vitamins that are lacking in non-fermented cereals [8,9]. Barley is
also endowed with β-glucan and is known for strong antioxidant,
anti-inflammatory, and cholesterol-lowering abilities [10,11].
In India, cereals are preferred most in the form of breakfast
while some of them are used as main foods in the diet. Microbial
fermentation enhances the nutritional value of cereals and grains,
it solubilizes the phytate complex and reduces 40-60% antinutrients
(phytates, tannin, polyphenol) contents thus improves
the nutrient availability and increases the essential amino acids,
lysine, methionine, and tryptophan content, total soluble solids,
and non-protein nitrogen contents [12-14]. Fermentation has
also been shown to enhance the flavor, mineral bioavailability,
vitamin contents, and antioxidant properties of various cereals
[15-17]. During fermentation, micro-organism also produces many
bioactive and antimicrobial compounds [7]. Fermented beverages
prepared from different types of cereals (wheat, barley, and rice)
are well known in different parts of the world but least available
in India. They are comparatively cheap as compared to other milk
and fruit-based beverages. However, exhibit much higher health
benefits than other fermented beverages, presently available on
market. Therefore, the present study is planned to develop healthpromoting
cereal-based fermented beverage using rice flour,
germinated barley, and other food adjuncts. The sensory, quality
aspects, and microbial analysis for the above product was also
carried out.
Materials and Methods
Procurement of Raw Materials
The ingredients that were used for the formulation of fermented beverages, Wheat, Rice, and Barley (Wheat and rice are used in raw form whereas barley was germinated), were procured from the local grocery market in Mysore, Karnataka. The obtained raw material was stored at room temperature, in airtight containers.
Preparation of Mother Culture
Wheat and rice were pulverized and passed through 60 mesh. The lower fraction was taken for further product development. Barley was soaked and germinated and then dried. The dried germinated barley was then pulverized and passed through 60 mesh sieves. All the above ingredients (wheat, rice, and barley) were weighed, and curd culture (in a known amount) was added, followed by sugar. This mixture was kept in an Incubator at 35 °C for 24 hours (Image 1).
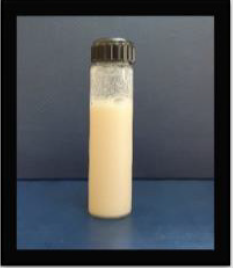
Figure 1: Mother culture*
This mother culture was further used for the formation of
final product by adding appropriate amount of ingredients.
Formulation of Beverage
The raw material viz wheat flour, rice flour, and germinated barley flour, were taken in a ratio of 4.5:4.5:1. A known amount of water (50 ml) was added, and the mixture was then heated on a hot plate (70-80 °C) for 10 min, cooled. A known amount of sugar (10 gm) and mother culture (1 ml) was added. This drink was then kept for fermenting at 37 °C for 24 hours. Then, the next day beverage was bottled and stored under refrigeration (Image 2).
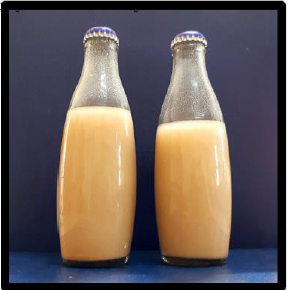
Figure 2: Fermented cereal Beverage.
Proximate Analysis of the Beverage
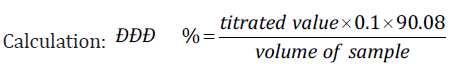
The moisture in the samples was determined by drying the samples at 130 ºC for 120 min by employing the standard methods of analysis. Crude protein was estimated using Micro- Kjeldahl method by the standard method of analysis [18]. Fat was estimated by rapid determination of fat in milk and their products i.e., the liquid sample is known as mozzyeller’s method. To determine the ash content of the above samples, the standard method outlined in AOAC was followed. Carbohydrate content was determined by difference. Carbohydrate (%) = 100% - (% moisture + fat + protein + ash)
Whereas the energy content was calculated based on the
formula
Energy (kJ/100g) = (Crude protein × 16.7) + (Crude fat × 37.7)
+ (Carbohydrate × 16.7)
Estimation of Minerals
Mineral content was determined using Atomic Absorption Spectrophotometry after digesting with concentrated hydrochloric acid using the standard method of analysis for Iron, Copper, Sodium, Magnesium, and Potassium [18].
Visual Properties
Color Measurement: The color of the sample was measured in accordance with CIE L*, a*, b*, color area system (Lab Scan XE Hunter Lab instrument, Virginia, USA) based on the tristimulus value. The L*, a*, b* values were recorded and ΔE values [difference of reflection value between the quality white (barium sulfate) and the sample] were calculated. A view angle of two degrees is used. The pore size of the illuminate is 1 inch. Color values of the samples determined by Hunter system L, a, b values. In the Hunter system, positive ‘a’ value indicates redness, and negative values indicate greenness. Positive ‘b’ values indicate yellowness and negative ‘b’ indicates and ‘L’ values lightness or brightness.
Scanning Electron Microscope (SEM): Scanning electron microscopy (SEM) was used to examine the starch granules in the different samples. For SEM, all the samples were mounted on aluminum stubs using double-sided tape, sputter-coated with gold, and investigated using an LEO 435VP, LEO Electron Microscopy Ltd., Cambridge, Electron) at an accelerated voltage and scanned. The final images were photographed at 20μm scale and 500X resolution [19].
Microbial Analysis of the Beverage
Pour plate method was employed for microbiological analyses of the drink. One ml of sample was drawn every day for up to 7 days and evaluated for the presence of bacteria and molds. Serial dilutions (10-4 and 10-6 ) were prepared in normal saline and 100 μl of the broth was spread and incubated at 30 and 37°C on
(i) Plate count agar,
(ii) YEPD, and
(iii) PDA for enumeration of total bacterial viable counts,
yeast, molds, and Lactobacillus, respectively. All the experiments
were carried out in triplicates. The cultures were isolated and
purified by streaking solidified agar medium recommended for the
group of organisms. The morphological, characterization was done
by Gram’s Staining.
Physicochemical Analysis of the Stored Beverage (Shelf- Life Analysis)
Acidity Test: The acidity test tells the amount of acid present in a solution. It is expressed as grams/liter (g/L). The titratable acidity is expressed as % of lactic acid and is determined by titration of a known amount of reconstituted sample with 0.1 N NaOH using phenolphthalein as an indicator.
Alcohol Test: The alcohol test determines how much alcohol is present in your sample. It is based on the property of protein to get unstable as a result of a disturbance in the mineral balance of the sample. Sample with having high developed acidity or having calcium and magnesium compound in greater than normal amounts will coagulate when alcohol is added.
pH Determination: pH is determined as the strength of an acid in the solution. The pH of the sample is analyzed before sterilization and also the pH of the fermented and unfermented samples is analyzed after 24 hours of incubation using a pH meter.
TSS by Refractometer: Total Soluble Solids (TSS) measured by Refractometer which optically measures the refractive index of juices, beverages, etc. it was determined at an ambient temperature (28±2°C). The refractometer was calibrated with distilled water before measuring the TSS of the sample. TSS was measured by placing a drop of beverage on the prism of the refractometer. All the analysis was done in triplicate.
Sensory Analysis
Quantitative Descriptive Analysis (QDA) is used for profiling the samples. A suitable core card with selective sensory attributes was used for this. The sensory quality of the product was judged by10- semitrained panelist using a 9-points Hedonic scale. The mean value for each attribute was calculated after panel judgment. All samples were acceptable and there was no perceptible off odor or off-taste in the sample. These were graphically depicted as “sensory profile”.
Statistical Analysis
The experiments were done in triplicates, and the average values were reported. Paired t-test was carried out for the Initial and final set of data, after carrying out the normality plots for the entire set of data.
Results and Discussion
The cereal-based fermented beverage contained wheat flour, rice flour, and germinated barley flour as the main ingredients. The beverage formulated had an acidity of 0.01-0.42% with a pH of 5.97- 3.68. The shelf life of the product was 10 days under refrigerated conditions (Images 1 & 2).
Proximate Composition of the Beverage
The moisture content of the sample drink ranged from 70.4 0-70.18 %, for 10 days. The paired t-test was carried out for the initial and final moisture content after 10 days of storage, wherein t (2) = 0.439, p=0.704, hence no significant difference was found between the moisture content initially and after storage of 10 days. An overall decrease of 0.22 % of moisture was observed over a period of 10 days (Table1). According to Karki, et al. [20] 2016, the moisture content in a Nepali alcoholic drink, was reported to be around 76-80%. The mean fat percentage of the sample was calculated as 0.113% to 0.100 % over 10 days period. Once again, no significant difference was observed in the fat content as reflected by t value, t (2)= 0.918,p=0.456. The overall fat decrease over a period of 10 days was found to be 0.01%. According to Obadina, et al. [21] the fat content decreased from 2.87% to 0.87% in a fermented soya drink nono. A decrease in the fat content of soymilk was found with the increase in fermentation time, this might be associated with the increased lipolytic enzyme contents during fermentation which degraded fat components (triacylglycerol) into fatty acid and glycerol. The mean protein percentage of the sample was increased from 4.80% to 5.12 %, over a period of 10 days. The overall increase in protein was around 0.32%, with a 95% confidence interval for the difference between the means of 0.10-0.53, which was found to be significant as reflected by t value, t (2) = 6.48, p=0.02.
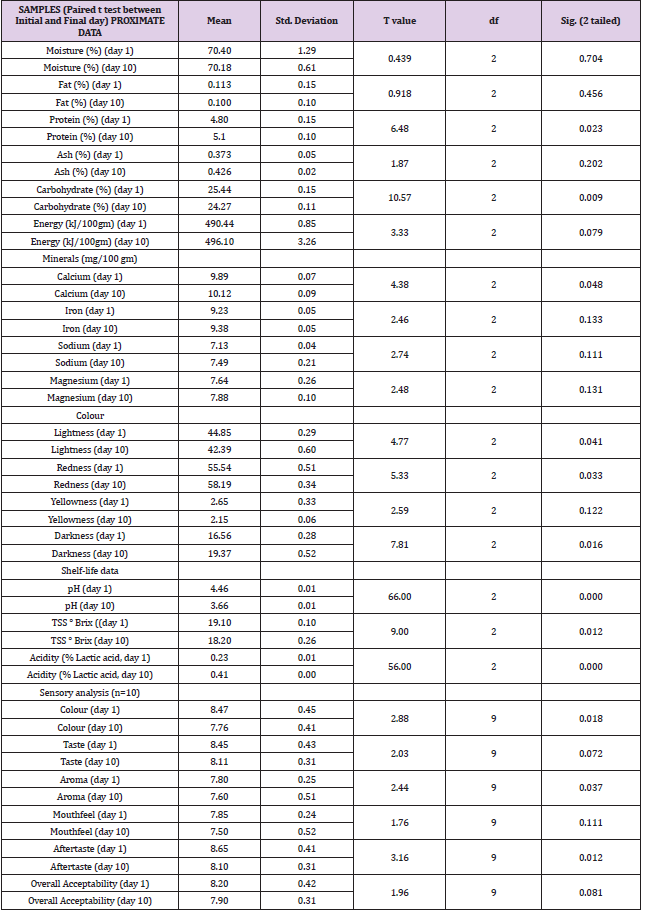
Table 1: PAIRED t test table for proximate, minerals, colour, shelf-life analysis, and sensory data (Initial and final day compared means).
The increase in protein contents may be reasoned due to some anabolic processes leading to polymer build-up or due to microbial cell proliferatio These findings were supported by Obadina, et al. [21] where protein concentration was estimated to increase from 2.69% to 5.09% after fermentation. The mean ash content of the drink was 0.37-0.42% over a period of 10 days. An overall increase of 0.05% in ash value was observed, however, there was a significant difference between the initial and final ash content, as reflected by t value, t (2)= .87, p=0.202. Shirley and Parsons [22,23] reported that change in ash contents may be linked to the change in protein composition. The mean carbohydrate content ranged between 25.44-24.27, with an overall decrease of 1.17 % over a period of 10 days. A significant difference was observed in the initial and final carbohydrate content as reflected by t value, t (2) =10.57, p= 0.009, with a 95% confidence interval for the difference between the means of 0.69-1.65. The mean energy content ranged from 490.44- 496.10 Kcal. The overall increase in energy was observed to be 5.65 kcal, however, it was not found to be significant, t(2)=3.33, p=0.079.
Mineral Content of the Beverage
The mineral content of the sample was done by Atomic Absorption Spectrophotometer. Minerals are the main component of any fermented drink. The Cereal-Based Fermented Drink was rich in Calcium, Iron, Sodium, and magnesium. The fermented drink contained 9.83mg/100g calcium, 9.29mg/100g Iron, 7.36mg/100g Sodium, and 7.13mg/100g Magnesium, after 24 hrs of fermentation (Table 1). However, after 10 days of storage, the mineral content was found to be 10.12 mg/100 gm calcium, 9.38 mg/100 gm Iron, 7.49 mg/100 gm sodium, and 7.88 mg/100 gm magnesium. No significant difference in mineral content was observed in the initial and final values except for calcium. The mean increase in calcium content was 0.22 mg/100 gm, t(2)=4.38, p=0.048, with a 95 % confidence interval for the difference between the means of 0.004- 0.44.
Visual Properties of The Beverage
Colour of Beverage: The redness is maximum as it measured (55.98), followed by the brightness that is measured as (44.54) the yellowness is very less that is (2.31), whereas the darkness is measured as (16.36). The overall brightness and redness are higher as compared to yellowness and darkness (Table 1). The redness usually increases after fermentation thus in this sample the redness is high followed by brightness, whereas yellowness slightly decreases after fermentation, which is reflected in the yellowness value for the beverage. Over a storage period of 10 days the Lightness, decreased by 2.45 % whereas redness and darkness increased by 3 %. A significant difference was observed in lightness [t(2)=5.33,p= 0.041], redness [t(2)= 4.77,p =0.033] and darkness [t(2)= 7.81,p= 0. 081].
Scanning Electron Microscope (SEM): Microstructural studies of raw material used as an ingredient of fermented beverages by scanning electron microscope revealed that substantial structural changes occurred during processing. All the samples were visualized under 500 x magnification and 100μm scale. The individual granules in the case of wheat were found to be polymorphic in shape and some were compact also. As regards the size, the most frequent were granules with a diameter4-6μm (Figure 1). On the other hand, the individual granules of rice were present in compact spherical bundles or clusters. The individual granules, in the case of rice starch, develop into compact spherical bundles or clusters, known as compound granules, which fill most of the central space within the endosperm cells (Figure 2). As regards the size, the most frequent were granules with a diameter of 2-5μm. whereas, in barley flour, the granules are normally small round in shape, and not in cluster form. The size ranged between 1-3μm (Figure 3).
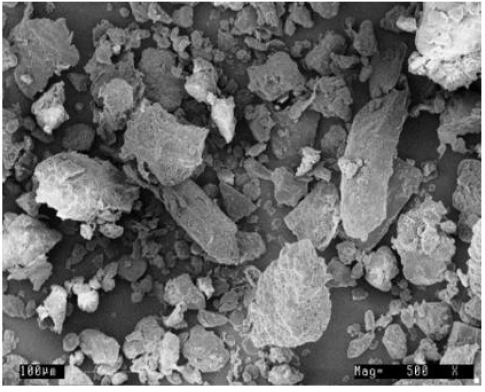
Figure 1: Pulverized wheat Flour, Scale 100 μm: 500 X.
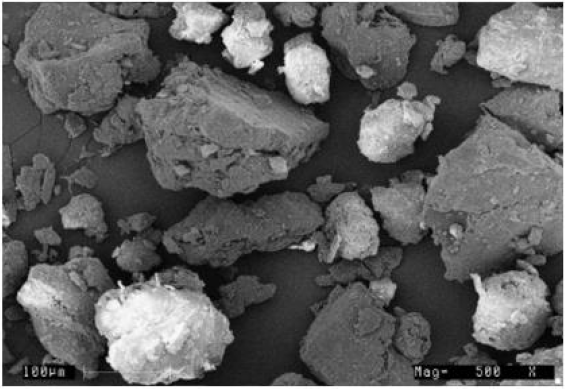
Figure 2: Pulverized Rice Flour, Scale 100 μm: 500 X.
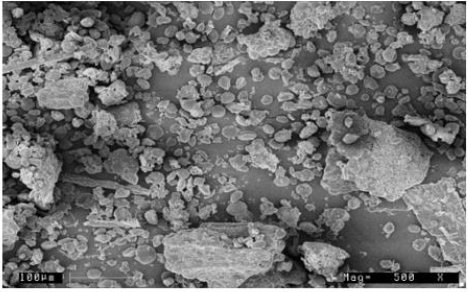
Figure 3: Pulverized germinated barley Flour, Scale 100 μm: 500 X.
Microbial Analysis of Beverage
The microbial quantification of samples was carried out on different culture medium for the total bacterial count, lactobacillus, yeast mold, and fungi count up to 7 days. Total bacterial count ranges from 5-10 X 104 CFU per ml, but no fungi and mold count were observed in the samples up to 7 days of incubation.
Shelf-Life Analysis
The samples were stored under the refrigerated condition for a period of 10 days. For analysing shelf life, samples were withdrawn daily and analysed for pH, Acidity, Alcohol, and TSS by Refractometer (Table 1). The pH is the main component of any fermented drink. The pH decreased initially after 24 hrs of fermentation from 5.97- 4.45. Over a period of 10 Days, the pH decrease was around 0.79 %. (4.45-3.68) (Figure 4). The decrease in pH was found to be significant [t (2) =66.00, p =0.000], with a 95 % confidence interval for the difference between the means of 0.74-0.84. The acidity ranged between 0.23% to 0.41% over a period of 10 Days. The overall increase in acidity was around 0.18% by the end of 10 days period. There was a significant difference between the initial and final acidity as reflected by t value, t (2) =56.00, p=0.000, with a 95 % confidence interval for the difference between the means of 0.17- 0.20. As pH decreased the acidity increased for the first five days after which acidity declined. There was no alcohol production in the fermented drink sample throughout the storage period. The TSS which is measured by refractometer ranged from 18° Brix to 20° Brix, however, after 5 days it reduced to 19.5° Brix and was finally recorded 18° Brix after a period of 10 days. The overall decrease in TSS over a storage period of 10 days was around 0.90° Brix. There was a significant difference in the TSS initial and final value as reflected by t value, t (2)= 9.00, p=0.012, with a 95 % confidence interval for the difference between the means of 0.46-1.33.
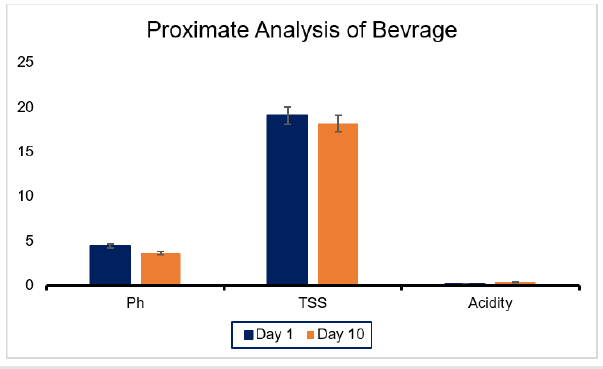
Figure 4: Shelf-life analysis of Beverage.
Sensory Analysis of Fermented Drink
Organoleptic valuation of a fermented drink made from cereal flour is given in (Table 1), (Figure 5). The preliminary evaluation by the untrained panel showed on Day 1 that all the attributes viz color, taste, etc. Of sample were in ranged between 7.5 to 8.5 which is acceptable (Table 1). On the initial day of tasting the mean color value was 8.47, whereas on the last day (Day-10) it ranged between 7.76. There was a significant difference in the color value as reflected by t value, t (9) =2.88, p= 0.018. The sensory scores for taste had a mean value of 8.45, which decreased to 8.11. However, it was not found to be significant, t (9) = 2.038, p=0.072. The aroma had a mean sensory score of 7.8, which decreased to 7.6, at the end of 10 days period. The difference was found to be significant, t (9) =2.449, p=0.037. The mouthfeel and aftertaste had a mean sensory score of 7.85 and 8.65, initially and after a 10-day duration scores were 7.50 and 8.10 respectively. However, the difference was found to be significant in the case of aftertaste, t (9) =3.161, p=0.012, whereas in the case of mouthfeel it was found to be non-significant, t (9) = 1.769, p=0.111. The overall acceptability of fermented drink on the initial day was 8.20, which was found to decrease to 7.90 at the end of 10 days duration. However, the difference was not significant, t (9) = 1.964, p=0.081. The distribution of taste, mouthfeel, and overall acceptability scores revealed that fermented drink produced from cereal flours are in the acceptable range, over a period of 10 days.
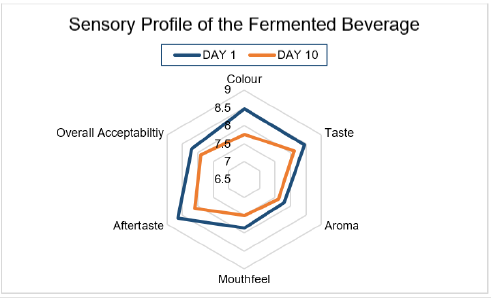
Figure 4: Sensory Profile of the Fermented Beverage.
Conclusion
India has a rich diversity of fermented foods, however, most of these food practices are regional and mostly confined within a specific community. The large diversity of Indian rice-based foods and beverages has the potential of being enriched resources for functional food development. This can be a new possibility to make an acceptable fermented product based mainly on rice and other food adjuncts’ which are suitable substrates that can support high cell viability during cold storage. In addition, the developed beverage combines, interesting nutritional qualities, and probiotics.
Funding
Appropriate Funding was provided by the Institute, CSIRCFTRI.
Author Contribution
SP conceived, supervised the work, and wrote the manuscript; KS carried out the experiments; MK carried out the microbial analysis and provided technical support.
Conflict of Interest
The authors declare there is no conflict of interest.
Acknowledgment
The authors acknowledge with thanks, the support and cooperation received from Director, CSIR- Central Food Technological Research Institute, Mysore, Karnataka.
References
- Shiby VK, Mishra HN (2013) Fermented milks and milk products as functional foods-A review. Critical reviews in food science and nutrition 53(5): 482-496.
- Roy B, Kala CP, Farooquee NA, Majila BS (2004) Indigenous fermented food and beverages: A potential for economic development of the high-altitude societies in Uttaranchal. Journal of Human Ecology 15(1): 45-49.
- Malo PM, Urquhart EA (2016) Fwemented foods: Use of starter cultures. Encyclopedia of food and Health Ed. Academic press, pp. 681-685.
- Motarjemi Y, Nout MJ (1996) Food fermentation: A safety and nutritional assessment. Joint FAO/WHO Workshop on Assessment of Fermentation as a Household Technology for Improving Food Safety. Bulletin of the World Health Organization 74(6): 553-559.
- Nout MR (2009) Rich nutrition from the poorest–Cereal fermentations in Africa and Asia. Food Microbiology 26(7): 685-692.
- Marsh AJ, Hill C, Ross RP, Cotter PD (2014) Fermented beverages with health-promoting potential: Past and future perspectives. Trends in Food Science & Technology 38(2): 113-124.
- Şanlier N, Gökcen BB, Sezgin AC (2019) Health benefits of fermented foods. Critical reviews in food science and nutrition 59(3): 506-527.
- McKevith B (2004) Nutritional aspects of cereals. Nutrition Bulletin 29(2): 111-142.
- Cáceres PJ, Peñas E, Martinez Villaluenga C, Amigo L, Frias J (2017) Enhancement of biologically active compounds in germinated brown rice and the effect of sun-drying. Journal of Cereal Science 73: 1-9.
- Idehen E, Tang Y, Sang S (2017) Bioactive phytochemicals in barley. Journal of food and drug analysis 25(1): 148-161.
- Šimić G, Horvat D, Lalić A, Koceva Komlenić D, Abičić I, et al. (2019) Distribution of β-glucan, phenolic acids, and proteins as functional phytonutrients of hull-less barley grain. Foods 8(12): 680.
- Gänzle MG, Schwab C (2009) Exploitation of the metabolic potential of lactic acid bacteria for improved quality of gluten-free bread. In The science of gluten-free foods and beverages. Proceedings of the First International Conference of Gluten-Free Cereal Products and Beverages, Cork, Ireland, pp. 99-111.
- Đorđević TM, Šiler Marinković SS, Dimitrijević Branković SI (2010) Effect of fermentation on antioxidant properties of some cereals and pseudo cereals. Food chemistry 119(3): 957-963.
- Nkhata SG, Ayua E, Kamau EH, Shingiro JB (2018) Fermentation and germination improve nutritional value of cereals and legumes through activation of endogenous enzymes. Food Science & Nutrition 6(8): 2446-2258.
- Wang CY, Wu SJ, Shyu YT (2014) Antioxidant properties of certain cereals as affected by food-grade bacteria fermentation. Journal of Bioscience and Bioengineering 117(4): 449-456.
- Ortiz D, Nkhata SG, Chilungo S, Memba A, Mponela P Ferruzzi (2017) Nutritional changes during biofortified maize fermentation (steeping) for ogi production. The FASEB Journal 7(9): 114-117.
- Ojha P, Adhikari R, Karki R, Mishra A, Subedi U, et al. (2018) Malting and fermentation effects on antinutritional components and functional characteristics of sorghum flour. Food science & nutrition 6(1): 47-53.
- (2000) Official Methods of Analysis of AOAC International (17th)., Gaitherburg, AOAC International Inc, USA.
- CHEN JJ, LII CY, LU S (2003) Physicochemical and morphological analyses on damaged rice starches. Journal of Food and Drug Analysis 11(4).
- Karki T, Ojha P, Panta OP (2016) Ethnic fermented foods of Nepal. In Ethnic Fermented Foods and Alcoholic Beverages of Asia, pp. 91-117.
- Obadina AO, Akinola OJ, Shittu TA, Bakare HA (2013) Effect of natural fermentation on the chemical and nutritional composition of fermented soymilk nono. Nigerian Food Journal 31(2): 91-97.
- Shirley RB, Parsons CM (2001) Effect of ash content on protein quality of meat and bone meal. Poultry Science 80(5): 626-632.
- Ortiz S Nkhata, A Buechler, T Rocheford, MG Ferruzzi (2017) Nutritional changes during biofortified maize fermentation (steeping) for ogi production. The FASEB Journal 31(1).
