 Research Article
Abstract
Purpose: Determine if collegiate athletes possess superior balance than the general population.
Design: Three hundred subjects, 68 collegiate athletes (21.0+3.5 Yrs) and 232 nonathletes (32.8+14.9 Yrs), were administered a battery of 5 balance tests, 3 static and 2 dynamic tests.
Analysis: Mann-Whitney non-parametric and one-way ANOVA parametric tests were used to analyze the balance results comparisons between the two groups.
Results: Non-parametric Mann-Whitney results indicated significant superior static and dynamic balance of the collegiate athletes except for the Stork static balance tests in both the dominant and non-dominant leg.
Abbreviations: Balance; Stability; Static and Dynamic Balance; Coordination
Introduction
Balance is important to maintaining a healthy lifestyle. It has
become an essential component of performance conditioning for
athletes trying to improve their athletic skillset or for the elderly
trying to sustain their quality of life by reducing the risk of injury
due to falls. The need for mobility while maintaining stability in a
static position or in a dynamic one is crucial to everyday life and
athletic competition. Programs have been developed to improve
an individual’s stability and mobility through balance exercise
programs that not only provide strength, endurance and flexibility
to major muscles used in specific movements but also their
associated stabilizing muscles [1]. No matter the present status of
a person’s balance, it can be improved [2]. As is the case for any
conditioning program, assessments must be administered before
a suitable program can be devised for the subject or the subpopulation
in question [3].
Balance is the ability to stay upright or stay in control of body
movement. There are two types of balance: static and dynamic.
Static balance is maintaining equilibrium when stationary, while
dynamic balance is maintaining equilibrium when moving. Eyes,
ears and ‘body sense’ are used to help retain balance [4]. Athletes “
possess an athletic skillset that is unique to their specific sport.
Their athletic performance is superior to the general population
by virtue of their genetics and their specific training. The purpose
of this study is to determine if collegiate athletes possess superior
balance than the general population.
Design
Three hundred subjects, 68 D-1 athletes and 232 non-athletes, were administered a battery of 5 balance tests, 3 static tests and 2 dynamic tests. The 68 collegiate athletes consisted of 43 males and 25 females who participated in basketball, baseball, volleyball, cross-country, track, tennis, and golf at the University of New Orleans, a D-1 university that competes in the Southland Conference. See Table 1 for the subjects’ physical characteristics. The study consisted of a convenience sample of 300 subjects. Prior to administering the battery of tests, the subjects were informed of the battery of tests that were to be performed, the description of the tests, and that the subjects could stop at any time during the tests. The subjects signed a consent form prior to the beginning of testing. The tests were conducted by University of New Orleans exercise physiology undergraduate students who were CITI-certified for Human Subjects Testing and trained to administer the battery of balance tests.
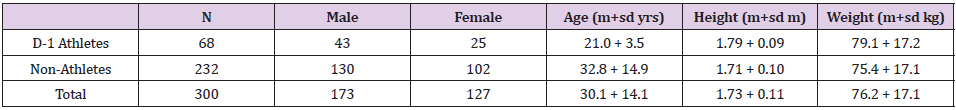
Table 1:Physical characteristics.
The battery of tests administered to the subjects consisted of the following tests. A brief description of the tests is also included [4-9]:
a) One-Leg Standing Balance Static Test (right and left leg)
Stand on 1 leg without holding onto anything. Normal balance
is one minute, less than 30 seconds will need some work.
b) Stork Balance Static Test (Right and Left Leg)
Place the hands on the hips, position the non-supporting foot against the inside knee of the supporting leg. The subject raises the heel to balance on the ball of the foot. The stopwatch is started as the heel is raised from the floor. The stopwatch is stopped if the hand(s) come off the hips, the supporting foot swivels or moves (hops) in any direction, the non-supporting foot loses contact with the knee, or the heel of the supporting foot touches the floor. Average time is 25-39 seconds. Poor is less than 10 seconds.
c) Timed Up-and-Go Dynamic Test
A chair is placed against a wall and a spot is measured and marked ten feet from the chair. The test is how long it takes to get up out of the chair, walk 10 feet, turn around, and sit back down. If it takes longer than 14 seconds, there is a high risk for falling.
d) The 5 Times Sit-to-Stand Dynamic Test
Sit in a chair. Whenever ready, stand up and down 5 complete times as fast as possible. Stand fully and sit down with the glutes touching the chair. Persons without balance problems can do this test in less than 13 seconds.
e) The Balance Error Scoring System Static Test [10]
There are six positions of the balance error scoring system
static test. Three stances (double-leg support, single-leg support,
and tandem) are held for 20 seconds on two surfaces (firm floor
and foam pad) for six permutations. During the tandem stance,
the dominant foot is in front of the nondominant foot. During the
single-leg stance, the subject stands on the nondominant foot.
During the test, the eyes are closed and the hands are held on the
hips (iliac crests).
Subjects are told to keep as steady as possible, and if they lose
their balance, they are to try to regain the initial position as quickly
as possible. Subjects are assessed one point for the following errors: lifting the hands off the iliac crests; opening the eyes;
stepping, stumbling, or falling; remaining out of the test position
for five seconds; moving the hip into more than 30° of hip flexion
or abduction; or lifting the forefoot or heel [6]. A trial is considered
incomplete if the subject cannot hold the position without error for
at least five seconds. The maximal number of errors per condition is
10. An incomplete condition is given the maximal number of points
[10]. The numbers of errors for all six conditions are summed
into a single score. For ages 20-39 years, mean+SD=10.97+5.05
errors; 50-54 years, mean+SD=12.73+6.07 errors; and 65-69 years,
mean+SD=20.38+7.78 errors.
Analysis
One-way analysis of variance (ANOVA) tests from the IBM Statistical Program for Social Sciences (SPSS) version 24 were used to compare the scores of the athletes versus the scores of the non-athletes. Levene’s homogeneity tests were used to validate the comparisons of the data. The Mann-Whitney non-parametric tests were used to analyze the tests that were not validated by Levene’s homogeneity tests. The level of significance was set at 0.05.
Results
Levene’s homogeneity tests did not validate the results of the 5 balance tests. Because the parametric one-way ANOVA results were not validated for all 5 balance tests, non-parametric Mann-Whitney tests were applied to analyze the results for all 5 of the balance tests. The non-parametric results for all the balance tests indicated that the athletes’ balance was significantly superior to the nonathlete balance results, except for the stork tests (right and left). See Table 2 for the non-parametric results. Levene’s homogeneity tests did not validate the one-way ANOVA results for the right and left leg one-leg tests, the 5 times sit-to-stand tests, and the balance error scoring tests. However, the tests did validate the one-way ANOVA results for the right and left leg stork tests and the up-andgo tests which confirmed the corresponding Mann-Whitney results. The one-way ANOVA results indicated there were no significant differences between the D-1 athletes and the non-athletes in the right and left leg stork static tests _ F (1,273) =.273, ρ>0.05 and F (1, 272) =.011, ρ>0.05, respectively; but there were significant differences between the D-1 athletes and the non-athletes in the up-and-go dynamic tests_ F (1, 279) =4.655, ρ<0.05. See Table 3 for test results.
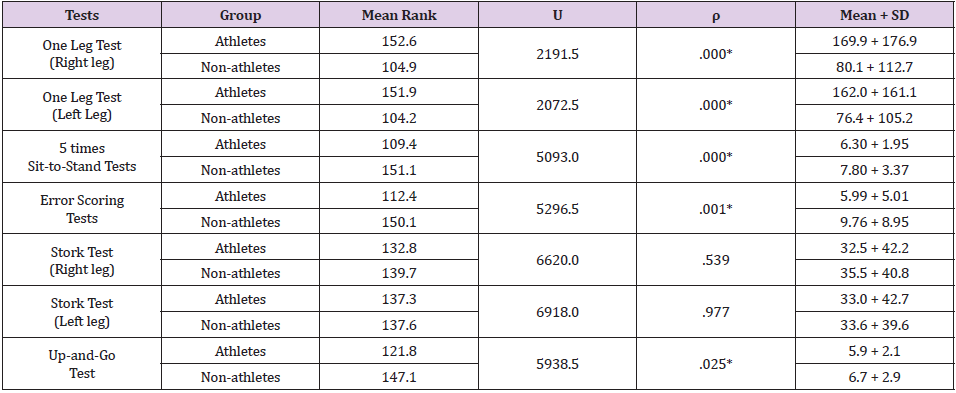
Table 2:Mann-Whitney Ranking Results.
*- Significant, Level of Significance ρ = 0.05.
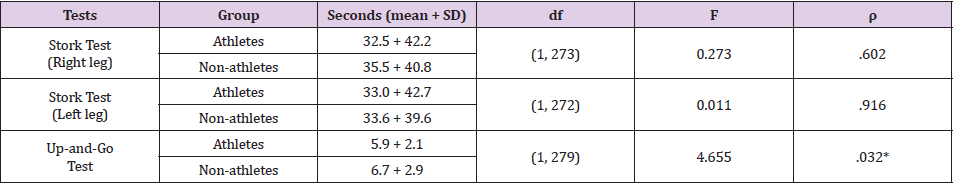
Table 3:One-Way ANOVA Results.
*- Significant, Level of Significance ρ = 0.05
Discussion
The study revealed that the athletes displayed significantly
superior dynamic and static balance as compared to the nonathletes
in all the balance tests except for the stork tests in both
the dominant and non-dominant legs. The athletes scored better
than the non-athletes in both the right and left leg stork tests, but
not significantly better. In the right leg stork test the mean average
and standard deviation for the athletes was 32.5 + 42.2 seconds,
while the non-athletes mean score was 35.5 + 40.8 seconds. In
the left leg stork test the athletes scored a mean average of 33.0
+ 42.7 seconds, and the non-athletes scored 33.6 + 39.6 seconds.
How can a subject or a group score significant changes in one
static balance test and not in another? The fact is that each test
measures balance in a different manner, but the differences provide
a better understanding about the subject or group. The one-leg
tests measure unipedal balance like the stork tests, but the oneleg
tests allow the subjects or groups to use the non-supporting
leg, the upper appendages, and the torso to move and contort to
maintain static unipedal balance. The stork tests also measure
unipedal static balance, but they restrict the subjects or groups
from using their non-supporting leg, their appendages, and/or
their torso to assist them in maintaining their static balance. So, the
subjects or the groups that display better proprioception and body
coordination in the one-leg tests are at an advantage to those that
do not. While the error scoring tests are also restrictive, only 2 of
the six components of the test measure unipedal static balance, the
remaining 4 measure bipedal static balance. The error scoring tests
measure static balance in different orientation planes on different
surfaces.
The study revealed that the athletes displayed superior dynamic
balance as compared to the non-athletes in both the up-and-go
dynamic balance test and the 5 times sit-to-stand dynamic test. The
up-to-go test measures the speed and agility of dynamic balance,
while the 5 times sit-to-stand test measures the explosiveness
of dynamic balance. The better dynamic balance of the athlete’s
group could possibly be attributed to improved strength, agility,
flexibility, and coordination due to increased athletic training and
conditioning. Increasing the number of subjects in the convenience
sample could improve the variances of the test subgroups, resulting
in the Levene homogeneity test values validating the one-way ANOVA comparisons for all five of the balance tests. The parametric
one-way ANOVA test is a much more sensitive test than the nonparametric
Mann-Whitney test.
Conclusion
The authors recommend additional testing to verify the results obtained from the study; and to secure larger samples that would include parametric analyses of all 5 balance tests used in the current study for a deeper insight into the balance skills of the two subgroups.
Acknowledgements
The authors would like to thank the certified UNO exercise physiology majors who participated as testers in this motor learning balance study. No grant or outside funding was provided for this project.
References
- Johnson B, Nelson J (1979) Practical measurements for evaluation in physical education. 4th (Edn). Minneapolis: Burgess.
- Sackley S, Gladman J (1998) The evidence for rehabilitation after severely disabling stroke. Phys Ther Rev 3(1): 19-29.
- Streiner D, Norman G (1995) Health measurement scales: a practical guide to their development and use. 2nd (Edn). Oxford: Oxford Medical Publications.
- Miller T (2012) NSCA’s guide to tests and assessments. Champaign, IL: Human Kinetics.
- Collen F, Wade D, Bradshaw C (1990) Mobility after stroke; reliability of measures of impairment and disability. Int Disabil Stud 12(1): 6-9.
- Riemann B, Guskiewicz K, Shields E (1999) Relationship between clinical and force plate measures of postural stability. Sport Rehabilitation 8(2): 71-82.
- Goldie P, Matyas T, Spencer K, McGinley R (1990) Postural control in standing following stroke; test-retest reliability of some quantitative clinical tests. Phys Ther 70(4): 234-243.
- Bohannon R, Larkin P, Cook A, Gear J, Singer J (1984) Decrease in Timed Balance Test Scores with Aging. Physical Therapy 64(7): 1067-1070.
- Giorgetti M, Harris B, Jette A (1998) Reliability of clinical balance outcome measures in the elderly. Physiother Res Int 3(4): 274-283.
- Iverson G, Kaarto M, Koehle M (2008) Normative data for the balance error scoring system: Implications for brain injury evaluation. Brain Injury pp. 147-152.
